 Research Article
The Exponentiated Power Akash Distribution: Properties, Regression, and Applications to Infant Mortality Rate and COVID-19 Patients’ Life Cycle
Nwankwo M Peace, Bright Chimezie Nwankwo and Okechukwu J Obulezi*
Department of Statistics, Faculty of Physical Sciences, Nnamdi Azikiwe University, Awka, Nigeria
Okechukwu J Obulezi, Department of Statistics, Faculty of Physical Sciences, Nnamdi Azikiwe University, Awka, Nigeria.
Received Date: October 03, 2023; Published Date: October 18, 2023
Abstract
The new three-parameter exponentiated power Akash distribution is introduced, and some of its mathematical properties are addressed. Its parameters are estimated by maximum likelihood. A regression model is constructed based on the logarithm of the proposed distribution. The new regression model is deployed to fit COVID-19 censored data with the age of patients and diabetic index as the regressors. The usefulness of the proposed model is proved using the infant mortality rate for some selected countries in 2021.
Keywords: COVID-19 data; Exponentiated-G class; Exponentiated Power Akash distribution; Infant Mortality Rate; Model Adequacy; Regression model
Introduction
Exponentiation of power distributions has one major advantage to model data that exhibit polynomial tendencies. Distributions of lower degrees do not match data of this sort. Measures from health sciences such as the mortality rate of people living with a particular epidemic, the spread of diseases; or from engineering such as the strength of a tensile string, the life of a mechanical appliance; or from the economic sector namely income distribution of workers, inflation rate, and exchange rate of currencies of developing economies are good examples where distributions of this nature are applicable.
Relevant studies are exponentiated power Ishita by [1], exponentiated Ishita by [2], exponentiated power Lindley by [3], and exponentiated Adya by [4]. Other related studies are [5-15]. Interestingly, many of these exponentiated power transformations are on one-parameter distributions. This suggests that the Lindley class of distributions has some usefulness in modeling. Members in this class include [16-25].
Modeling some universal events such as infant mortality rate and the life cycle of COVID-19 patients is dominating the literature due to the level of concerns these events have posed to every society. Importantly, events such as these are threats to life, and hence human extinction is at the heart of modelers.
The main objective of this article is to develop a new parametric regression model that will be able to fit some skewed censored data and the rest of the article is in the following arrangement: in section 2, the new model is formulated. In section 3, some of the properties are presented. In section 4, the estimation of the uncensored data procedure is carried out. In section 5, the log-transformed regression model equivalent of the proposed distribution is derived together with the estimation. In section 6, an application to the life cycle of COVID-19 patients with a history of diabetic Mellitus with their age disparity is done. In section 7, the second application on the infant mortality rate of some countries in 2021 is also done. The paper is concluded in section 8.
Formulation of the New Model
The Power Akash (PA) distribution proposed by [26] with c.d.f and p.d.f given as follows;
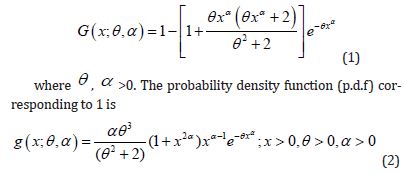
The PA distribution is a two-component mixture that contains a Weilbull distribution (with shape parameter α and scale parameter θ ), and a generalized gamma distribution (with shape parameters 3, α and scale parameter θ ) with mixing proportion

The c.d.f and p.d.f of the exp-G distribution with power parameter c > 0 are given by

respectively, whereξ is the parameter vector. By substituting equation 1 into equation 3 and equation 1 and 2 into 4, the c.d.f and p.d.f of the random variable X Exponentiated Power Akash EPA (c,θ ,α ) are as follows:


respectively. The hazard rate function is given as

Definition
(Linear Representation). Using the general binomial expansion, the pdf of the EPA distribution is given as follows;


The hazard function of EPA has a bathtub, increasing and decreasing shapes, see figures 3 and 4. This feature enhances the flexibility of EPA compared to the Power Akash and Akash distributions.
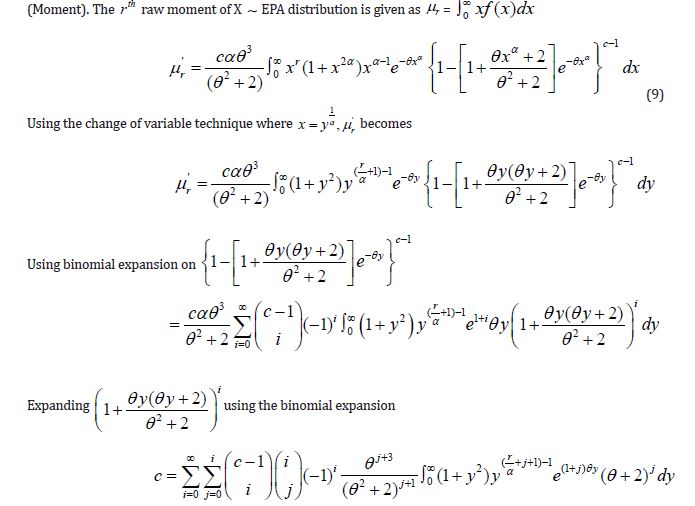
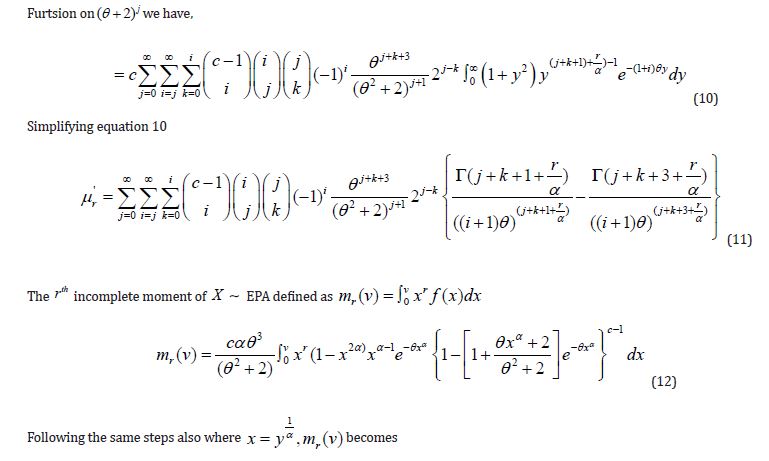
Properties
Definition

Estimation

The maximum likelihood of EPA is given as
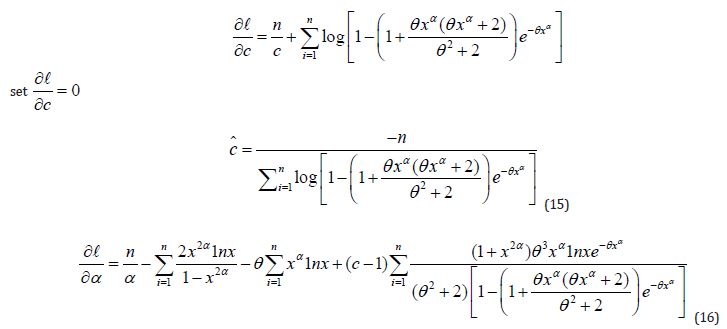
Equation 16 and 17 have no closed-form solutions and hence will be implemented in R using the known optim() function.

Regression

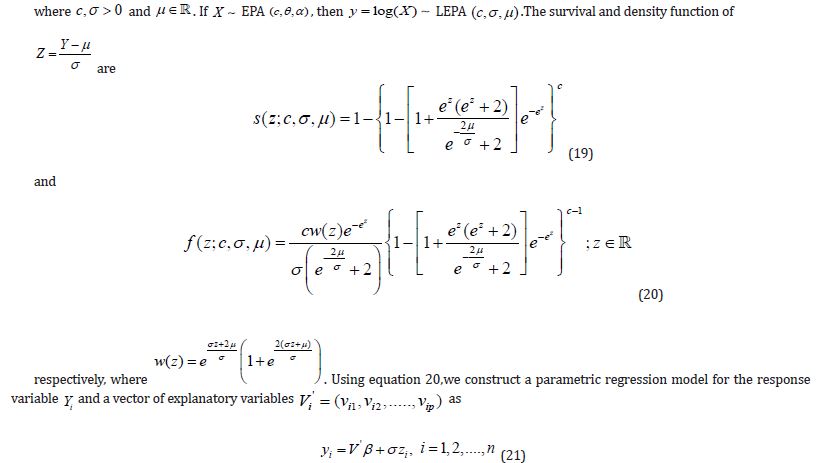
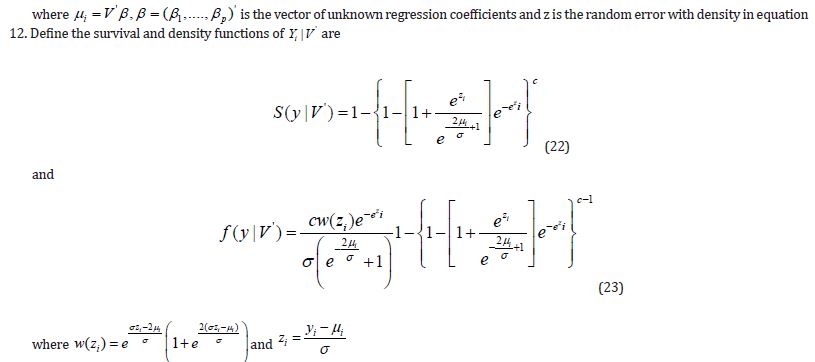
MLE of beta For Right-Censored Sample
Suppose the lifetime X of n individuals diagnosed with COVID-19 virus is EPA (℘) distributed. Let y |V ' be the response variable of a parametric regression model from the EPA(℘) distribution with pdf in eq 23. To estimate the parametersβ of the transformed model, the n individuals are quarantined and subjected to routine treatment at the same time. After time (t), (n − m) individuals recovers. If the lifetimes of the other m(> 0) individuals are denoted by 1 2 , ,...., m y y y .Then, the likelihood ofβ can be expressed as

where f ( y |V ' ) is the pdf in eq 23. It is witty to write

The unknown parametric regression coefficientsβ estimates are obtained using numerical iteration implemented in R.
Application to COVID-19 Data
The dataset comprises the lifetime (in days) of 322 individuals diagnosed with COVID-19 through RT-PCR screening in Campinas, Brazil. These data were previously studied by [1]. The response variable 1 y represents the time elapsed from the onset of symptoms until death due to COVID-19 (failure). [1] observed that about 66.45% of the observations are censored. The variables considered (f or i = 1,..., 322) include:

The Power Prakaamy (PP) distribution by [27], exponentiated Frechet (EF) distribution by [28], power Rama (PP) distribution by [29] and power Suja (PS) distribution (new) are used to compare with the proposed exponentiated power Akash (EPA) distribution. Note that the log- of each distribution is derived following the procedure in section 5 to obtain LPP, LEF, LPR, and LPS respectively.
The result from table 1 shows that the explanatory variables age and diabetes mellitus are significant at the 5% significance level. The negative signs of 1 β and 2 β mean that older individuals or those with diabetes tend to have shorter failure times. This result is in agreement with that obtained from [1] earlier study. From table 2, the LEPA regression has the lowest criterion values hence confirming that the LEPA model provides a better fit for the COVID-19 data.
Table 1: Estimates of the Regression parameters for the COVID-19 data.
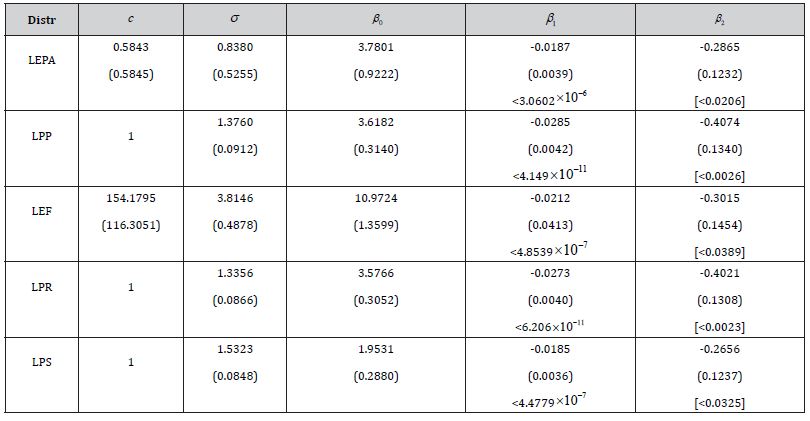
Table 2: Measures of model performance.


Application to Infant Mortality Rate Data
The data on infant mortality rate per 1,000 live births for a few chosen nations in 2021, as reported by https://data.worldbank. org/indicator/SP.DYN.IMRT.IN This real data set is presented as


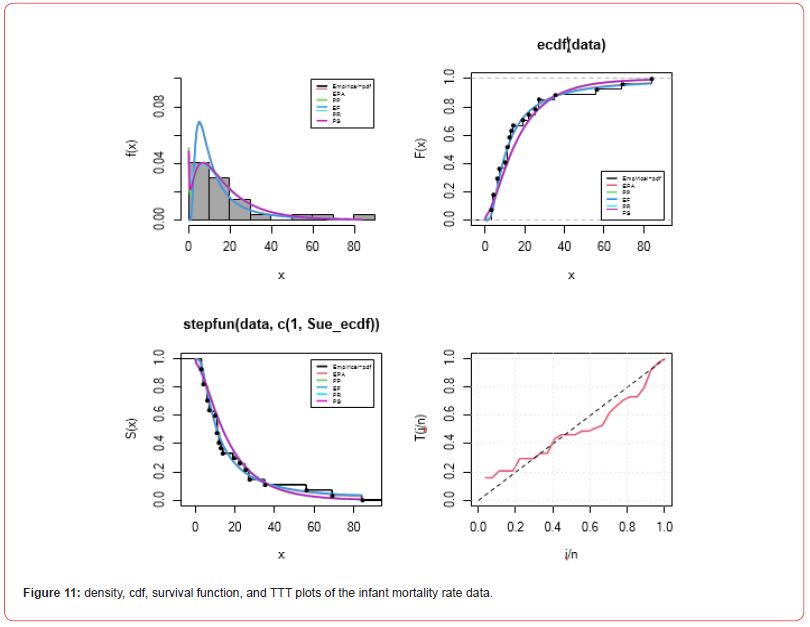
quick observation of the non-parametric plots in figures 8, 9, and 10 reveals that the infant mortality rate is right-skewed data. Probabil- ities taper off more slowly for higher values.
Table 3: Model Adequacy and Fitness Measures for the Infant Mortality Rate Data.

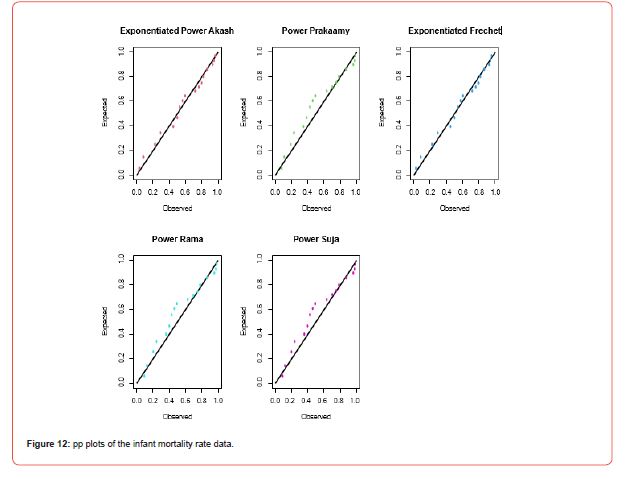
Using the following information criteria; Akaike information criterion (BIC), Corrected Akaike Information criterion (CAIC), Bayesian Infor- mation Criterion (BIC), Hannan–Quinn information criterion (HQIC), the adequacy of the model was proved since the proposed distribution has minimum value for each of the criteria. The K-S, Cramer von misses W* , Anderson Darling statistics A* , and p-value for the proposed distribution show evidence that the new distribution fits the given data more than the competitors.
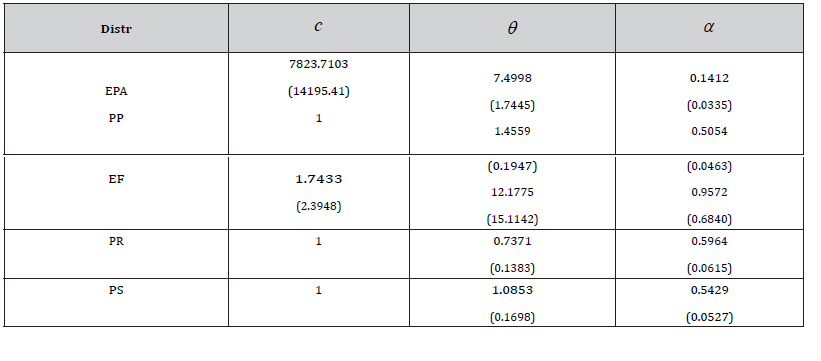
Table 4: MLEs of the unknown parameters using Infant Mortality Data.
Conclusion
In this article, a new lifetime distribution with the potential of modeling data with inherent polynomial nature as well as skewed data. The properties of the proposed distribution were derived and the log-transformation of the proposed distribution to develop a parametric regression model was carried out. The maximum likelihood estimation aided the estimation process for uncensored samples while the procedure for the estimation of the unknown parameters when data is censored was also shown. Essentially, the censored COVID-19 data set with the age of patients and diabetic mellitus index was deployed to justify the importance of the distribution. Furthermore, the distribution was fitted to the data on infant mortality rate (below age 5 years) reported for some countries by the World Health Organization in 2021. The distribution performs pretty well in both instances of application.
Funding
The authors declare that there was no external funding received for this article.
Acknowledgement
The authors laud the comments of the reviewers and editors which have enhanced the quality of this article.
Conflict of Interest
The authors declare that there is no conflict of interest.
References
- Alexsandro AF, Gauss MC (2023) The exponentiated power Ishita distribution: Properties, simulations, regression, and applications. In: Chilean Journal of Statistics (ChJS) 14: 1.
- Aafaq AR, Subramanian C (2019) Exponentiated Ishita Distribution: Properties and Applications. In: International Journal of Management, Technology and Engineering 9(5): 2473-2484.
- Samir K Ashour, Mahmoud A Eltehiwy (2015) “Exponentiated power Lindley distribution”. In: Journal of advanced research 6(6): 895-905.
- Rashid A Ganaie (2023) “EXPONENTIATED ADYA DISTRIBUTION: PROPERTIES AND APPLICATIONS”. In: Relia- bility: Theory & Applications 18.2(73): 39-49.
- Christiana I Ezeilo (2023) “Exploring the Impact of Factors Affecting the Lifespan of HIVs/AIDS Patient’s Survival: An Investigation Using Advanced Statistical Techniques”. In: Open Journal of Statistics 13(4): 594-618.
- Rabab S Gomaa (2023) “The Unit Alpha-Power Kum-Modified Size-Biased Lehmann Type II Distribution: Theory, Simu- lation, and Applications”. In: Symmetry 15(6):1283.
- AA Bhat, Sheik P. Ahmad, Ehab M. Almetwally, Nagla Yehia, Najwan Alsadat, et al. (2023) “The odd lindley power rayleigh distribution: properties, classical and bayesian estimation with applica-tions”. In: Scientific African 20: e01736.
- Hanan Baaqeel, Ahmed T. Ramadan, Beih S. El-Desouky, Ahlam H. Tolba (2023) “Evaluating the System Reliability of the Bridge Structure Using the Unit Half-Logistic Geometric Distribution”. In: Scientific African e01750.
- Ahmed T Ramadan, Ahlam H Tolba, Beih S El-Desouky (2022) “A unit half-logistic geometric distribution and its applica- tion in insurance”. In: Axioms 11(12): 676.
- Abuh Musa, Sidney I Onyeagu, Okechukwu J Obulezi (2023) “Comparative Study Based on Simulation of Some Methods of Classical Estimation of the Parameters of Exponentiated Lindley–Logarithmic Distribution”. In: Asian Journal of Probability and Statistics 22(4): 14-30.
- Abuh Musa, Sidney I Onyeagu, Okechukwu J Obulezi (2023) “Exponentiated Power Lindley-Logarithmic distribution and its applications”. In: Asian Research Journal of Mathematics 19(8): 47-60.
- Ahlam Tolba (2022) “Bayesian and non-Bayesian estimation methods for simulating the parameter of the Akshaya distri- bution”. In: Computational Journal of Mathematical and Statistical Sciences 1(1): 13-25.
- Ahlam H Tolba (2023) “The Gull Alpha Power Lomax distributions: Properties, simulation, and applications to modeling COVID-19 mortality rates”. In: Plos one 18(9): e0283308.
- Ahlam H Tolba (2023) “A New Distribution for Modeling Data with Increasing Hazard Rate: A Case of COVID-19 Pandemic and Vinyl Chloride Data”. In: Sustainability 15(17): 12782.
- Mmesoma Peace Nwankwo (2023) “Prediction of House Prices in Lagos-Nigeria Using Machine Learning Models”. In:European Journal of Theoretical and Applied Sciences 1(5): 313-326.
- Harrison O Etaga (2023) “A New Modification of Shanker Distribution with Applications to Increasing Failure Rate Data”. In: Earthline Journal of Mathematical Sciences 13(2): 509-526.
- Chidera F Innocent (2023) “Estimation of the parameters of the power size biased Chris-Jerry distribution”. In: Interna- tional Journal of Innovative Science and Research Technology 8(5): 423-436.
- Ifeanyi C Anabike (2023) “Inference on the parameters of Zubair-Exponential distribution with application to survival times of Guinea Pigs”. In: Journal of Advances in Mathematics and Computer Science 38(7): 12-35.
- Dennis V Lindley (1958) “Fiducial distributions and Bayes’ theorem”. In: Journal of the Royal Statistical Society. Series B (Methodological) pp. 102-107.
- Okechukwu J Obulezi (2023) “The Kumaraswamy Chris-Jerry Distribution and its Applications”. In: Journal of Xidian University 17(6): 575-591.
- Dorathy O Oramulu (2023) “Simulation Study of the Bayesian and Non-Bayesian Estimation of a new Lifetime Distribu- tion Parameters with Increasing Hazard Rate”. In: Asian Research Journal of Mathematics 19(9): 183-211.
- Okechukwu J Obulezi (2023) “Marshall-Olkin Chris-Jerry distribution and its applications”. In: International Journal of Innovative Science and Research Technology 8(5): 522-533.
- Okechukwu Obulezi, Chinyere P Igbokwe, Ifeanyi C Anabike (2023) “Single acceptance sampling plan based on truncated life tests for zubair-exponential distribution”. In: Earthline Journal of Mathematical Sciences 13(1): 165-181.
- Okechukwu J Obulezi (2023) “Statistical Analysis on Diagnosed Cases of Malaria and Typhoid Fever in Enugu-Nigeria”. In: GSJ 11(6).
- Chrisogonus K Onyekwere, Okechukwu J Obulezi (2022) “Chris-Jerry distribution and its applications”. In: Asian Journal of Probability and Statistics 20(1): 16-30.
- Rama Shanker, Kamlesh Kumar Shukla (2017) “Power Akash Distribution and its Applications”. In: Journal of Applied Quantitative Methods 12(3): 1-10.
- Kamlesh Kumar Shukla, Rama Shanker (2020) “Power Prakaamy distribution and its applications”. In: International Jour- nal of Computational and Theoretical Statistics 7: 01.
- Saralees Nadarajah, Samuel Kotz (2003) “The exponentiated Fréchet distribution”. In: Interstat Electronic Journal 14: 01-07.
- Berhane Abebe (2019) “A two-parameter power Rama distribution with properties and applications”. In: Biometrics and Biostatistics International Journal 8(1): 6-11.
-
Nwankwo M Peace, Bright Chimezie Nwankwo and Okechukwu J Obulezi*. The Exponentiated Power Akash Distribution: Properties, Regression, and Applications to Infant Mortality Rate and COVID-19 Patients’ Life Cycle. Annal Biostat & Biomed Appli. 5(4): 2023. ABBA.MS.ID.000620.
Competing risk, Multiple decrements, Crude probability, Net probability, Partial probability
-

This work is licensed under a Creative Commons Attribution-NonCommercial 4.0 International License.


