


 Research Article
Statistical Analysis of Ebola Virus Disease outbreak in Some West Africa Countries using S-I-R Model
Received Date: May 28, 2019; Published Date: May 31, 2019
Abstract
The 2013-2016 West Africa Ebola virus outbreaks has brought to light the relevance of epidemic modeling at a time when many acute illnesses are no longer considered a credible threat to Public Health. The increasing connectivity between regions, countries, and continents makes it to understand the mechanisms that drive the spread of new acute illnesses and our ability to control them at the source more important now than ever before. Ebola virus in particular is deadly, poorly understood, and capable of causing a large-scale threat to Public Health. The general epidemiology of the Ebola Virus Disease (EVD) is considered, analyzed statistically and modeled using the SIR model. The non-linear systems of differential equation formulated were solved numerically using Ms Excel spread sheet over time period of 120 days. For simplicity, Guinea as one of the three West African Countries that was hit severely by EVD in 2014 was used for this study. As stated earlier, modeling infectious disease dynamics demands that we investigate whether the disease spread could attain an epidemic level or it could be wiped out. The Ebola Virus Disease is spread largely through contacts between an infected person and a non-infected person. Infected people cannot be entirely separated from the rest of the large population. The separation can only be done when an infected person visits a health center.
Keywords: Ebola; West Africa; WHO; SIR model; Fatality
Introduction
Ebola virus in particular is deadly, poorly understood, and capable of causing a large-scale threat to Public Health. Ebola Virus Diseases which is also known as Ebola hemorrhagic fever, (or EHF), is a viral hemorrhagic fever of humans and other primates caused by Ebola viruses [1]. Ebola is a rare and deadly disease caused by infection with one of the Ebola virus species. According to the WHO [2], Ebola is caused by infection with a virus of the family Filoviridae. The disease, which the World Health Organisation declared an outbreak on 23rd March 2014, first occurred in Yambuku, Democratic Republic of Congo and surrounding areas in 1976. The disease was spread close personal contact and by use of contaminated needles and syringes in hospitals/clinics [3]. This outbreak was the first recognition of the disease. Since then, there have been many outbreaks with the latest in Guinea, Liberia and Sierra Leone. Now the Ebola Virus Disease which began in December 2013 and killed a two-year-old boy in Guinea, was the beginning of an outbreak in that year and killed over 5000 people in a year, leaving hundreds of children orphaned and affecting thousands more [3].
The virus’ exact origin, location and natural habitat is considered to be within the region’s fruit bat population, with the fruit bats (of the Pteropodidae family) carriers of Ebola, but unaffected by it [4]. Although, non-human primates have been a source of infection for humans, they are not thought to be the reservoir but rather an accidental host like human beings [2]. Humans can catch the virus from animals through close contact with infected animals’ blood, secretions, organs or other bodily fluids, although transmission between natural reservoirs and humans is rare. Outbreaks are often traceable to a single index case where an individual has handled the carcass of a gorilla, chimpanzee, or duiker or the bushmeat trade (the catching and eating of wild animals, including primates such as gorillas and chimpanzees) Calculating the case fatality rate (CFR) accurately is difficult in an ongoing epidemic due to differences in testing policies, the inclusion of probable and suspected cases, and the inclusion of new cases that have not run their course. In August 2014, the WHO made an initial CFR estimate of 53%, though this included suspected cases. In September and December 2014, the WHO released revised and more accurate CFR figures of 70.8% and 71% respectively, using data from patients with definitive clinical outcomes. The CFR among hospitalized patients, based on the three intense-transmission countries, was between 57% and 59% in January 2015 [3].
Calculating the CFR accurately is very difficult due to testing policies and there is the need to understand the epidemiology and patterns of the diseases. The Epidemiological Model will now be considered. Therefore, the Susceptible(S), Infected (I) and Recovered (R) generally called the SIR model first developed by Kermack and McKendrick (1927) is introduced in this study to model the spread of the Ebola Virus Disease (EVD) mathematically to know if the epidemic would ever die out and also understand the behavior of the transmission and recovery incidence of the disease to help Policy makers, Governments and Public Health experts in containing future outbreaks [1].
Origins of mathematical modeling of infectious diseases go back to the early 1900’s. With an increasing risk of population illnesses in a society; disease modeling has become a significant part of epidemic control. Mathematical models can project how infectious illnesses progress, predict an epidemic, or help us to calculate the effects of possible interventions [5]. Over time many models have been developed and it is not a surprise that different diseases require specific ways of modeling them. Possible questions as the following can arise. Does there exist a cure for the disease? Can people catch the disease multiple times? Is there a known vaccine for the disease? One has to consider all the options to create a meaningful model.
It is the objective of this study is to understand the spread of the EVD and develop a mathematical model, which is S.I.R. This model consists of a system of Ordinary Differential Equation (ODE) incorporate specific features of contact tracing in the epidemics. Lastly, the study seek to describe the S.I.R model, use the model on the initial data for Guinea as it is where the outbreak first begun and then later apply it to other two countries and to analyze the relationship between the cases and death rate of people infected with the virus.
This study focuses on the application of S.I.R models and statistical analysis to understand the EVD in West Africa countries (Guinea, Liberia and Sierra Leone. The data used was generated from World Health Organization (WHO). The assumptions of the S.I.R model are:
I. The diseases spread or outbreak is severe
II. Any individual in the population has an equal probability of contracting receiving EVD
III. The number of people leaving a certain category is equal to the number of people joining a new category (i.e. the number of people leaving the susceptibility category is equivalent to the number of people joining the infected category)
IV. The rate of recovery is faster than the time scale of birth and death
V. There is homogenous mixing of population whereby each individual encounters contact with similar people in ratio to each category
VI. Everyone who gets infected is removed from the population either through recovery or death.
VII. From the assumption, we can write;
In the model, the two parameters α and β would be used to represent the transmission and recovery rate respectively
Literature review
A model is an appropriate representation of a given part of the material world, the study or understanding of whose part it facilitates. An epidemic model is a simplified means of describing the transmission of communicable disease through individuals. Some of the well-known models for the transmission dynamics of some diseases include: Ronald Ross model for control of malaria [6]; Capasso and Pareri-Fontana (1979) model for the 1973 cholera epidemic [7]; Hethcote and Yorke (1984) model for the spread and control of gonorrhea [7]. This model was created by Kermarck and Mckendrick [8] in which a fixed population was divided into compartments with some assumptions about the nature and time rate of transfer of disease from one compartment to the other. When dealing with locations with large number of people, deterministic compartmental mathematical models are used.
The mathematical model used in simulating the Tuberculosis disease population dynamics was formulated by Koriko et al. [9]. In the model, it is stated that tuberculosis disease population dynamics depends more on the number of actively infected individuals in the population at the initial time and also on the disease incidence transmission rate at a given time. The transmission dynamics of Ebola Zaire virus was simulated [1] using models, namely, a modified SIR model with the understanding that the recovered can become reinfected again and the infected can die at a certain rate and a quarantine model, which ascertained the effects of quarantining the infected. He also formulated an appropriate system of Ordinary Differential Equation (ODE) for the transmission and used method of linear stability to solve the equation.
Rachah et al. [5] gave a comparison between two differential mathematical models used in the description of the Ebola virus propagation in West Africa was giving by Rachah et al. [5]. He investigated the two models in order to improve the prediction and the control of the propagation of the virus and particularly studied the case when the two models generate two similar results. Nishiura et al. [3], estimated the effective reproduction number of Ebola virus estimated using country-specific data reported from Guinea, Liberia and Sierra Leone to the World Health Organization from March to August, 2014. He observed that the reproduction number for three countries lies consistently above 1.0 since June 2014.
The effects of the Ebola outbreak in Congo in 1995 and Uganda in 2000 was modeled by using a modified variation of the original SIR model. In the study, they quantified the effectiveness of interventions in terms of the reproductive number and they were able to conclude that the interventions were successful in controlling the epidemic. This work presents the application of the standard SIR model to understand the 2014 Ebola Virus
Material and Methods
We consider the mathematical formulation for the least square analysis on the estimation of the Cases and Deaths of people infected with EVD, and also for the S-I-R Model to generate whether the disease spread will attain an epidemic level or wiped out. The Least square analysis method is the most commonly employed and a very satisfactory way to isolate the trend. This is by means of the objectively determined mathematical equation. The type of mathematical equation in a particular time series will depend upon the type of the trend, for the trend may show a constant change in one direction or in more than one direction. In this project, a linear mathematical equation was employed since there is only a one directional change in the trend.
Although one can use non-linear equation, but this is strictly used when there is more than one directional changes.
The linear equation used in isolating or fitting the trend line is given as:
Yc = abX
Y=Dependent variable
X=Explanatory variable
a=value of Y, when X=0
b=the amount of changes that come in Y for a unit change in X,
The S.I.R model
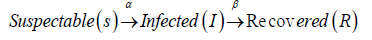
The Susceptible , Infected/Infective and Recovered/Removed Model is used in epidemiology to show the interaction between the number of people who are susceptible to a disease, those who are currently with the infection and those who have recovered or died at a given time in a population.
This can be represented mathematically below:

Where S=number of people that are susceptible to Ebola
I= number of people infected with Ebola
R= number of people recovered from Ebola with total immunity and represent Transmission rate and Recovery rate respectively
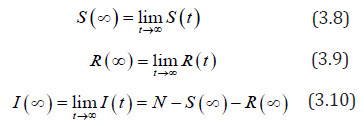
Let N be given as the total population of people within the affected environment. It makes sense to assume that a fixed population of people, whereby there are no births and deaths by natural cause, consists of the number of people susceptible plus the number of people infected plus number of people resistant:
N = S + I + R
The assumption that N is fixed, with no births or deaths, makes sense given 120 days, although it is a simplification.
These variables change over time, so I will define the variab t=timein days. I will set t = 0 at the start of January 2014.
Therefore, we have:
N = S (t ) + I (t ) + R(t )
A two-dimensional system of three autonomous differential equations with state variables is given as:
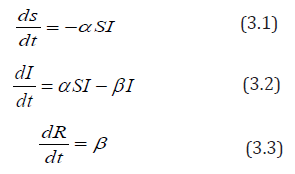
equation (3.1) ds/dt means the rate of change of the number of people susceptible to the disease over time.
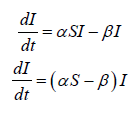
In Equation (3.2), dI/dt means the rate of change of the number of people infected
In Equation (3.3), dR/dt means the rate of change of the number of people recovered over time.
In order to calculate α (the rate of transmission) and β (the rate of recovery), I we need to define two or more parameters.
D=duration of disease for those recovered
M=mortality rate for those who die per day (0.7 for EVD)
This leads to two further equations.
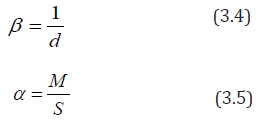
In equation 4, the rate at which the disease is spread can be found by dividing 1 by the duration of the disease. This is because; a certain individual can only experience one recovery in a given period of time. For example, if the duration of the infective period is 10 days, then the rate at which those who are infected become recovered is:
1/10=0.1=10%
Equation 5 illustrates that the infection rate of the disease is dependent upon the mortality rate and the number of people susceptible to the disease. It demonstrates the rate at which the disease passes from a susceptible individual to an infected individual. The transmission rate α always lies between and because a value of suggests infection rate and a value of suggests infection rate. For example, if the mortality rate of the population is and the number of people susceptible is , then we have:
α = 0.5/50= 0.01
Suppose that each infected individual has k number of contacts from the susceptible compartment per unit time, then we have
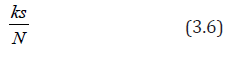
Where is contact rate
Also if a fraction of the contacts made, results in transmission of the EVD, then each infected individual infects kzs N individual per unit time. That is:

Where a = kz
Transmissibility of infectious disease
From equation (1),
ds/dt = −α SI the only way an individual can leave the susceptible compartment is by coming into contact with somebody who has the EVD and because of this, the righthand side (RHS) of equation (1) is negative.
Therefore, we have:
ds/dt ≤ 0
From equation (3.3)
dR/dt= βI , the only way a person is removed through recovery or death is by being infected with EVD.
Therefore, we have:
dR/dt ≥ 0
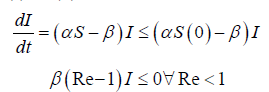
Since 0 ≤ S (t ) ≤ S (0) ≤ N and R(0) ≤ R(t ) ≤ N we have:
Since the total population is given by N = S + I + R Therefore, there exist a long term.
Theorem 1:
Proof that Re ≤1, then I (t)decreases monotonically to zero as t → ∞
Proof:
From equation (2)
recall that 0 ≤ S (t ) ≤ S (0) ≤ N , We have:
From equation (2) again

i.e. I (t ) increases as t=0, equation (3.2) implies that I (t ) has only one non-zero critical point .
Hence, the theorem is proven.
Result
The following are the expected results of the least square analysis on the cases and death of people affected with EVD (Guinea, Liberia and Sierra Leone) after the estimation, and also the output results of S-I-R model analysis on EVD.
The Expected Least Square Analysis Result for both the Cases and Deaths
The following are the expected computed value result for the Cases and Deaths in Guinea, Liberia and Sierra Leone for April 2017 in case care is not taken by the least square estimated trend (t) will be:
Guinea Case: Yc = 5.50 − 44.64(6.25) = −273.5
Guinea Death: Yc = 97.85 − 28.79(6.25) = −82.09
Liberia Case: Yc = 406.85 −130.75(6.25) = −410.34
Liberia Death: Yc =185 − 56.37(6.25) = −167.31
Sierra Leone Case: Yc = 542.85 −126.56(6.25) = −248.15
Sierra Leone Death: Yc =152.15 −126.56(6.25) = −111.48
The Graphical interpretation of the model is presented in graphical form below: (Figure 1-6)

The expected least Square analysis result for both the Cases and Deaths show that since all those result for the value are negative that means the death rate are later decreasing as the rate of the cases decrease due to the intervention from World health Organisation (WHO) with the use of Vaccines and due to the understanding the transmission behaviour and recovery incident of the diseases through mathematical modelling. The prediction also shows that with the continuation of the Vaccines usage, both the cases and deaths would be completely wiped out.
From Figure 1 it is observed that the number of individuals susceptible to the EVD remains the same for the first 18 to 22 days. As these individuals come into contact with infected people and begin to show signs or symptoms of the disease, they are taken to the infective compartment. However, as the infection continues, there is a steep decline in the susceptible compartment. Towards the end of the 3 months’ perio there is little or no change in the number of susceptible people as a result of a decline in the number of infected individuals. This is because everyone infected is removed through recovery or death.
From Figure 2 the number of infected individuals increases from the first 15 to 30 days probably because of the uncertainty of the EVD which allowed a greater transmission rate. The maximum number of infected individuals is seen on the 30th day and this indicates the number ever to be infected and after this point the infection rate decreases.

From Figure 3 The graph of the recovery/removed compartment increases as the number of infected individuals’ decreases. This is mostly because of increased awareness of the disease and other medical support given by stakeholders and public health experts.

The graph of the interaction between all three compartments is shown in Figure 4 for Guinea and in Figure 5 & 6 for Liberia and Sierra Leone, respectively. This gives a better understanding into the behavior of the spread of the disease. The graph also shows that the total population remains constant throughout the fourmonth period in Guinea via a linear correlation. This is because, as established earlier, N = S + I + R and in order to detect a change in something we need to differentiate it. In this case, the graph suggests no change, so the differentiation must be equivalent to zero.


Therefore, (S + I + R)′ = S′ + I′ + R′ and by substituting the differential equations (1), (2) and (3), we get the following: (S + I + R)′ = −α IS +β I +α IS −β I = 0
Thus, there is no change in the population, and it will remain constant in a given period of time.
Conclusion
By using an SIR model, we were able to see the importance of modelling data. Further insight was gathered in the ways in which modelling can be used to predict the apparent spread of diseases in order to inform health care superficial of the necessary precautions that must be in place.
However, Public Health experts can prevent infection from developing into an epidemic by reducing the effective reproductive number . This can be done by reducing by giving vaccines to those who are susceptible to the disease. The contact rate k, can be reduced by self-isolation of susceptible individuals and also the transmissibility z can be reduced by encouraging the washing of hands and the use of hand sanitizers. However, the results obtained from modelling data can lead to differing perspectives and interpretations. This is due to the unequal distribution of data across the world whereby in countries such as Liberia, there is very little access to the statistics which makes it difficult to make constructive predictions concerning the outbreak. However, in countries such as UK, the data is more widely available making developing countries and their governments dependent on them. This caused an exaggerated media coverage leading to the development of irrational fears which promoted the prevalence of more resilient and contagious diseases such as tuberculosis. The deaths that arose from Ebola only account for a tiny fraction in comparison to other causes of deaths such as malaria and HIV/AIDS. Nonetheless, due to the inflation of the situation, much research has been conducted in order to create a potential vaccine against it. Through completing this exploration, we were able to see the impact of mathematical modelling and the influences it has in helping scientists to analyse epidemics and help prevent further disruption. The SIR model showed the general trend of the epidemic, however due to its limitations which eventually outweighed the advantages, the model did not precisely correspond to the real life data, although they mostly illustrated similar correlation.
Acknowledgement
None.
Conflict of interest
No conflict of interest.
References
- Amenaghawon CO, Diakhaby A (2015) Mathematical Modeling of the Transmission Dynamics of Ebola Vireus. Applied and computational Mathematics vol (4): 313-320.
- WHO (2014) Data published on 12 November 2014, Data on new cases per epi week for Guinea?
- Nishiura H, Chowell G (2014) Early transmission dynamics of Ebola virus disease (EVD), West Africa. Euro Surveill 19(36): 1-6.
- Leslie T (2014) Ebola: what is it and how does it spread? ABC News.
- Rachah A (2015) Mathematical Modeling, Simulation and Optimal control of the 2014 Ebola Outbreak in West African. Discrete Dynamics in Nature and Society
- Brauer F, Wu J, Driessche PVD (2008) Mathematical Epidemiology, Springer-Verlag, Berlin Heidelberg.
- Murray JD (2002) Mathematical Biology: 1. An Introduction, Springer Science & Business Media, New York, USA.
- Kermarck WO, Mckendrick AG (2015) A contribution to the Mathematical Theory of Epidemics. Springer, London.
- Koriko OK, Yusuf TT (2008) Mathematical Model to simulate Tuberculosis Disease Population Dynamics. American Journal of Applied Sciences. [On-line] 5(4): 301-306.
- Wikipedia (2015) Epidemic Model.
-

This work is licensed under a Creative Commons Attribution-NonCommercial 4.0 International License.


