


 Short Communication
Maximum Likelihood Estimation in an Alpha-Power
Received Date: May 26, 2019; Published Date: June 03, 2019
Abstract
In this paper a new kind of alpha-power transformed family of distributions (APTA-F for short) is introduced. We discuss the maximum likelihood method of estimating the unknown parameters in a sub-model of this new family. The simulation study performed indicates the method of maximum likelihood is adequate in estimating the unknown parameters in the new family. The applications indicate the new family can be used to model real life data in various disciplines. Finally, we propose obtaining some properties of this new family in the conclusions section of the paper
Keywords: Maximum likelihood estimation; Monte carlo simulation; Alpha-power transformation; Guinea Big data
Introduction
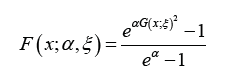
Mahdavi and Kundu [1] proposed the celebrated APT-F family of distributions with CDF
where 1 ≠α > 0,  and ξ is a vector of parameters all
of whose entries are positive. By modifying the above CDF, the
Zubair-G family of distributions appeared in [2] with the following
CDF
and ξ is a vector of parameters all
of whose entries are positive. By modifying the above CDF, the
Zubair-G family of distributions appeared in [2] with the following
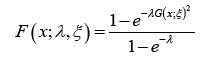
CDF
where α > 0, and ξ is a vector of parameters all of
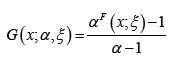
whose entries are positive. Subsequently in [3] we introduced the
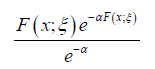
Ampadu-G family of distributions by modifying the above CDF, to
give the following CDF
where λ > 0, , and ξ is a vector of parameters all of whose
entries are positive. Consequently, we introduced new variants of
the APT-F family of distributions, which are recorded in the table
below (Table 1).
Table 1: Variants of the Alpha Power Transformed Family of Distributions.

The rest of this paper is organized as follows. In Section 2 we introduce and illustrate the new family. In Section 3 we derive the quantile function of the APTA-F family of distributions. In Section 4, we discuss approximate random sampling from the APTAF family of distributions, and maximum likelihood stimation in Section 5. Section 6 presents simulation results associated with the APTA-F family of distributions, assuming F follows the Weibull distribution as defined in Section 2. Section 7 discusses usefulness of the APTA-F family of distributions in fitting real-life data. Section 8 is devoted to the conclusions.
The New Family
Definition 2.1. Let , , and F (x;ξ ) be a baseline CDF all
of whose parameters are in the vector ξ . We say a random variable
X follows the alpha-power transformed distribution of the Ampadu
type (APTA-F for short) if the CDF is given by
, and F (x;ξ ) be a baseline CDF all
of whose parameters are in the vector ξ . We say a random variable
X follows the alpha-power transformed distribution of the Ampadu
type (APTA-F for short) if the CDF is given by
If the baseline distribution is given by the Weibull distribution with CDF

for x, a,b > 0 , then we have the following from the above definition
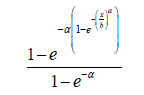
Proposition 2.2. The CDF of the APTA-Weibull distribution is given by
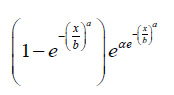
Where x,a,b > 0 and
Notation 2.3. If a random variable V follows the APTA-Weibull distribution, we write
V ~ APTAW (a,b,α ) (Figure 1)

By differentiating the CDF of the APTA-F distribution we have the following

Proposition 2.4. The PDF of the alpha-power transformed distribution of the Ampadu type is given by
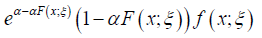
where ,and F (x;ξ ) and f (x;ξ ) are the CDF
and PDF, respectively, of some basline distribution all of whose
parameters are in the vector ξ (Figure 2)
The Quantile
Theorem 3.1. Let QF(.)=F-1 denote the quantile of some
baseline distribution with CDF F and PDF f, and 0 < u <1. The
quantile function of the alpha-power transformed distribution of
the ampadu type is given by
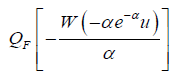
Where W (z) := Pr oductLog (z) gives the principal solution for w in z = wew
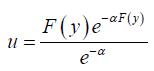
Proof. Let 0 < u <1. Since QF(.)=F-1 the quantile function can be obtained by solving the following equation for y
Approximate Random Number Generation
It is well known that the principal solution for w in z = wew , denoted W (z) := Pr oductLog (z) admit the following Taylor series expansion [7]
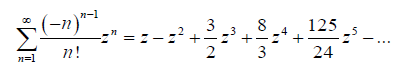
Using the first term of this series to approximate W (z) := Pr oductLog (z) , gives us a way to approximate the random sample from the APTA-F family of distributions.
In particular if u U (0,1) , that is, u is a uniform random variable, then an (approximate) random sample from the APTA-F family of distributions can be obtained via
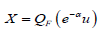
where QF(⋅) = F−1 (⋅)
denote the quantile of some baseline
distribution with CDF F and PDF f,
Parameter Estimation
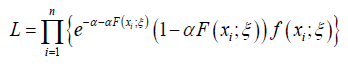
In this section, we obtain the maximum likelihood estimators (MLEs) for the parameters of the APTA-F family of distributions. For this, let 1 2 , ,.... n X X X be a random sample of size n from the APTA-F family of distributions. The likelihood function from Proposition 2.4 is given by
From the above the log-likelihood function is given by

The MLE’s of ξ and can be obtained by maximizing the equation immediately above.
The derivatives of the equation immediately above with respect to the unknown parameters, are given as follows
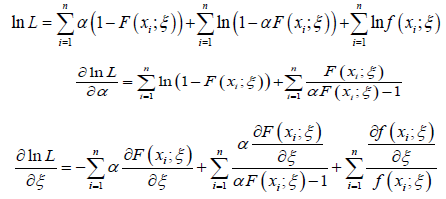
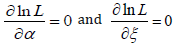
Now solving the system below for _ and _ gives the maximum likelihood estimators, αˆ and ˆξ of the unknown parameters:
Simulation Studies
In this section, a Monte Carlo simulation study is carried out to assess the performance of the estimation method, when the baseline distribution is defined as in Section 2.
Simulation Study One
Approximate samples of sizes 200, 350, 500, and 700, are drawn from the APTA-Weibull distribution. The approximate samples have been drawn for (a,b,α ) = (1.3, 48.4, 0) using
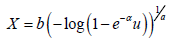
Table 2: Result of Simulation Study.

and the maximum likelihood estimators for the parameters a, b, and α are obtained. The procedure has been repeated 200 times and the mean and mean square error for the estimates are computed, and the results are summarized in Table 2 below.
From Table 2 above, we find that the simulated estimates are close to the true values of the parameters and hence the estimation method is adequate. We have also observed that the estimated mean square errors (MSEs) consistently decrease with increasing sample size as seen in the Figures below.


Simulation study two
Approximate samples of sizes 400, 550, 700, and 900, are drawn from the APTA-Weibull distribution. The approximate samples have been drawn for (a,b,α ) = (1.3, 1.3, 0) using
and the maximum likelihood estimators for the parameters a, b, and _ are obtained. The procedure has been repeated 400 times and the bias and root mean square error for the estimates are computed, and the results are summarized in Table 3 below.
From Table 3 above, we find that the estimated root mean square errors (RMSEs) consistently decrease with increasing sample size as seen in the Figures below. We also find that the bias is consistently around zero, hence estimating the parameters in the distribution via the method of maximum likelihood is adequate.
Table 3: Result of Simulation Study.


Application
In this section, we illustrate the usefulness of the APTA-F family of distributions in modelling real-life data. We compare the fit of the APTA-Weibull distribution, with the proposed Weibull distribution appearing in [5] to the dataset on the survival times (in days) of 72 guinea pigs infected with virulent tubercle bacilli. The dataset can be found in [8]. The estimates of the unknown parameters in both distributions are obtained by the maximum likelihood method using the R language software. The measures of goodness of fit considered included Akaike information criterion (AIC), consistent Akaike information criterion (CAIC), Bayesian information criterion (BIC) and Hannan-Quinn information criterion (HQIC) statistics and they are defined as follows:
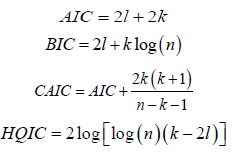
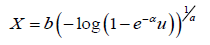
where k is the number of parameters in the statistical model, n is the sample size, and l (⋅) is the maximized value of the log-likelihood function under the considered model. The proposedWeibull distribution appearing in [5], which we denote, Proposed Weibull (a,b,α ) has CDF given by
where 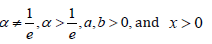
Since the Proposed Weibull (a,b,α ) distribution has the smallest AIC, BIC, CAIC, and HQIC values compared to the other distribution in Table 4, it can be considered a better fit to the survival times (in days) of 72 guinea pigs infected with virulent tubercle bacilli The asymptotic variance-covariance matrix of the MLEs under the APTAW (a,b,α ) , and the Proposed Weibull (a,b,α ) distributions, respectively, are given by
Table 4:Estimated Parameters for the dataset on the survival times (in days) of 72 guinea pigs infected with virulent tubercle bacilli.

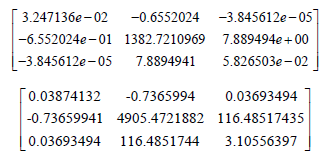
Hence the approximate 95% confidence intervals for the parameters under the APTAW (a,b,α ) and the Proposed Weibull distributions, respectively, are given in Tables 5-7.
Table 5: Criteria for Comparison.

Table 6:APTAW (a, b, α) distribution.

Table 7: Proposed Weibull (a, b, α) distribution.

Concluding Remarks
In this paper a new kind of alpha power transformed family of distributions is introduced, and members of this family are shown to be effective in fitting real life data. As a further development we propose obtaining some mathematical and statistical properties of the APTA-F family of distributions.
Acknowledgement
None.
Conflict of interest
No conflict of interest.
References
- Mahdavi A, Kundu D (2017) A new method for generating distributions with an application to exponential distribution. Communications in Statistics-Theory and Methods 46(13): 6543-6557.
- Ahmad Z (2018) The Zubair-G Family of Distributions: Properties and Applications. Annals of Data Science 5: 1-14
- Clement Boateng Ampadu (2019) The Ampadu-G Family of Distributions with Application to the T-X(W) Class of Distributions. Annal Biostat & Biomed Appli 1(4).
- Clement Boateng Ampadu (2019) The Ampadu APT qT −X Family of Distributions Induced by V with an Illustration to Data in the Health Sciences. Annal Biostat & Biomed Appli 2(1).
- Abdulzeid Yen Anafo (2019) The New Alpha Power Transform: Properties and Ap-plications, Master of Science in Mathematical Sciences Essay, African Institute for Mathematical Sciences (Ghana). Unpublished Manuscript, In Preparation.
- Girish Babu Moolath, Jayakumar K (2017) T-Transmuted X Family of Distributions. Statistica 3.
- Wikipedia contributors (2019) “Lambert W function.” Wikipedia, The Free Encyclopedia. Wikipedia, The Free Encyclopedia.
- T Bjerkedal (1960) Acquisition of resistance in guinea pigs infected with different doses of virulent tubercle bacilli. American Journal of Hygiene 72(1): 130-148.
-

This work is licensed under a Creative Commons Attribution-NonCommercial 4.0 International License.


