


 Research Article
Effects of Missing Values on Buys-Ballot Estimates of Trend Parameters and Seasonal Indices in Descriptive Time Series Analysis
Received Date: December 05, 2025; Published Date: February 13, 2026
Abstract
This study is on the Buys-Ballots procedure for the estimation of trend parameters and seasonal indices in the presence of missing value. The Buys-Ballots procedure was developed on the assumption that there are no missing values. Following this procedure, the statistical properties and estimates of trend parameters and seasonal indices were derived for a series with one missing value for the Linear Additive model. We also through simulation investigated the effect of one missing value on these statistical properties and estimates of trend parameters and seasonal indices by varying one missing value at different positions in the series. The results revealed that the row mean and standard deviation show no noticeable difference in the presence of one missing value. Also, the estimates of trend parameters and seasonal indices have no noticeable effect when one missing value was observed at different positions in the datasets. This result suggests that the estimates of the Buys-Ballot procedure is effective even in the presence of one missing value. However, we recommend that the study be extended to other time series decomposition models, other trending curves and increasing the number of missing values.
Keywords:Buys-ballot estimates; statistical properties; trend parameter; seasonal indices; additive linear model
Introduction
The Buys-Ballot methodology was proposed and by Iwueze and Nwogu (2004) [1] as an alternative procedure to the traditional method of time series decomposition. The method obtains estimates of trend parameters from row, column and overall means and standard deviations.
In descriptive method of time series decomposition, three model are commonly used. They are,
The Additive model,

the Multiplicative model,

and the Mixed Model.

where, for time t , Xt is the observed data,Tt is the trend, St is the seasonal effect, Ct is cyclical and it is irregular or error term. According to Chatfield (2004) [2] the cyclical component is superimposed into the trend when a short period of time is involved. When this happens, the trend-cycle component is given by Mt and Equations (1) through (3) are re-written as

for Additive model

for Multiplicative model

And for Mixed Model.
It is assumed for all the model that the seasonal effect, when it exists, has period s . That is, it repeats after s time periods.

Furthermore, for Equation (4), it is assumed that the sum of the seasonal components over a complete period is zero. That is,

Similarly, for Equations (5) and (6), the assumption is that the sum of the seasonal components over a complete period is s . That is,

It is also assumed that for Equation (4) and (6), the irregular
component et is normal with mean zero and constant variance  , that is

For Equation (5) the irregular component et is normal with
mean one and constant variance  , that is

The traditional method of time series decomposition consists
of estimating the time series components existing in the series and
isolating them using any of the models discussed above, Chatfield
(2004) [2]. Hence, the trend component Mt is estimated from the
observed series and isolated either by subtraction for Equation (4)
or by division for Equation (5). The de-trended series is obtained
as  for Equation (5). From
the detrended series, the estimate of seasonal component is
obtained by taking the averages at each season. The de-trended, deseasonalized
series is obtained as
for Equation (5). From
the detrended series, the estimate of seasonal component is
obtained by taking the averages at each season. The de-trended, deseasonalized
series is obtained as 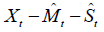 for Equation (4) or
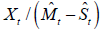 for Equation (5). This gives the irregular component
which may or may not be random. For the mixed model in Equation
(6), neither the successive subtraction nor division could be used
for decomposition.
for Equation (5). This gives the irregular component
which may or may not be random. For the mixed model in Equation
(6), neither the successive subtraction nor division could be used
for decomposition.
Thus, the traditional method relies on the de-trended series to obtain estimates of other components. It makes no provision for outliers and missing values. It is faced with the problem of choice of appropriate model for the decomposition of observed series, problem of choice of appropriate transformation and problem of determining the nature of the trending curve and seasonality etc. The Buys-Ballot procedure proposed by Iwueze and Nwogu (2004) [1] provides an alternative procedure to the traditional method of time series decomposition. Unlike the traditional method, the procedure does not rely on the de-trended series to obtain other components. It obtains estimates of trend and seasonal components independently from the rows and columns and overall averages and standard deviation. The procedure has addressed the problems of choice of appropriate model for decomposition, choice of appropriate transformation, determining appropriate trend and test of seasonality among other things.
However, in developing the Buys-Ballot procedure, Iwueze and Nwogu (2004) [1] assumed that all the observations in each row and each column are present. Therefore, the procedure is based on complete number of observations in rows and columns in deriving the estimates of trend parameters and seasonal indices. In other words, Iwueze and Nwogu (2004) [1] procedure did not make any provision for series in which some observations are missing. Hence, the effects of this unequal number of observations per row and column on the estimates of trend parameters and seasonal indices are not quite clear and needs further investigation. Should the estimation continue as proposed by Iwueze and Nwogu (2004) [1] with the missing observations since the estimates are based on averages or should the missing values be estimated before applying the procedure? This and other related questions are what this study intends to address.
Materials and Methods
Review of Buys-Ballot Method
The method adopted in this study is the Buys-Ballot method by Iwueze and Nwogu (2004) [1]. For details of the Buys-Ballot procedure, see Iwueze and Nwogu (2004, 2005) [1,3], Iwueze and Ohakwe (2004) [4]. According to Buys-Ballot method a seasonal time series data (X t ,t = 1, 2,..., n ) can be conventionally arranged into m rows and s columns (such that n = ms ). In terms of the rows (i) and columns ( j) , the time point t corresponds to t = (i −1) s + j . Hence, in terms of the Buys-Ballot procedure, the expressions in Equations (4) through (6) are

for Additive model

for Multiplicative model

and for Mixed Model
For a linear trend-cycle component

a ≠ 0,b ≠ 0 all constants.
Using these expression, Iwueze and Nwogu (2004) [1] obtained the row, column and overall means and variances shown in Table 1 for the Additive and Multiplicative models when the trend-cycle is linear. As Table 1 show, the row mean is a function of the row i and the trend parameter only while the column mean is a function of both trend parameter and seasonal effect Sj . Hence, estimates of trend parameter are derived from the row mean while estimates of seasonal indices are derived from the column mean. Using the expressions in Table 1, the estimates of trend parameters and seasonal indices for series with complete observation are given in Table 2 [5].
Table 1: Row, column and overall averages and variances of the Buys-Ballot table for a series with complete observation and for the Additive Model. The details of the measures in Table 1 are shown in Iwueze and Nwogu (2014) [5].

Table 2: Estimates of trend parameters and seasonal indices for series with complete observation Source: Iwueze and Nwogu (2014) [5]. α ' and b' are estimates derived from the regression equation of row averages on row number.

Modified Buys-Ballot Procedure When One Observation is Missing in (i, j) Cell
Table 3: Modified Buys-Ballot Table for series with one missing value.

However, when one observation is missing from i =( i')th row and j =( j')th column, the Buys-Ballot table may be modified to account for the missing observation. The modified Buys-Ballot table is shown in Table 3.
For Table 1 with a missing value at the (i ', j ') cell,

while the expression in Equation (12) with linear trend is written as

In the modified table (Table 3), the corresponding row, column, and overall totals, averages and variances are expressed as follow;


Utilizing the method of Iwueze and Nwogu (2004) [1], the following row, column and overall totals averages and variances of the modified Buys-Ballot table are shown in Table 4 for a series with one missing value. From Table 4, it is observed that the row means are linear function of the row i ' . while column means are linear function of the column j ' plus the seasonal effect Sj. The row means and the column mean in Table 4 contain the position of the missing value (i '−1) with the presence of seasonal effect j ' . Furthermore, while the row variance includes both the trending parameters and the seasonal component, the column variance does not contain the seasonal component but mimic the shape of the trending series. These qualities of the row and column averages are utilized to obtain estimates of trend parameters and seasonal indices.
Parameter Estimation
Using the expressions in Table 4, the estimates of trend parameters and seasonal indices for series with one missing value is given in Table 5.
Table 4: Row, column and overall totals averages and variances of the modified Buys-Ballot table for a series with one missing observation and for Additive model.

Table 5: Estimates of trend parameters and seasonal indices for series with one missing value a ' and b' are estimates derived from the regression equation of row averages on row number.

From Table 5, the value of a ' and b ' are estimates derived from
the regression equation for a series with one missing. Furthermore,
the estimate of the intercept a contain the seasonal j ' . In other
words, the intercept a change at the rate of  per unit
change in j ' and the term j ' marks the position of the missing
values. This suggest that the position of the missing value affects
the both the slope and the intercept. On the other hand, the seasonal
effect is a function of i ' and j ' . In other words, the seasonal effect
is also affected by the position of the missing value both in row i '
and column j ' . Hence, the seasonal effect changes at rate
per unit
change in j ' and the term j ' marks the position of the missing
values. This suggest that the position of the missing value affects
the both the slope and the intercept. On the other hand, the seasonal
effect is a function of i ' and j ' . In other words, the seasonal effect
is also affected by the position of the missing value both in row i '
and column j ' . Hence, the seasonal effect changes at rate  per unit change in i ' and rate
  per unit change in j ' . The term
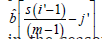 marks the effect of the position of the missing value
in the seasonal j ' and period i ' . Generally, the seasonal effect
reduces as j ' increases and increases as i ' increases.
marks the effect of the position of the missing value
in the seasonal j ' and period i ' . Generally, the seasonal effect
reduces as j ' increases and increases as i ' increases.
Comparison of Estimates
The comparison of Buys-Ballot estimates of the parameters
in the presence and absence of missing values for the linear trend
curve and additive model is assessed using the accuracy measures.
The accuracy measures (Mean Absolute Error MAE, Mean Square
Error MSE and Mean Absolute Percentage Error MAPE), are based
on deviations  of the parameter estimates in the absence
  from the presence
  of one missing value.
That is,

where,

Hence,


k is the number of parameters.
Empirical Example and Results
Data Source
The data used consist of 20 simulations of 120 observations each from the Additive model;
 w i t h
 and the Sj given
in Table 6. The results of the analysis were consistent for all the
simulated series. The effect of one missing value on the Buys-Ballot
table and the effect on the estimates of trend parameters and
seasonal indices using the Buys-Ballot procedure were assessed
in this study. The effects were determined by varying one missing
value at different position in the series.
and the Sj given
in Table 6. The results of the analysis were consistent for all the
simulated series. The effect of one missing value on the Buys-Ballot
table and the effect on the estimates of trend parameters and
seasonal indices using the Buys-Ballot procedure were assessed
in this study. The effects were determined by varying one missing
value at different position in the series.
The summary statistics from the row mean and standard deviation when one missing value was varied at different position is shown in Table 7 and 8. Table 8 presents the assessment of the effect one missing on the estimate of trend parameters and seasonal indices in absence of no missing value and in the presence of one missing value. Specially, when the missing value is varied at different positions. Table 8 show that trend parameters were recovered very well while the seasonal indices were recovered with greater error. This indicates that recovery is better with trend parameters than seasonal indices. Furthermore, it was observed that the recovery of seasonal indices appears to be better with positive seasonal indices than negative seasonal indices.
Table 6: The seasonal indices for the simulated series.

Table 7: Effect of one missing value on the Row Mean and standard deviation of the Buys-Ballot Table.

Table 8: Effect of one missing value on the estimates of trend parameter and seasonal indices.

Discussion
Previous studies have shown that when an analyst encounters missing observations in time series data, the remedial measure is to replace the missing observation by its estimate; David (2006) [6]. This measure is applied without determining if the missing values have effect on the series or not. Iwueze et al., (2018) [7] proposed different measure handling missing values using the Buys-Ballot procedure. However, the study did not show if missing values – number of missingness and position of the missing values have any adverse effect on the Buys-Ballot technique. From the foregoing, it becomes necessary to investigate the effect of missing values on the statistical properties of the Buys-Ballot table and parameter estimates. The aim of this study is therefore to determine if one missing value has effect on the Buys-Ballot estimates of trend parameters and seasonal indices by varying one missing value at different position in the series using the Additive Linear Model. The result of the analysis revealed that the row mean and standard deviation show no noticeable difference in the presence of one missing value. Also, the estimates of trend parameters and seasonal indices have no noticeable effect when one missing value was observed at different positions in the datasets. This result is in line with Kiwu et al. (2025) [8].
Conclusion
This study has assessed the effects of missing values on Buys- Ballot estimates of trend parameters and seasonal indices in descriptive time series analysis especially when the missing value is varied at different positions in the series. The results revealed that there is no noticeable effect of one missing value on the estimates of trend parameters and seasonal indices. This result suggests that the estimates of the Buys-Ballot procedure is effective even in the presence of on missing value. Base on this result, obtaining the estimate of one missing value before using the Buys-Ballot procedure is not necessary. Therefore, it is recommended that the study be extended to other time series decomposition models, other trending curves and increasing the number of missing values.
Funding
This study received no financial support
Competing interest
The authors declare that they have no known competing interests. this work.
References
- Iwueze IS, Nwogu EC (2004) Buys-Ballot estimates for time series Global Journal of Mathematical Sciences 3(2): 83-89.
- Chatfield C (2004) The Analysis of Time Series: An Introduction. Chapman and Hall/CRC Press, Boca Raton.
- Iwueze IS, Nwogu EC (2005) Buys-Ballot for exponential and s-shaped curves, for time series. Journal of Nigerian Association of Mathematical Physics 9: 357-366.
- Iwueze IS, Ohakwe J (2004) Buys-Ballot estimates when stochastic trend is Journal of Nigerian Association of Mathematical Physics 8(1): 311-318.
- Iwueze IS, Nwogu EC (2014) Framework for choice of models and detection of seasonal effect in time series. Far East Journal of Theoretical Statistics 48(1): 45-66.
- David SF (2006) Methods for the Estimation of Missing Values in Time Cowan University Press, Western Australia.
- Iwueze IS, Nwogu EC, Nlebedim VU, Nwosu UI, Chinyem UE (2018) Comparison of Methods of Estimating Missing Values in Time Series. Open Journal of Statistics 8(2): 390-399.
- Kiwu LC, Nwogu EC, Ogbonna CJ, Iwu HC, Iwueze IS (2025) On the Effects of Missing Values on Estimates of Trend Parameters and Seasonal Indices in Descriptive Time Series Archives of Current Research International 25(4): 120-131.
-

This work is licensed under a Creative Commons Attribution-NonCommercial 4.0 International License.