


 Research Article
Discovering Disrupted Connectivities in Neuroimaging Studies: A Meta Analytic Approach
Received Date: February 12, 2020; Published Date: February 25, 2020
Abstract
Aberrant activities in the complex human brain network can lead to various neurological disorders such as multiple sclerosis, Parkinson’s disease, Alzheimer’s disease and Autism Spectrum Disorder (ASD). Functional Magnetic Resonance Imaging (fMRI) has emerged as an important tool to delineate the neural networks affected by such diseases, particularly ASD. In seeking for earlier diagnosis, we aimed to find biomarkers through the analysis of resting state fMRI images. In this article, we present a holistic approach to detect disrupted connectivities in whole brain studies. Our meta analytic approach addresses multidimensional heterogeneities in the context of multiple ROIs borrowing strength from all sites. Results are illustrated with a large data set known as Autism Brain Imaging Data Exchange (ABIDE), which includes 361 subjects from eight medical centers. Our results are consistent with previous studies in Autism research. These interrupted regions are involved in language processing, social cognition, auditory effect on social communication which are associated with ASD. We believe that our findings have addressed the variations due to different hierarchies and thus lead to more reliable identification of therapeutic targets for intervention. Our disciplined study can be used for early detection of subjects who are at a higher risk of developing neurological disorders.
Keywords: Functional magnetic resonance imaging; Meta-analysis; Mixed-effects; False discovery rate; Hierarchical designs.
Abbreviations: ABIDE: Autism Brain Imaging Data Exchange; fMRI: Functional Magnetic Resonance Imaging; ASD: Autism Spectrum Disorder; TBI: Traumatic Brain Injury; ROI: Region of Interest; FDR: False Discovery Rate; INDI: International Neuroimaging Data-Sharing Initiative
Introduction
The area of neurological disease research requires adequate statistical inferential methods appropriate for addressing unique aspects of neuroimaging data. In neural connectivity research, we detect disrupted connectivities for targeting treatment interventions for therapeutic benefit. A detailed understanding of how brains with neurological conditions (e.g. autism, depression, traumatic brain injury (TBI) etc.) differ from healthy brains is fundamental to the development of treatments for these conditions. Disrupted network connectivity between distant brain regions has been reported among individuals with ASD [1-5]. These reports showed both increased and decreased connectivities in brain regions including default mode network, social brain regions, attentional regions, visual search regions and corticostriatal connections. However, knowing the specificity of diagnosis criteria (American Psychiatric Association 2013), there is hope that some (possibly complex) patterns of brain features may be unique to the disorder and it is worth to continue the research.
The primary goal of psychiatric neuroimaging research is to identify objective biomarkers that may inform the diagnosis and treatment of brain-based disorders. Data-intensive machine learning methods are a promising tool for investigating the replicability of patterns of brain function across larger, more heterogeneous data sets Varoquaux and Thirion, (2014). Several studies have shown that data-intensive machine learning methods are a promising tool for identification of objective biomarkers. They have used a brain imaging data from a worldwide multi-site database known as ABIDE (Autism Brain Imaging Data Exchange), where data gathered across different scanners, with different field strengths and different acquisition schemes [5-7]. These studies revealed that acquisition site has significant effects on image properties. To alleviate the problem of between site variation, several studies [3,6,8,9] applied domain adaptation machine learning algorithms to classify ASDs from HCs using cross-site evaluation strategy.
In this article, we propose a meta analytic approach utilizing mixed-effects model to detect disrupted connectivities by controlling the false discovery rate (FDR) for better confidence in a group comparison study at the region of interest (ROI) level using data from multiple independent studies.
Functional connectivity of ROIs is generally measured by the Pearson correlation coefficient, and a disrupted connectivity is detected by a t-test in a group comparison study while comparing a link (connection between two ROIs) of a neurological condition group with the corresponding link of a healthy control group. However, when a large number of ROIs is involved in such studies, the problem becomes challenging as ROIs nested within the same brain are expected to be correlated, and an adjustment of the type I error rate becomes necessary in order to control the false discoveries. In our previous research, mixed-effects models have been used to address within-subject and between-group heterogeneities [10]. These models had three important features. First, it addressed the within-subject correlations resulting from subject-specific links nested within the same brain. Second, unlike previous mixed-effects approaches as described in [11-14], we did not assume equal variance among the autism and control groups and across links. Our assumption of unequal variances addressed both within-subject and between-group variability in the model. Third, our model compared two groups not at the global level, but at the local level. This is important for the goals of these types of studies, as the neurological condition group can vary from the control group at the link level. Our approach utilized a random subject effect to account for the correlation of multiple regions of interest within each subject, and allows each link to have a unique estimate of mean and variance for each group separately. Furthermore, the fixed effects parameters enabled us to detect disrupted connectivities at the link level for correlated measures with heterogeneities across groups. Our pragmatic approach was realistic, as it addressed the complexity of hierarchy while maintaining flexibility compared to other mixed-effects models used in the literature.
We generalize the concept of meta-analysis from a single effect size to multiple effect sizes. Generally, in meta-analysis, summary statistics from independent studies are combined to estimate the effect size [15]. In the presence of heterogeneity, model-based approaches of meta-analysis have been discussed [16-18]. In this article, estimated link specific parameters of the aforementioned mixed-effects model are used to estimate effect sizes. These effect sizes obtained from each study are then combined for every link to get the link specific effect size that measures the difference of connectivity of two groups at the link level. Thus, our meta-analysis approach estimates link specific combined connectivity, borrowing strength from all studies and addressing multidimensional heterogeneities in the context of multiple ROIs. In addition, the concept of FDR was developed with the goal of avoiding too many false positives while attaining more power to detect true positives [19] in multiple comparisons. In order to implement the FDR method, a q-value (FDR level) is required which represents the minimum FDR at which the test can be called significant. The novelty of this article is the determination of the FDR level by a rigorous exploration of p-values in order to estimate the proportion of true null hypotheses, and also to find the most suitable q-value cutoff necessary to get the optimal result.
Finally, to evaluate the proposed meta-analytic approach, we compared our results with some regularized regression models (LASSO, Elastic Net), and an embedded learning regression method (Random Forest) with a 10-fold cross validation scheme. Feature selection approaches select the most important disrupted links without going through hypothesis testing. Comparing results between the modeling approach and feature selection approaches, we are now able to examine the agreement between these two different sets of procedures. Based on the discoveries we made, we are able to determine some hubs of disruptions and their locations in known networks for interventions.
We organize the article as follows. In Section 2, we introduced methods and dataset used in this article. In Section 3, we generalize the meta-analysis concept using the parameters estimated by the mixed-effects model, discuss related hypotheses, and outline multiple testing procedures to control false discoveries. We further discuss briefly LASSO, Elastic Net and Random Forest. In this section, we also provide a rationale for the use of FDR instead of controlling type 1 error rate. In Section 4, we provide results from a study related to ASD (Autism Spectrum Disorders). We then discuss how these networks help us in correlating neurobehavioral symptoms in autistic subjects. Furthermore, we compare our model based results with Bayesian hierarchical method, feature selection approaches, and graph theory methodology. This section also examines the links found to be significant, identifies hubs of disruptions, and develops networks based on these hubs. We conclude the paper with some discussion in Section. [Table 1]
Table 1: Number of Subjects at Each Site.

Methods and Materials
Dataset
For illustration, we study resting state fMRI data obtained from seven sites in Autism Brain Imaging Data Exchange (ABIDE) repository [20]. Data were collected from ABIDE site, which is a part of the 1000 Functional Connectome Project/International Neuroimaging Data-sharing Initiative (INDI) (http://fcon1000. projects.nitrc.org). The Autism Brain Imaging Data Exchange (ABIDE) is an open-access multi-site image repository consisting of structural and rs-fMRI scans from ASD and TD individuals [20]. For our work, we use fMRI measurements from 8 medical centers (sites). Acquisition parameters, protocol information can be obtained at ABIDE site http://fcon-1000.projects.nitrc.org/in di/ abide/. We use preprocessed data using Connectome Computation System (CCS) pipeline as described at ABIDE sites. The number of subjects at each site is summarized in Table 1. All the sites except for NYU have fewer than 60 subjects. In total, we use 361 subjects, consisting of 189 healthy controls and 172 autistic subjects. Connectivity maps are obtained utilizing CONN toolbox (http:// www.nitrc.org/projects/conn). Using 42 bilateral Brodmanns [10] regions of interest (ROI), bivariate correlations are calculated between each pair of ROIs. The rs-fMRI network is captured by an 84×84 symmetric matrix of nodes. We extract the upper triangle elements of the functional connectivity matrix as classification features, i.e. the feature space for classification was spanned by the (84×83)/2=3486-dimensional feature vectors. A list of all Brodmanns regions with their assigned numbers is given in [10].
Mixed-effects model
The mixed-effects model that we would like to develop should (i) have discriminating power for detecting disrupted connectivity at the link level while comparing two groups, (ii) be flexible enough to incorporate heterogeneities over links as well as across groups, and (iii) address correlations of multiple measures nested within subjects. We try to fulfill the normality assumption of random components by Fisher z transformation of the Pearson correlation measured for the connectivity of two regions. It is described in our paper [10].
Meta-analysis
In this section, we introduce the concept of meta-analysis in detecting disrupted connectivities. The fundamental difference between traditional meta-analysis and what we propose is that the former is based on a summary statistic, whereas our approach first uses a mixed-effects model and subsequently performs metaanalysis using parameter estimates from the model. An additional challenge that we encounter is from testing one hypothesis to multiple hypotheses while implementing meta-analysis.
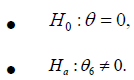
The main reason that different studies lead to different conclusions is that these studies are often performed at a single center with a relatively small sample. Results from a single-center study suffer from both type I and type II errors. As the number of regions under study is large (in our case, 3864 different links), the chance of making a type I error cannot be ignored and must be controlled. An analysis that combines data from multiple studies should reduce the number of false positives under the assumption that false positives occur randomly across different regions. Pooling data from various studies can increase the reliability of findings and power of statistical analysis. This brings in the notion of metaanalysis. Meta-analysis has been shown to be superior to singlesite analysis as it reduces both the number of false positive and false negative results [4]. However, previous meta-analyses have not explicitly addressed the difference between sites (studies) or between site heterogeneity. In neuroimaging studies, the difference between sites can be caused by variations in scanner strength [21], study population [22] and analysis methods [23]. Inter-study variation can be a significant source of variation in neuroimaging studies [24, 21]. Many studies have shown that meta-analysis is a technique that makes efficient use of multi-site neuroimaging data [25]. In terms of the statistical testing framework, the hypothesis test for the effect size, denoted by θ, determined by the difference in mean between experimental and control group can be tested by
One of the central assumptions of meta-analysis is that the true
effect size is the same for every study included in the analysis. The observed effect sizes 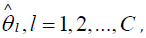 differ from study to study
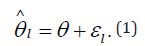
because of random error l in each study. The observed effect size is
expressed as a function of the true effect size and random error as
differ from study to study
because of random error l in each study. The observed effect size is
expressed as a function of the true effect size and random error as
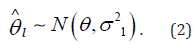
The goal of meta-analysis in this context is to estimate the true effect size Ɵ from the estimated effect sizes l θ ∧ . This is accomplished by first estimating the variance 2 1 σ of each study and then metaanalyze l θ ∧ across studies. l θ ∧ is assumed to have the following distribution:
The overall effect size can be estimated by calculating the
simple mean of the l θ ∧
if all studies in the analysis were equally
precise. In many cases, however, some studies are more precise
(due to larger sample size) than others. Thus, varying weights are
assigned to these studies in the estimation of the true effect size.
In order to obtain an accurate estimate of the overall effect size Ɵ
and to perform statistical testing on θ, we calculate the weighted average of 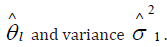
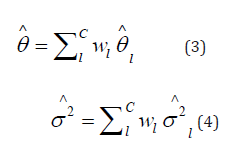
where wl is the weight of study l. We assign  where.
  This approach is referred to as the inverse variance
approach. Research has proved that the approach using inverse
variance weighting is the optimal weight for meta-analysis (Hedges,
1981).
This approach is referred to as the inverse variance
approach. Research has proved that the approach using inverse
variance weighting is the optimal weight for meta-analysis (Hedges,
1981).
To implement the meta-analysis concept, we run the
aforementioned mixed-effects model separately for each study.
Mixed-effects analysis by study yields study specific estimates of
effect size and variance. These two estimates are used for the metaanalysis.
Let  denote the estimate of i β
from the lth study for ith
link from kth group. Similarly, denote the variance of by ikl Vβ , and
the variance-covariance matrix of
denote the estimate of i β
from the lth study for ith
link from kth group. Similarly, denote the variance of by ikl Vβ , and
the variance-covariance matrix of 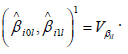
Denote the effect size for the ith link in the lth study by il D , where
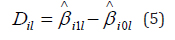
The variance of 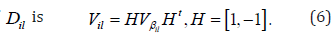
Hence, the weight for the ith link from the lth site is . The
overall effect size for the ith link, denoted by i θ
, is estimated by
The
overall effect size for the ith link, denoted by i θ
, is estimated by
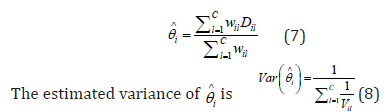
The null hypothesis of i θ = 0 can be tested using a z-test. The resulting p-values are subject to FDR adjustment.
False discovery rate
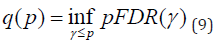
As we see multiple hypotheses are involved in the searching process of disrupted connectivities in neuroimaging studies. The FDR is defined as “the expected proportion of false positive findings among all those rejected hypotheses” [26]. It has been shown that when the number of tests is large and the proportion of alternative hypotheses is high, methods that control FDR rather than the family wise error rate (FWER) resulted in higher power [27]. One of the real challenges in the FDR approach is in assigning a value to the minimum positive FDR (pFDR) at which the test can be called significant. The pFDR is defined as pFDR = E [F/S|S > 0], where F is the number of false positives and S is the total number of positives [28]. This is known as the q-value in the literature, and it has a close relationship to the p-value. For a set of tests conducted with independent p-values, the q-value of an observed p-value p is
p-value is a measure of false positive rate (FPR), whereas q-value is a measure in terms of FDR. In this article, after employing mixed-effects analysis via an E-M algorithm, the q-value package [31] was used.
Feature selection methods
We employ three feature selection algorithms: LASSO, Elastic Net, and Random Forest
LASSO and elastic net: The LASSO regression [30], similar
to the Ordinary Least Squares (OLS) regression minimizes the
Residual Sum of Squares (RSS) under a condition that the sum of
the absolute values of the coefficients is less than a constant. This
simple modification allows LASSO to select important covariates
(also known as features), as the inbuilt shrinkage procedure
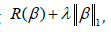
makes some coefficients to be shrunken exactly to zero. The LASSO computes model coefficients by minimizing
 where R(β ) is the mean square error on the training dataset and
 controls the degree of sparsity of the solution, i.e.
the number of feature selections
controls the degree of sparsity of the solution, i.e.
the number of feature selections
The idea of Elastic Net [24] is very similar to LASSO. In Elastic Net, the l1 norm of β is replaced by a combination of l1 and l2 norms. In this case, we minimize R(β ) +λ P ∝ (β ) , where
for α strictly between 0 and 1, and a nonnegative λ . The λ parameter can be tuned in order to set the shrinkage level, and for larger values of λ , more coefficients are shrunk to 0. The Elastic Net penalty does automatic variable selection and continuous shrinkage simultaneously, and it can select from a group of correlated variables. This is in contrast to the LASSO, which tends to select only one variable from a group of variables with high pairwise correlations. It is especially useful for large p small n problems where the grouped variables situation is an important concern [24]. Implementation of these approaches are described in Section 4.3.
Random forest: Random forest, developed by Brieman [31], is an expansion of classification and regression trees. The motivation to random forest is bagging, a method of reducing variance by averaging many “noisy but approximately unbiased models” [31]. Random forest is a classifier consisting of a collection of K tree-structured classifiers {T(x,Θk),k = 1,2,...K}, where the Θk are independent and identically distributed random vectors that provide the terms of split variables, node cut points, and terminal node values for the kth tree. For each tree, n observations with replacement from the training data are sampled. At each node, m out of p features, where m << p, are selected at random as candidates for the variable to be split [31].
Since each tree uses a bootstrapped sample for model building, the observations that are not used in the tree are a natural sample for testing the accuracy of the model. Although Random Forest utilizes all input features in building the trees, a measure of variable importance can be derived to identify important predictors. Each variable is permuted, and a tree is built, and a measure of fit for the forest with permutation is compared to the original forest [31]. However, in the high-dimensional case with positively correlated variables, this measure of variable importance may be misleading. In this case, when one of the variables is permuted, the difference in measure of variable importance for the permuted forest and original forest will not be large due to the presence of correlated variables [32].
Results
For an illustration of the aforementioned methodologies, we used the data described in Section 2.
Determination of q-values
A histogram of p-values from mixed-effects models used in meta-analysis is provided in Figure 1. Under the null hypothesis, p-values follow a Uniform (0,1) distribution. In Figure 1, the p-values are relatively flat at the right tail of the histogram, indicating the validity of the assumption. Plots in Figure 2 direct us in determination of the q-value cutoff. [Figure 2(a)] shows the relationship between λ and π 0 (λ ) ∧ , the estimated proportion of truly null hypotheses (24). Inspecting [Figure 2(a)], we see that at λ = 1, 0 (1) π ∧ = 0.919. This estimate is then used in equations 23 and 24 to calculate the q-value for each corresponding p-value. The relationship between p-values and q-values is shown in Figure 2(b), and through this plot we can identify the corresponding p-value for our specified level (q-value) of FDR. For example, for a p-value cutoff of 0.002, the corresponding q-value is around 0.18. In [Figure 2(c)], we can see the number of significant links for each q-value. Thus, for a q-value cutoff of 0.275, the number of significant tests is 48. [Figure 2(d)] shows the relationship between the number of significant tests and expected false positive. Inspecting [Figure 2(c)], we observe that there is a hugely notable jump in significant tests at q = 0.275. Thus, we take a q-value cutoff of 0.275, which leads to 48 significant tests. Based on [Figure 2(d)], we find that out of 48 significant tests, approximately 13 are expected to be false positives. For mixed-effects analysis only and hierarchical Bayesian analysis, a similar approach to that described for meta-analysis in determining the FDR level yielded a q-value equal to q = 0.3. [Figure 1], [Figure 2] and [Table 2]
Table 2: Significant Links by Meta-Analysis.


Meta-analysis results with interpretation
Using our meta-analysis approach, 48 links were identified as significant at FDR=0.275. Significant disrupted links are given in Table 2. These links identified by this study may be used to guide the development of autism therapeutic interventions and to classify and predict patients into higher risk groups. Figure 3 is a graphical representation of all the links that are identified as significantly different between autism and control by metaanalysis. Furthermore, Figure 4 is a brain network of the links identified. The regions with more than 5 or more significant links are highlighted in red. Regions 7 (BA.13 L. Insular Cortex), 8 (BA.13 R. Insular Cortex), 61 (BA.41 L. Primary Auditory Cortex), 62 (BA.41 R. Primary Auditory Cortex) and 63 (BA.42 L. Primary Auditory Cortex) are identified as a hub region as each of them has 5 or more links that are deemed to be significantly different between autism and control. These hubs are concentrated within the Insular Cortex and the Primary Auditory Cortex. The Insular Cortex is known to be an integration center for motor function, and an interruption between the Insular Cortex and Primary Motor Cortex may result in reducing motor control [33]. Additional disruptions existed between the Insular Cortex and the Primary Auditory Cortex, Inferior Prefrontal Gyrus, Middle Temporal Gyrus, and Subcentral Area. Imaging studies have shown that the Insular Cortex processes vocal communication signals from the Primary Auditory Cortex [34]. While the Inferior Prefrontal Gyrus is known to process language syntax, the Middle Temporal Gyrus has been associated with facial recognition and assessment of word meaning. Furthermore, the Subcentral Area affects language processing and social cognition. Disruptions within the Insular Cortex suggest a difference in the ability to accurately comprehend and respond to communications with others between those with autism and control. Effects of auditory ability on social communication and language comprehension may also be a result of several disruptions within the Auditory Cortex, between the Auditory Cortex and Subcentral Area, and between the Left Primary Auditory Cortex and Dorsolateral Prefrontal Cortex. A disruption between the Auditory Cortex and Subcentral Area may reduce auditory response [35], while issues with the Prefrontal Cortex disrupt auditory detection and discrimination [36]. [Figure 3, 4], [Table 3]
Table 3: Links Identified as Significant Across Different Methodologies.


Result of comparison methodologies]
Disrupted connectivities: In addition to using our metaanalysis approach, we analyze the data with three feature selection algorithms for comparison. In Elastic Net, we varied the parameter alpha from .1 to .9 and selected the best parameter based on minimum squared error. For Lasso, we fixed alpha to 1.0. In both cases parameter lambda was tuned with a 10-fold CV. In Random Forest, a measure of variable importance is utilized to identify variables that are crucial in the predictive capability of the forest. The mean decrease in Gini is used as the measure of variable importance. [Table 3] contains all links identified as significant via our comparison methodologies.
Key hubs: Table 4 contains significant hubs identified via two methods: meta-analysis of disrupted links and graph theory. Using meta-analysis, we identify regions with 5 or more significant links in red and 4 significant links in green as notable hubs. The network hub plot of these results is shown in [Figure 4]. Using graph theory, we examine the betweenness centrality of individual nodes to understand how underlying hub architecture may relate to altered community structure. In both groups, nodes where the betweenness centrality is greater than 2 standard deviations from the average betweenness centrality of the network are considered hubs. Furthermore, hubs with a corrected FDR p-values less than 0.05 are considered significant. Three disrupted hubs are identified in the autism group compared to the control group using metaanalysis and graph theory: 8 (BA.13 R. Insular Cortex), 62 (BA.41 R. Primary Auditory Cortex), and 65 (BA.43 L. Subcentral Cortex). Furthermore, although the side of the brain differs, the Cingulate Cortex is identified as a disrupted hub via both methodologies. This agreement between these two methods helps us detect key hubs in understanding differences in autism patients compared [37-41]. [Table 4]

Table 4: Identified Hubs.
Conclusion
This article uses a holistic approach to detect significant disrupted connectivities and their hub(s). The mixed-effects only model pooled subjects from eight sites and selected features ignoring site variations. Meta-analysis does not suffer from site variations but rather uses the inverse of link-specific site variances as weights. As a result, meta-analysis selects the maximum number of features and yields the highest prediction accuracy. The overall accuracy of all methods needs to be improved. Authors of this article are exploring various spatiotemporal models in the Bayesian setting to improve modeling of voxel activations for resting fMRI data with high resolutions. Developing a spatial Bayesian model, or an adjacency matrix for the whole brain study, is a real challenge. Several approaches are being implemented to see the impact on accuracy. The hub(s) with the highest accuracy will be recommended for use in therapeutic intervention.
Acknowledgement
We would like to thank the participating universities of the Autism Brain Imaging Data Exchange (ABIDE), whose generosity in sharing their data made this work possible.
We would like to thank Dr. Dulal Bhaumik and Bikas Sinha for their suggestions to prepare this manuscript.
Conflict of Interest
No conflict of interest.
References
- JL Wiggins, SJ Peltier, S Ashinoff, SJ Weng, M Carrasco, et al. (2011) Using a self-organizing map algorithm to detect age-related changes in functional connectivity during rest in autism spectrum disorders. Brain Res 1380: 187-197.
- JS Anderson, TJ Druzgal, A Froehlich, MB Dubray, N Lange, et al. (2012) Decreased interhemispheric functional connectivity in autism. Cereb Cortex 21(5): 1134-1146.
- J Jiang (2008) A literature survey on domain adaptation of statistical classifiers. In: B Keehn, P Shih, L A Brenner, J Townsend, R A Muller (Eds.) Technical report, Computer Science, Department at University of Illinois at Urbana-Champaign, USA.
- Lawrence D Cohn, Betsy J Becker (2003) How meta-analysis increases statistical power. Psychological Methods 8(3): 243-253.
- JA Nielsen, BA Zielinski, PT Fletcher, AL Alexander, N Lange, et al. (2013) Multisite functional connectivity mri classification of autism: Abide results. Front Hum Neurosci 7: 599.
- CP Chen, CL Keown, A Jahedi, A Nair, ME Pflieger, et al. (2015) Diagnostic classification of intrinsic functional connectivity highlights somatosensory, default mode, and visual regions in autism. Neuroimage Clin 8: 238-245.
- M Plitt, KA Barnes, A Martin (2014) Functional connectivity classification of autismidentifies highly predictive brain features but falls short of biomarker standards. Neuroimage Clin 7: 359-366.
- SJ Pan, Q Yang (2010) A survey on transfer learning. IEEE Transactions on Knowledge and Data Engineering 22(10): 1345-1359.
- R Bhaumik, A Pradhan, S Das, DK Bhaumik (2018) Predicting autism spectrum disorder using domain-adaptive cross-site evaluation. Neuroinformatics 16(2): 197-205.
- DK Bhaumik, F Jie, R Nordgren, R Bhaumik, B.K. Sinha (2018) A mixed-effects model for detecting disrupted connectivities in heterogeneous data. IEEE Trans Med Imaging 37(11): 2381-2389.
- G Chen, ZS Saad, JC Britton, DS Pine, RW Cox (2013) Linear mixed-effects modeling approach to fmri group analysis. Neuroimage 73: 176-190.
- Mark W Woolrich, Timothy EJ Behrens, Christian F Beckmann, Mark Jenkinson, Stephen M Smith (2004) Multilevel linear modeling for fmri group analysis using bayesian inference. Neuroimage 21(4): 1732-1747.
- KJ Firston, KE Stephan, TE Lund, A Marcom, S Kiebel (2005) Mixed-effects and fmri studies. Neuroimage 24(1): 244-252.
- Chen G, NE Adleman, ZS Saad, E Leibenluft, RW Cox (2014) Applications of multivariatemoeling to neu- roimaging group analysis: A comprehensive alternative to univariate general linear model. Neuroimage 99: 571-588.
- GV Glass (1976) Primary, secondary and meta-analysis. Educational researcher 5: 3-8.
- R Der Simonian, N Laird (1986) Meta-analysis in clinical trials. Control Clin Trials 7(3): 177–188.
- K Bhaumik, A Amatya, SL Normand, J Greenhouse, E Kaizar, et al. (2012) Gibbons.Meta-analysis of rare binary adverse event data. Journal of American Statistical Association 107(498): 555-567.
- A Amatya, DK Bhaumik, SL Normand, J Greenhouse, E Kaizar, et al. (2015) Likelihood-based random-effect meta-analysis of binary events. J Biopharm Stat 25(5): 984-1004.
- JD Storey (2002) A direct approach to false discovery rates. J R Statisit. Soc B 64: 479.
- A Di Martino, CG Yan, Q Li, E Denio, F X Castellanos, et al. (2014) The autism brain imaging data exchange: towards a large-scale evaluation of the intrinsic brain architecture in autism. Mol Psychiatry 19(6): 659-667.
- L Strother, G Glover, Diana Krenz, Vince Magnotta, First Birn (2006) Reducing interscanner variability of activation in a multicenter fmri study: role of smoothness equalization. Neuroimage 32(4): 1656-1668.
- MD Esposito, LY Deouell, A Gazzaley (2003) Alterations in the bold fmri signal with ageing and disease: a challenge for neuroimaging. Nat Rev Neurosci 4: 863-872.
- S Strother, S La Conte, HL Kai, J Anderson, J Zhang (2004) Optimizing the fmri data-processing pipeline using prediction and reproducibility performance metrics: I. a preliminary group analysis. Neuroimage 23(Suppl 1): S196-S207.
- Hui Zou, Trevor Hastie (2005) Regularization and variable selection via the elastic net. Journal of the Royal Statistical Society, Series B 67(2): 301-320.
- SG Mueller, MW Weiner, Leon J Thal, Ronald C Petersen, Clifford Jack (2005) The alzheimer’s disease neuroimaging initiative. Neuroimaging Clin N Am 15(4): 869-877.
- Y Benjamini, Y Hochberg (1995) Controlling the false discovery rate: A practical and powerful approach to multiple testing. Journal of the Royal Statistical Society. Series B (Methodological) 57: 289-300.
- KF Manly, D Nettleton, JT Hwang (2004) Genomics, prior probability and statistical tests of multiple hypotheses. Genome research 14(6): 997-1001.
- JD Storey, R Tibshirani (2003) Statistical significance for genomewise studies. Proc Natl Acad Sci USA 100(16): 9440-9445.
- JD Storey, A Dabney, D Robinson (2015) q-value: Q-value estimation for false discovery rate control.
- Robert Tibshirani (1996) Regression shrinkage and selection via the lasso. Journal of the Royal Statistical Society. Series B (Methodological) 58(1): 267-288.
- Leo Breiman (2001) Random forests. Machine Learning 45: 5-32.
- Baptiste Gregorutti, Bertrand Michel, Philippe Saint-Pierre (2017) Correlation and variable importance in random forests. Stat Computing 27: 659-678.
- A Lerner, A Bagic, T Hanakawa, EA Boudreau, F Pagan, et al. (2009) Involvement of insula and cingulate cortices in control and suppression of natural urges. Cerebral Corte 19(1): 218–223.
- R Remedios, NK Logothetis, C Kayser (2009) An auditory region in the primate insular cortex responding preferentially to vocal communications sounds. Journal of Neuroscience 29(4): 1034-1045.
- LC Xu, G Zhang, Y Zou, MF Zhang, DS Zhang, et al. (2017) Abnormal neural activities of directional brain networks in patients with long-term bilateral hearing loss. Oncotarget 8(48): 84168-84179.
- B Plakke, LM Romanski (2014) Auditory connections and functions of prefrontal cortex. Frontiers in Neuroscience 8: 199.
- Chen H, X Duan, F Liu, F Lu, X Ma, et al. (2016) Multivariate classification of autism spectrum disorder using frequency-specific resting-state functional connectivity-a multi-center study. Prog Neuropsychopharmacol Biol Psychiatry 64: 1-9.
- SJ Gotts, WK Simmons, LA Milbury, GL Wallace, RW Cox, et al. (2012) Fractionation of social brain circuits in autism spectrum disorders. Brain 135: 2711-2725.
- LV Hedges (1981) Distribution theory for glass estimator of effect size and related estimators. Journal of Educational Statistics 6: 107-128.
- CJ Lynch, LQ Uddin, K Supekar, A Khouzam, J Phillips, et al. (2013) Default mode network in childhood autism: Pos- teromedial cortex heterogeneity and relationship with social deficits. Biological Psychiatry 74(3): 212-219.
- KH Zou, DN Greve, M Wang, Meng Wang, Steven D Pieper, et al. (2005) Reproducibility of fmri: preliminary results of prospective multi-institutional study performed by biomedical informatics research network. Radiology 237(3): 781-789.
-

This work is licensed under a Creative Commons Attribution-NonCommercial 4.0 International License.


