


 Research Article
Application of Multivariate Statistical Methods of Patient Surviving ART Follow-up
Received Date: March 20, 2019; Published Date: April 08, 2019
Abstract
The study focuses on group investigation conducted in Gombe State Teaching Hospital by monitoring and taking account of those receiving ART from the hospital data base within similar period, variable used were age, gender, place of residence. The result as was ascertained on the enormous female turnout showing a signal revealing how women were devoted with regards to submission to treatment for the HIV/AIDS during follow-up. Base on the collected fact there was problem of update for patient check-up from the laboratory and update of patient record form the data base. Married teams were seen to be more shocking with highest number of patient with the virus from all age group. Base on the achievement seen that the course of death due to HIV was reduced compared to the previous years, this shows that the introduction of the ART play a part very well in achieving this progress. A way forward, the effort of HIV/AIDS should tackled be young reduction, it should be effected towards preventing feature coming up generation with contamination of the virus in the hospital Gombe State and Nigeria in general. Lastly with regards to the success achieved those in the HIV section, deserved to be sincerely empowered and motivated.
Keywords: Human immunodeficiency virus; Sexually transmitted disease; Acquired immunodeficiency syndrome; Antiretroviral therapy; Antiretroviral; Gombe state
Background on qT −X Family of Distributions Induced by V
Human Immunodeficiency Virus (HIV) is fitting in to a group of viruses called retroviruses. Is a specific virus that was wellknown for the past decade. Despite of this circumstances relating to expectation of HIV stigmatization, previous studies gave very little or no care. The current antiretroviral medicines that is available for now is only to reduces the infection rate but cannot be able to cure people with the epidemic. The cure for HIV virus in the body assist in reducing the active of the virus so that the immune body system will be at normal stage. Means the cure would not completely wipe out the virus but with placing to the right treatment and care, individual leaving with virus may perhaps hope to live a prolonged and healthy life. Nevertheless, the virus normally exist in semen, vaginal fluids and moisture in the rectum, blood, genital fluids and breast milk. The new infected cells into the pool that the reservoir will be saved with antiretroviral therapy possibly totally stops the new entrance. Another means of becoming a victim is through the course of insecure anal, vaginal and oral sex, by sharing of injecting or razor blade and mother transferring to her baby during pregnancy or in the course of breastfeeding. There means of preventing this virus is by conducting a blood test which can expose if a person is HIV positive, when it’s tested positive then one can get active antiretroviral therapy to commence the curing transformation of the virus.
The objectives aim of the research study
1. To make use of the appliance of statistical techniques of univariate and multivariate to identify with those HIV patient undergoing follow-up.
2. To defined the survival age groups of patient receiving treatment based on their gender.
3. To discover and investigate which gender has high prevalence of HIV in the Hospital.
4. To Identifying whether educational background has significant role in reducing and preventing the spread of HIV prevalence in the hospital.
Statement of the problem
Prevalence rate of HIV was observed for the past decade nothing has been done to completely eradicate the epidemic base on this the researcher intention is to identify the effect of the epidemic by apply multivariate statistical methods with other statistical analysis to find a profound lasting methods in talking the problem of HIV.
Significance of the study
The research analysis result will assist in determining whether the level of HIV is decreasing or increasing so that at the end will help Government and other bodies on how to plan and control the death, spread and to prevent people with HIV in the Teaching Hospital, Gombe State and Nigeria in general when completed.
Methodology
The study design is based on retrospective group study conducted from Gombe State Federal Teaching Hospital, Nigeria, which covered across 5000 sample of HIV positive victims from the record unit of the Teaching Hospital that were receiving treatment on ART. the data variable used were age, gender, place of residence, religion background, marital status, ethnicity, level of education and so on. The accumulated variable were analyzed using Statistical Package for the Social Sciences (SPSS) software.
The prevalence past in Nigeria
The history of HIV case in Nigeria commenced in 1985 from a young female lady with 13 years of age in Lagos State that was diagnosed with the disease which was reported in 1986. Nigerian society was seriously affected as the disease killed and destroyed many lives, the Government and people of the Federal republic of Nigeria recognize and acknowledge that the virus in Nigeria is on the threshold of an exponential increase in the country and consequently are committed to accept the challenge of reducing its secured and its impact on the nation by understanding and generally accepting to take some simple measures with cost effective. The epidemic level as 1991 was 1.8% which increase to 5.8% in 2001 and it started reducing slightly in 2003 with 5.0% and 4.4% in 2005. A survey that was executed by Federal Ministry of Health in Nigeria around 2003 and 2004 gave the information on the prevalence of heterosexual transmission in Nigeria was confirmed by several studies that focused on some high-risk and vulnerable groups. Generally there are so many observed factors that leads to the spread of the HIV epidemic. In 2003 the National HIV/AIDS and Reproductive Health Survey (NARHS) testified that about 18.4% of men aged 15-64 years and 9% of women aged 15-49 years were involve in extra and premarital sexual engagement. Revealed also said that youths were having serious risk of contamination with the virus which 14% were female then 25% were male, all were connected with non-marital sex. However only few uses condom while having sex. (32% women and 50% men).
Logistic Regression
As a result it considers the same set of problems as probit regression using related methods then again uses a cumulative normal distribution curve as a substitute. In spite of this the two techniques deals with latent variable called standard logistic distribution of errors and a standard normal distribution of errors. Logistic regression is seen as unique situation of generalized linear model and thus analogous to linear regression. The differences between the two models could be seen, either as conditional distribution y ∣ x {\displaystyle y\mid x} instead than Gaussian distribution, for the reason that the dependent variable is binary. And the predicted values becomes probabilities that is restricted between 0 and 1, all through the logistic distribution function, since logistic regression is used to predicts the probability of a certain outcomes. However logistic regression does not go alongside with normal distribution, it cannot be linear and in each group it will not have equal variance. Similarly the link between the predicted and response variables is not a linear function in logistic regression, instead it uses logistic regression function, which is normally the logit transformation of θ presented symbolically as

where; β represent the coefficient of the predictor, α is the constant from the equation.

is another alternative formula for logistic regression.
The class of variable in logistic regression is known as Bernoulli or binary variable were the dependent variable can be achieve with dichotomous outcome, in which the probability of success or one (θ ) represent the dependent variable while zero represent the probability of failure (1−θ ).
The Logistic equation
Logistic formulations are specified through the probability of
Y=1, which is denoted as  .The probability that Y is 0 becomes
1−
.The probability that Y is 0 becomes
1−  . However the ln symbol signifies as natural logarithm while
β0+β1X1 is the recognizable equation for the line of the regression ,
also P will be calculated from the regression equation. by realizing
the regression equation, theoretically we can determine the
expected probability for Y=1 from a given value of X as;
. However the ln symbol signifies as natural logarithm while
β0+β1X1 is the recognizable equation for the line of the regression ,
also P will be calculated from the regression equation. by realizing
the regression equation, theoretically we can determine the
expected probability for Y=1 from a given value of X as;

Were;  denote to be the exp which is the exponent function

Formula for assissting of Y from logit estimates 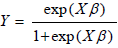
logit (Y) natural log(oddss)= 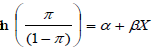
π = probability (Yis the outcomes of interest while Xis specific value of x)

∴ð = probability (Yis the outcomes of interest while X1 = x1,X2 = x2 )

Standard logistic regression distribution of inverse

The regression model is usually handle the forecasting of the logit which is the natural log of odds of considering one or the other conclusion.
That is 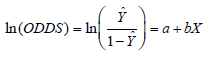
Where; can be used for the prediction of probability that the
event coded with 1 recommence the research if possible with 0
stopping the research. 1− represent the predicted probability for
additional finding, and X represent the predictor variable.
can be used for the prediction of probability that the
event coded with 1 recommence the research if possible with 0
stopping the research. 1− represent the predicted probability for
additional finding, and X represent the predictor variable.
Logistic regression assumptions
There is no correctly expression of the model that is, the real conditional likelihoods are the logistic function of the independent variables, there is no omission of significant variables, involving of extraneous variable is not possible and then measurement of independent variable is done without error. In terms of data structure it goes with continuous against discrete, the Probit regression is applied in a condition that the dependent variable is binary. There is different assumptions concerning the traditional regression and logistic regression, while the population means for the dependent variables at each point of the independent variable will not be on a straight line that is linearity is not realistic. The variance of errors are not permanent, this means no homogeneity of variance however the errors are not normally distributed, revealing normality is not possible. In respect of Maximum likelihood assessment is used relatively than the least squares estimate used in the traditional multiple regression.
Multinomial Logistic Regression
Logistic regression could be analyzed via multinomial logistic regression. It deals with the nature of multi way categorical dependent variable of an unordered values that refers to classification. However in the situation of having a dependent variables with more than two values is characterized as multinomial logistic regression. The Y accommodates more than 2 categories, However it those not consider the ordered arrangement like disease A or disease B or disease C, that is, it deals with situations where the result may have three or more likely categories.
Multinomial logistic model is define as Multinomial  ,
,

• Ordinal Logistic Regression: Ordered logistic regression or ordered logit considered dependent variables that is ordered values. It goes with dependent variables that is in ordered form. The binary logistic regression outcome are normally coded as 0 or 1, which the interpretation becomes the best and simple.
• Mixed Logistic Regression: Mixed logit is the more advancement of multinomial logit that usually acknowledges for correlations between the selections of the dependent variable. The improvement over logistic model for setting an interdependent variables is the conditional random position.
• Conditional Logistic Regression: In the Conditional logistic regression Y uses more than two categories that can be mounted on multiple magnitudes. Interesting the model is used in choice of political party, occupational selection, educational background and so on.
The odds in opposition to logistic regression
The Odds is a fraction of two corresponding probabilities with a property of single variable. The odds of the dependent variable corresponding to an event as a result of linear combination x {\ displaystyle x} of predictors is equal to the exponential function of the linear regression representation. The Odds in Logistic regression is used for the prediction of odds being an event based on the values of the independent variables (predictors). Odds in logistic regression can be distinct as the probability that a specific result is a case divided by the probability that is a non-case. More so logistic regression generates by using one or more predictor variables that may perhaps either one categorical or continuous. Not like the ordinary linear regression, However Predicting of binary dependent variables is used by logistic regression considering the dependent variable as the outcome of a Bernoulli trial instead than a continuous outcome. Given this transformation, the expectations of linear regression are violated with this regards, the residuals cannot be normally distributed.
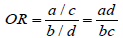
Mathematically the Odds is define by 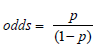
Where; exp(logit)⇒odds , ln (odds)⇒logit , 1 = p and 0 =1− p
The degree of relationship between an exposure coupled
with an outcome refers to (OR). Also it signifies the odds, that a
result will occur given a certain exposure, relating to the odds of
result outcome occurring in the absence any exposure. After the
computation of the logistic regression, the regression coefficient
(b1) is the expected increase in the log odds of the end result per
unit increase in regard to the exposure. On the other hand the
exponential function of the regression coefficient  denote the
odds fraction related with one unit increase in the exposure. Odds
proportion (OP) or Odds ratio (OR) can be seen as the likelihood or
risk of an event for experiencing the number of problem divided by
the number of whom may not possibly experience the problem. The
Odds ratio is a ratio that has link among two variables, it can be used
for measuring the relative odds of the occurrence of any outcome of
interest like disorder or illness, assigning exposure to the variable
of interest, that has to do with health aspect or medical precedent.
However the odds fraction is used in resolving whether a certain
exposure is a risk factor for a specific outcome, then comparing it
with the degree of several risk factors for that outcome.
denote the
odds fraction related with one unit increase in the exposure. Odds
proportion (OP) or Odds ratio (OR) can be seen as the likelihood or
risk of an event for experiencing the number of problem divided by
the number of whom may not possibly experience the problem. The
Odds ratio is a ratio that has link among two variables, it can be used
for measuring the relative odds of the occurrence of any outcome of
interest like disorder or illness, assigning exposure to the variable
of interest, that has to do with health aspect or medical precedent.
However the odds fraction is used in resolving whether a certain
exposure is a risk factor for a specific outcome, then comparing it
with the degree of several risk factors for that outcome.
OR = 1 There is no effect of exposure on the odds outcomes
OR > 1Exposure has a linked through higher odds of outcome
OR < 1 Exposure has an association through lower odds of outcome
 , Where; a is exposed sum of cases, b is exposed
sum of non-cases, c is unexposed sum of cases d is unexposed sum
of non-cases
, Where; a is exposed sum of cases, b is exposed
sum of non-cases, c is unexposed sum of cases d is unexposed sum
of non-cases

(Table 1)
Table 1 above for the age with gender showed that p < α indicating a significant different between age among gender revealing age of male patient receiving Art treatment is not equal to age of female patient receiving Art treatment in the hospital. Age with CD4 count displayed that p > α showing insignificant different between age among CD4 count, this showed that age of those with CD4 is equal to age of those without CD4. The result for age with chemistry showed that p > α , showing no significant different between age among chemistry. Age of those with chemistry is equal to age of those without Chemistry. The result of age with haematology showed that p > α , revealing no significant different between age among haematology. Age of those with haematology is equal to age of those without hematology. Age with hospital status result showed that p > α , showing there is no significant difference between age among hospital status. Hospital status 1=2=3. The result for age with marital status indicate that p < α mean there is significant different between age among marital status. At least one of the marital status showed different. After further analysis, it was seen that patient that were not married has less population in term of visit compare to the remaining status. The result of age with age category showed that p < α showing a significant difference between age among age category. At least one of the age category surfaced different that requires further analysis, age category 53 above showed 57.85% with the highest while age category 13 to 22 has the least with 20.34%. The result of age with various state of patient visit showed that p > α indicating insignificant different between age among those coming for follow-up from different state. State 1 is equal to 2, 3, 4, 5, 6 and 7. In respect of Quarter visit, the result for age with month of last quarter of visit showed that p < α revealing there is significant different between age among last quarter of visit. 1st quarter is equal to 2nd, 3rd, 4th quarter. Base on the mean third quarter has the highest record of patient tone out compare to others. There was contrary in respect to next visit of quarter system, which the statistics for age with quarter of next visit gave a p > α showing no significant different between age among next visit. since p is greater than alpha it requires no further analysis.
Table 1: Independent Sample Test of Man Whitney and One Way Anova of Kruskal Wallis Test.

Logistic Regression
(Table 2)
Table 2 result: Age was seen to be having a significant power on the patient receiving ART p < α (OR:0.921, 95% CI:0.912-0.931). The OR value for CD4 is 0.945 showing the risk of HIV patient with no CD4 count is lower with about 5.5% relating to those with CD4. Similarly haematology OR value is 1.327 showing the risk of patient without hematology checkup is higher with 1.337 times compared to those with haematology result. Those patient with no chemistry is 1.057 showing higher risk of 1.060 times compared to patient with chemistry. The OR value for patient status receiving treatment in the hospital was insignificant showing alive is 0.914 and death is 0.636, indicating there was lower risk of patient dying with regards to HIV with about 8.6% compared to death patient with 36.4%. Marital status showed that divorce and widow were statistically significant p < α (OR: 54.798, 95% CI: 13.031-230.442), (OR: 22.325, 95% CI: 42.277)). This showed that divorce patient were having higher times victim comparing to widow. While married was not significant revealing 21.2% less risk of patient within the marital status. Age category showed significant in age group 13 to 22 p < α (OR: 11.351, 95% CI: 5.927-21.738) similarly 23 to 32 was significant p < α (OR: 6.528, 95% CI: 4.157-10.242, 33 to 42 was significant p < α (OR: 2.136, 95% CI:1.369-3.331) but age group 43 to 52 those not attained statistical significant p > α (OR: 1.181, 95% CI: 0.740-1.884). For these age group 13-22 showed the highest with patient receiving ART while the 43-52 age group was having the least patient. Place of visit for all the various state was not significant, showing there was lower risk of patient receiving ART from all the state, which were as follows; 11.8% from Taraba also 19.6% from Adamawa, 20.1% from Gombe, 23.5% from Bauchi, 31.3% from Yobe and about 46.2% from Borno. Taraba state in terms of visit have the least while Borno is topping with the highest follow-up. Last month of visit in respect of quarter basis showed not significant in all, were the OR value gave 44.8% for 1st Quarter, 29.9% for 2nd Quarter and 42.6% for 3rd Quarter. This reveal that 2nd quarter experiences low response compared to 1st quarter and 3rd quarter. However the quarter basis for next month of visit also was not significant in all showing 1.230 times higher in 1st quarter while low response of 10.9% was seen in 2nd quarter compared to 19.8% in 3rd quarter. Occupation with reference others showed that student OR value was 1.266 times higher, civil servant accounted to 1.771 times higher, house wife was significant p < α (OR: 11.389, 95% CI: 2.155-60.182), OR for private reveal 2.281 times higher, business was 1.437 times higher, health personnel showed 1.886 times higher, military and paramilitary accounted with 1.363 times higher, hand work was 39.1% with lower risk, teacher recorded 2.637 times higher, retiree showed 3.452 time higher, farmer with 58% lower risk and banker was 43.2% of lower risk. Patient month of last visit with reference December showed that month of October and November were statistically significant p < α (OR: 0.360, 95% CI: 0.172-0.752), (OR: 0.425, 95% CI: 0.202-0.895, however the remaining month were insignificant and their odd ratios were as follows; OR for month of January is (1.291) times higher, February is (1.130) times higher, April is 21.7% lower, May is 20.4% lower , July is 33.8% lower and August is 16.4% lower. Contrary Next month of patient visit for all the month was not significant which reveal that January 32.5% lower, February 1.9% lower, April 1.048 times higher, May 25% lower, July 11.7% lower, August 1.030 times higher, October 22.6% lower and November (1.096) times higher.
Table 2: InLogistic Regression.

Multinomial Logistic
(Table 3)
Form the above Table 3 in respect to age category with ref 53 and above. Age group 13 to 23 prove statistically significant with lower odd ratio in all the three marital status, divorce is 92.9% (OR: 0.071, 95% CI: 0.024-0.210), married is 92.6% (OR: 0.074, 95% CI: 0.035-0.156) and widow is 91.6% (OR: 0.084, 95% CI: 0.033-0.209). Marital status for divorce and married has the highest number of patient with the virus in this age category compared to widow. Similarly, age group 23 to 32 shows that all the p-values for the marital status were statistically significant, divorce showed 84.1% (OR: 0.159, 95% CI: 0.063-0.401), married was having 80.7% (OR: 0.193, 95% CI: 0.094-0.094-0.395) and widow was 76.6% (OR: 0.234, 95% CI: 0.103-0.523) this showed that marital status for divorce and married were higher with the virus in this age category compared to widow. Age group 33 to 42 for the marital status were also statistically significant in all., divorce gave (OR: 0.190, 95% CI: 0.074-0.489), married is (OR: 0.311, 95% CI: 0.150-0.642) and widow is (OR: 0.287, 95% CI: 0.660). Here marital status for divorce and widow were leading in this age category compared to married. lastly the age category group for 43 to 52 shows that only two of the marital status were significant, divorce reveal (p=0.010, OR: 0.271, 95% CI: 0.100-0.733) and married is (p=0.019, OR: 0.406, 95% CI: 0.191-0.861) while widow was not statiscally significant showing (p=0.065, OR: 0.444, 95% CI: 0.187-1.053). In this marital status divorce and married were higher with the virus in this age category compared to widow. Hospital Status (Alive: reference transfer) and age category (reference 53 and above). Hospital status for age bracket 13 to 22 was not significant, death was 2.667 times higher than alive 1.919. However, hospital status for age bracket 23 to 32 was not significant, death was 2.252 times higher than alive 1.765. Hospital status for age bracket 33 to 42 was not significant, death was 2.210 times higher than alive 1.859 and Hospital status for age bracket 43 to 52 was not significant, alive was 1.282 times higher than death 1.043. State of visit (Gombe: reference other) and hospital status (reference transfer). Patient state of visit from Gombe shows that the hospital status was not significant showing that alive was lower with about 43.6% and death was lower with about 81.5%. Also Patient state of visit from Bauchi shows that the hospital status was not significant showing alive was 46.1% lower and death was 84.4% lower. Yobe hospital status showed insignificant alive odd of 28.1% lower and death odd was 75% lower. Patient state of visitors from Maiduguri showed that the hospital status was not significant showing alive odd gave 65.7% lower and death odd was 87.5% lower. Patient state of visit from Adamawa shows that the hospital status was not significant showing alive odd was 47.4% lower and death odd was 80% lower. Patient state of visit from Taraba showed that death status was statistically significant p < α . (p=0.000, OR: 80265E, 95% CI: 8.265E-10-80265-10), but alive patient was insignificantly lower with 50.8%. Gender (reference female) and state of visit (reference others). In respect of gender with patient place of visit reveal that all the state were not significant. Maiduguri, Yobe and Bauchi were times higher compare to Gombe, (1.488, 1.314, 1.078, 1.030), while Adamawa with 15.3% is having less patient visit compared to Taraba with 16.7%.
Table 3: Multinomial Logistic Regression.

Conclusion
The research end result was seen that among the patient undergoing follow-up, within and outside the zone showed that ART played an important role for reducing the course of death due to HIV/AIDS, however females were having higher number of patient turnout compared to male patient. It was exposed from the marital status that those that were married records with the high peak of follow-up from all the age group. Some tribe and locations especially those coming from rural areas were seen to be having negative perception about the virus also people tradition of knowing their status is another problem, Patient undergoing follow-up should maintained the culture of examination update. More so the analysis result showed that tender age were having the highest contamination with the virus as a result of ignorant about the virus.
Recommendation
Base on the results of findings, I recommend both the gender to be committed in reducing and bringing to an end of the matter. Patient therefore must be serious with regular update for their laboratory examination. However victims with the virus should shorn all form of stigmatization form the society because is a common phenomenon that should be expected from the general public. Government should make used of Ministry of Education in Nigeria to include about terrible syndrome like HIV/AIDS in to the curriculum system of education as well as prevention. Governmental and non-governmental body played a vital role indeed. This effort should tackled be young reduction, it should be effected towards preventing feature coming generation with contamination of the virus in Nigeria.
Acknowledgement
It our pleasure to acknowledge the management, staff and patient of Gombe State Federal Teaching Hospital, Gombe State Nigeria for their effort and support to see that this research became successful.
Ethics
The research was given approval form the ethics committee of the Federal Teaching Hospital Gombe State.
References
- Agresti A (2007). An Introduction to Categorical Data Analysis. Wiley, Oxford UK.
- Awoyemi AA (2016) Epidemiology; HIV; AIDS; Nigeria. King Saud University Saudi Journal of Biological Sciences.
- Beegl K, Walque D (2009) Demographic and Socioeconomic Patterns of HIV/AIDS Prevalence in Africa, Washington DC: Development Research Group, World Bank.
- Bewick LC (n.d.). Statistics review 14: Logistic regression. School of Computing, Mathematical and Information Sciences, University of Brighton, Brighton.
- Carlos A (2011) Parametric and Bayesian Modeling of Reliability and Survival Analysis South Florida.
- CHAO-YING JP, INGERSOLL (2002) Indiana University-Bloomington. An Introduction to Logistic Regression Analysis and Reporting 96(1).
- Chelsea M (n.d.) An Introduction to Logistic and probit regression model.
- Chisato HM (2015) Survival Analysis of Patients with Interval Cancer Undergoing Gastric Cancer Screening by Endoscopy.
- Christensen R (1990) Log-Linear Models and Logistic Regression. Springer, USA.
- Christopher (2007) Manning Logistic regression (with R).
- Constantin T, Yiannoutsos (2009) Modeling AIDS survival after initiation of antiretroviral treatment by Weibull models with change points. Journal of the International AIDS Society. year; BioMed Central.
- Crosnoe R, Mistry R, Elder G (2002). Economic disadvantage, family dynamics, and adolescent enrollment in higher education. Journal of Marriage Family 64: 690-702.
- David A, Freedman (2009) a b c^Jump up to: Statistical Models: Theory and Practice. Cambridge University Press, USA, p. 128.
- De Maris A (1995) A tutorial in logistic regression. Journal of Marriage and the Family 57: 956 - 968.
- Dobson AJ (2002) Introduction to Generalized Linear Models. Chapman and Hal.
- Fauci A (1988) The Human Immunodeficiency Virus; Infectivity and Mechanisms of Pathogenesis. 239: 617-622.
- (2011) Generalized Linear Models. STK3100-4.
- Georges P (2010) A Comparative Analysis of the Attitudes towards People Living with HIV/AIDS between Haiti and the Dominican Republic. Georgia State University.
- Harrell FE (2001) Jump up, Regression Modeling Strategies. Springer- Verlag.
- Harry BG, Ganzeboom (2011) Binomial Logistic Regression Review of Quantitative methods.
- Harry H, Panjer. (1988) Aids: survival analysis of persons testing HIV+ . Transactions of society of actuaries journal vol 40(1).
- JM Bland (2006) Applied Biostatistics Week 6: Proportions, risk ratios and odds ratios Risk ratio or relative risk.
- J Martin, BDAltman (2000) Statistics Notes The odds ratio. Education and debate journal 320: 1468.
- Jude IE (2009) Modelling HIV/AIDS Epidemic in Nigeria University of Glasgow Department of Statistics.
- Karl L, Wuensch (2014) All rights reserved. Logistic-SPSS.docx.
- Kori LH (2009) Logistic Regression Analysis to Determine the Significant Factors Associated with Substance Abuse in School-Aged Children Georgia State University.
- Lauren E, Cipriano GS, Zaric MH, Owens ML, Brandeau (2012) Cost Effectiveness of Screening Strategies for Early Identification of HIV and HCV Infection in Injection Drug Users.
- Levy J (1993) Pathogenesis of Human Immunodeficiency Virus Infection. Microbiology Review. 57: 183-289.
- Magdalena S (2010) Explaining Odds Ratios. Information Management for the Busy Practitioner journal.
- Manal AM, Maha AS (2016) Pattern of Management of Oro-facial Infection in Children: A Retrospective. Saudi Journal of Biological Sciences.
- Martha L Carvour (2012) Patterns and predictors of survival following an HIV/AIDS-related neurologic diagnosis University of Iowa. Iowa Research.
- Mary L, McHugh (2009) The odds ratio: calculation, usage, and interpretation . Biochemia Medica, 19(2): 120-126.
- Mike Tomz JW (1999) Interpreting and Presenting Statistical Results . APSA Short Course.
- Nam (2008) www.aidsmap.com issue 181 hiv treatment update.
- Newsom 1 (2015) Data Analysis II Logistic Regression. Overview: Logistic and OLS Regression.
- http://ccforum.com/content/9/1/112. (2005 9:112-118 (DOI 10.1186/ cc3045)). BioMed Central Ltd.
- JRoy (1958) Jump up ^ “The regression analysis of binary sequences (with discussion). 20: 215-242. JSTOR 2983890.
- Patrick S Sullivan ACD (2012) HIV in men who have sex with men 3 Successes and challenges of HIV prevention in men who have sex with men.
- Sharyn O, ’Halloran (n.d.). Sustainable Development U9611 Econometrics II. Lecture 10: Logistical Regression II. Multinomial Data.
- Rencher AC (2003) Methods of multivariate analysis. John Wiley & Sons 492.
- Richarme M (2002) Eleven Multivariate Analysis Techniques: Key Tools in Your Marketing Research Survival Kit. White paper.
- Ross SM (2010) Introduction to Probability Models. Elsevier, Oxford, UK.
- Sandy E (2007) Lecture 16: Logistic regression diagnostics, splines and interactions.
- Shibre MB (2014). Survival in HIV-Infected Patient after Initiation of HAART in Zewditu Memorial Hospital, Addis Ababa, Ethiopia.
- Sileshi HW (2013) Factors Determining the Prevalence of HIV/AIDS in Ethiopia Stockholm University.
- Truett J, Cornfield J, Kannel W (1967) Jump up^A multivariate analysis of the risk of coronary heart disease in Framingham. Journal of chronic diseases 20 (7): 511–24.
- Varbanov M, Espert L, Biard-Piechaczyk B (2006) Mechanisms of CD4 T-cell depletion trigged by HIV-1 viral infections 8: 221-236.
- Xiaosun L (2014). Statistical Modeling and Prediction of HIV/AIDS Prognosis: University of South Florida, Bayesian Analyses of Nonlinear Dynamic Mixtures.
-

This work is licensed under a Creative Commons Attribution-NonCommercial 4.0 International License.


