 Research article
An Untangling of Global Corona Pandemics
Ramalingam Shanmugam*
*Honorary Professor of International Studies,School of Health Administration, Texas State University, San Marcos, TX 78666, USA.
Ramalingam Shanmugam Honorary Professor of International Studies, School of Health Administration, Texas State University, San Marcos, TX 78666, USA.
Received Date: March 13, 2020; Published Date: May 18, 2020
Abstract
In this article, we untangle the mystic of globally scaring corona virus (also, recognized as COVID 19). For this purpose, we define and utilize the index of dispersion to construct a new methodology based on the corona incidence rate, θ and a restriction parameter, β via an incidence rate restricted Poisson (IRRP) model for the data analysis. The IRRP model was introduced by Shanmugam [1] for another purpose and it is found to be quite suitable to understand the mystic nature of non- quantifiable restriction(s) imposed on the corona exposure/treatment in China and everywhere in the world as it appears. The publicly available [2] corona data as of 27 February 2020 in the World Health Organization’s (WHO) web page are analyzed and interpreted in this article. In specific, the new methodology detects non-trivial patterns not only in corona incidences but also in the restrictions imposed to deal with the pandemic like this corona virus and this discovery would have been obscured otherwise. The healthcare policies with respect to corona incidences should be congruent to much needed restrictions such preventive hygienic practices as minimal necessities but can go as far as isolation in quarantines as the data evidences enlisted in this article are providing a strong support for them.
Keywords: Incidence Rate; Index of Dispersion; Poisson Distribution; Odds Ratio; Restriction Level; Reduction Level; Tail Value at Risk; Vulnerability.
Introduction
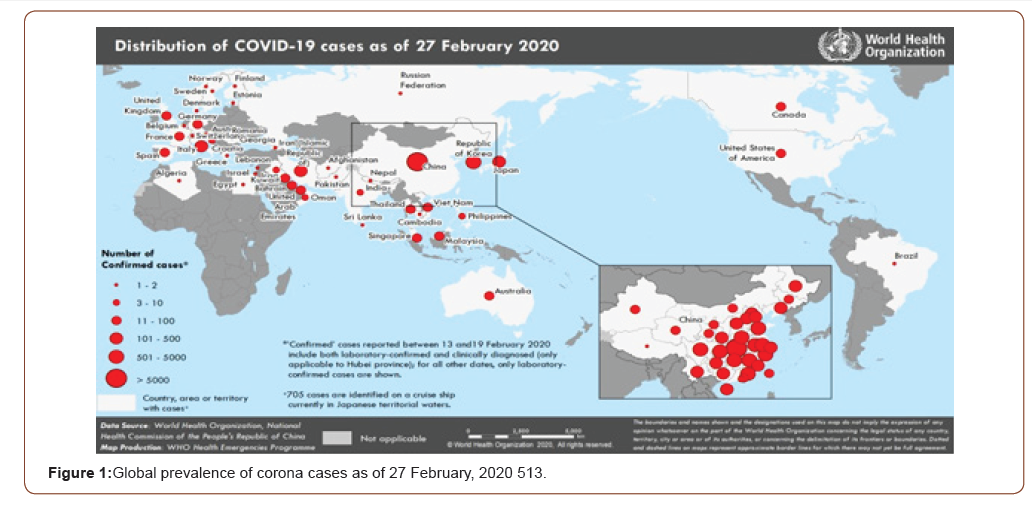
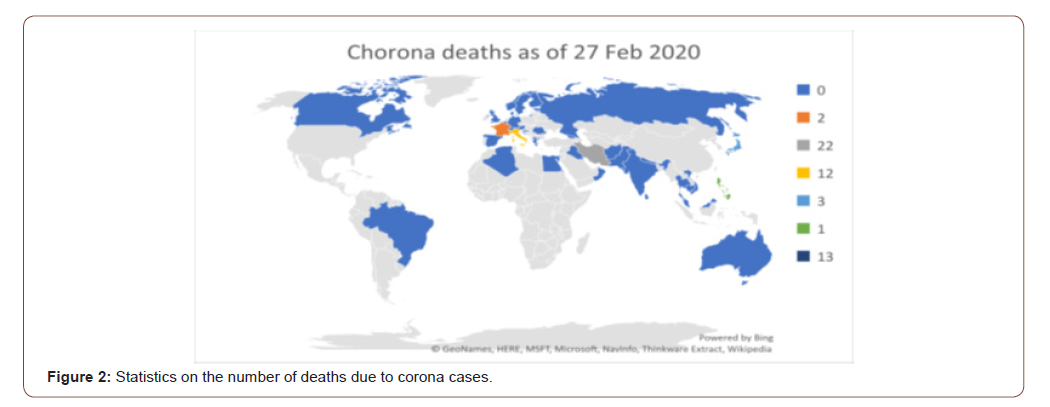
The background of this globally scaring corona virus is the following. On 24 January 2020, 1287 humans with corona virus (also recognized as 2019-Covid 19) were first noticed in Wuhan, China causing 41 deaths [3]. Neither the cause for the globally scaring corona virus nor an effective drug or treatment seems to be available. It appears (not proven) that the incubation period is speculated to be 7 to 14 days for those who have been exposed to the others. Now, this deadly virus has spread from China to other countries in Asia, Australia, New Zealand, Africa, Europe and American continents (Figure 1). The number of deaths due to corona virus in countries are mapped in Figure 2 and it has been changing on daily basis since 31st January 2020. See www.who.org for daily reports. The mystic corona cases have been a nightmare to the general public, health professionals, and the governing agencies globally.
The deadly epidemic like corona virus is not new to the world. The world citizens experienced a severe acute respiratory syndrome called SARS-CoV in year 2002 in Guangdong, China, MERS-CoV in year 2012 in the Middle East. As of 24 January 2020, there were 800 reported corona cases with a mortality rate of 3% (www.promedmail.org) [4,5,6] for data and background scenarios for the emergence and spread of the corona virus.
Noticing an occurrence of 12, 307 corona cases with a death of 259 as of 1 February 2020 in several countries around the world, the World Health Organization (WHO) [7] warned that incidence of corona virus is a global emergency. See Figure 1, an awareness of the corona incidences in countries, according to the WHO. See Figure 2 for statistics about the number of deaths due to corona virus.
Mediterranean, Conf= Confirmed, Susp=Suspected, EC=Exposed in China, EOCC=Exposed outside of China and the


ratio of corona free under restriction compared to no restriction, R is the reduction in hazard rate of corona cases by the restrictions, V refers the vulnerability to corona virus in the region, and C denotes change in tail value at risk to corona virus due to imposed restrictions. Notation na refers not estimable because of zero variance or zero mean.
Main Contribution: A New Methodology
Let Y = 0,1, 2, 3,..... be a random number of corona cases of a specified type (which might be due to exposed to a carrier in a location) with an unknown incidence rate 0 <θ < β , where β denotes a non-observable (that is, latent) preventive or treatment action(s). Because the random variable (RV) Y is an integer valued Poisson type, we could consider the incidence rate restricted Poisson (IRRP) model

The IRRP in (0.1) was introduced by Shanmugam [1]. The IRRP is quite versatile and appropriate for the corona virus data analysis because there is an apparent restriction on the incidence rate, though data on the restrictions are neither collected nor reported in any place. In the absence of any relevant data on restrictions on the diagnostic, on how many days the infected individuals are quarantined, or on any preventive measures to stop the emergence of new cases etc., it is prudent to assume them as latent phenomena and it makes to treat them as a parameter, β .
In the absence restrictions, the incidence rate θ > 0 could be a parameter of the Poisson chance mechanism. That is, the probability of noticing one corona case in an infinitesimal interval of unit time is θ , while the probability of having two or more corona cases in that time interval is negligible. That is the framework of Poisson chance mechanism. It is not this way the corona incidences are happening. In other words, only when there is no finite restriction on the incidence rate (that is, parameter β = ∞ ), the
model suits the commonly practiced Poisson chance mechanism, whose model is

See Stuart [8] for properties of the commonly utilized Poisson distribution. One such properties is the equality of the expected value and the variance. Otherwise (that is when the chance mechanism in which the corona incidences are quite restricted), the IRRP in (0.1) suits the reality of the corona incidence pattern.
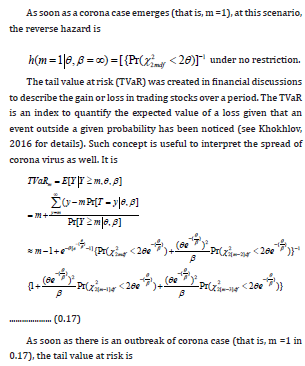
We define here the ratio of the expected value over the variance is known as index of dispersion (ID) and it is useful in statistical modelling. The ID for Poisson mechanism of is value one because the equality of mean and variance characterizes the Poisson situation. Otherwise (that is, when the incidence rate is restricted with β ≠ ∞ , the ID for the IRRP in (0.1) is

which attains a value in the domain[0,1] because θ ≤ β , suggesting that a characteristic property of the IRRP is under dispersion. In this article, we utilize the sample estimate of the
index of dispersion,  as a basis to devise a simple alternative
test to the Shanmugam’s C(α ) test, which was a bit cumbersome.
See Shanmugam [9] for statistical applications of under, equal, and
over dispersions.
The maximum likelihood estimate (MLE) of the incidence rate
and its restriction parameter involves the sample mean,  variance,
 as shown in (0.3) and (0.4) respectively. The MLEs
are asymptotically most efficient [8]. A virtue of the MLE is that the
MLE of a function of the parameters is the function of the MLEs.
That is, the MLEs are


Be assured that in the Poisson chance mechanism, the sample
variance,  and sample mean, y are likely to be not significantly
different from each other. Consequently, the estimate in (0.3) becomes
 confirming the (unrestricted) Poisson incidence
rate is the sample average. In a restricted Poisson chance
mechanism, the estimate in (0.4) quantifies the impact level of all
restrictions. The sample mean and variance are independent only
if the sample is drawn from the normal population. Otherwise,
the sample mean, and sample variance are not independent [10].
Regression based asymptotic principle was developed by Neyman
and it is recognized as C(α ) test [1]. Yet, we provide, in this article,
an alternative and simple version to the C(α ) test and it can be exercised to check the validity of the null hypothesis H0 :β = ∞(which personifies that there has been no finite restriction on the
corona incidence rate) against the alternative hypothesis, :
(which refers that there is a finite and significant restriction on the
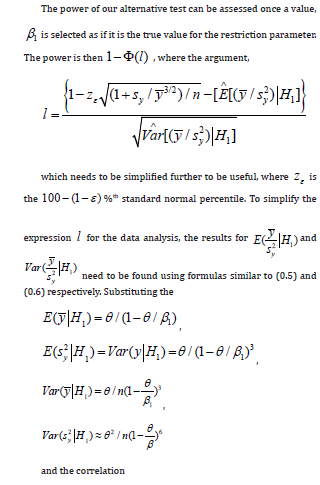
corona incidence). In other words, the null hypothesis is rejected, when the test statistic
 is significantly larger and
contradictory to Ha β < ∞. The probability that Ha β < ∞ a
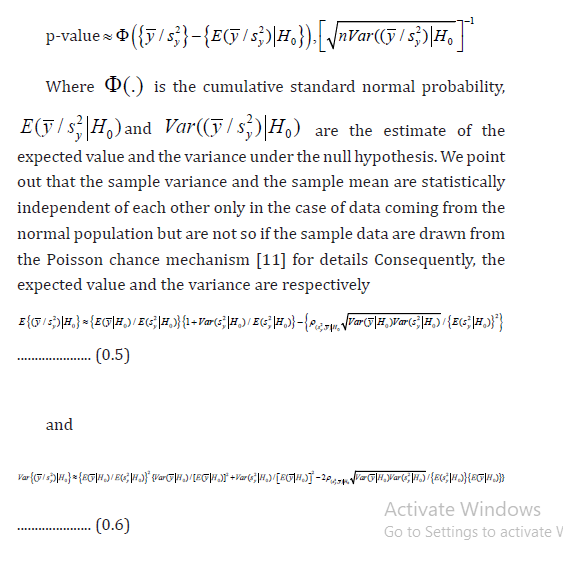
true statement, based on the collected data evidence is the p- value
and it is approximately
Data Analytic Results and Their Implications on Corona Pandemics
The corona incidences have been rare and sporadic only in two countries (that is, Algeria and Egypt) and the data for Africa are insufficient to cite here. The Western Pacific (WP) with 8 countries (Australia, Cambodia, Japan, Malaysia, Philippines, Korean Republic, Singapore, and Vietnam), South East Asia (SEA) with 4 countries (India, Nepal, Sri Lanka, and Thailand), Americas (AM) with 3 countries (Brazil, Canada, and United States of America), Europe (EU) with 20 countries (Austria, Belgium, Croatia, Denmark, Estonia, Finland, France, Georgia, Germany, Greece, Israel, Italy, Macedonia, Norway, Romania, Spain, Sweden, Switzerland, and United Kingdom), and Eastern Mediterranean (EM) with 6 countries (Bahrain, Iran, Iraq, Kuwait, Oman, and United Arab Emirates), along with the 34 locations in China. We next find the mean and variance of the number of corona cases in each region (see Table 1).
Notice that the mean is lesser than the variance which is q
requirement to use IRRP model (0.1). Using expressions (0.3) and
(0.4), we estimate (see Table 1) the incidence rate and restriction
level parameters (namely, Θ and β ) for each region. The largest
incidence [12] rate was in Western Pacific region for those exposed
to the virus in China. Ironically, the largest restriction level was in
South East Asian region for those exposed to the virus in China.
In over all sense, the estimates of the corona incidence rate and
the restriction level are significantly correlated  at a
significance level 0.000.
Table 1: The data analytic results on corona pandemic*
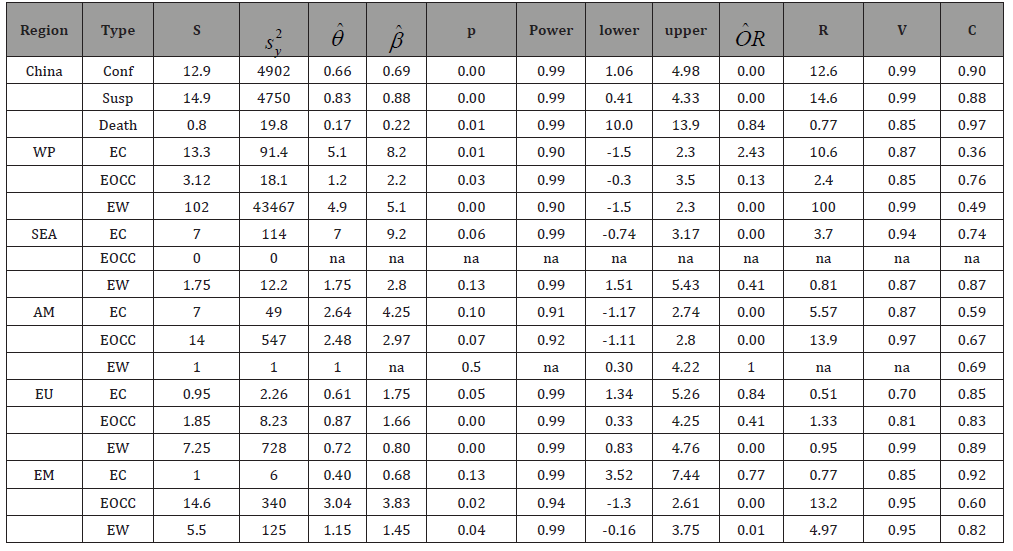
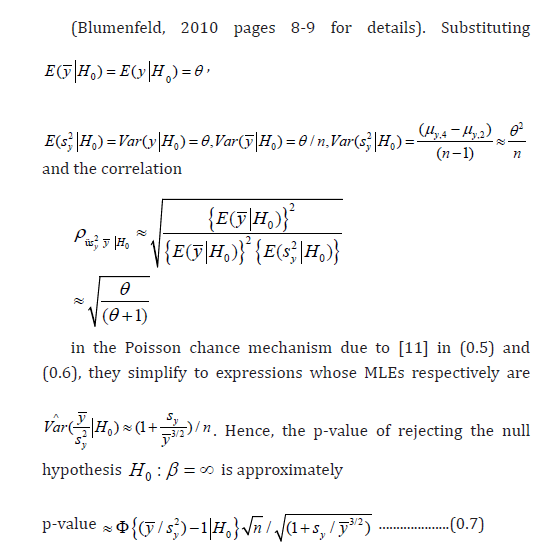
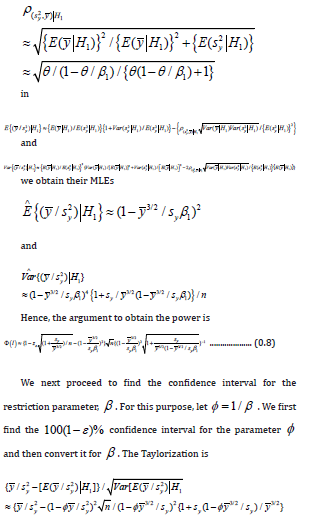
Based on the p-values (which are computed using expression (0.7), we notice that the ineffective restriction occurred only in three places: South East Asians and Americans exposed to the virus within their country, and East Mediterranean exposed to the virus in China. Using expression (0.8), the power of accepting the true
alternative hypothesis, 1:1 a H β = is computed and the power
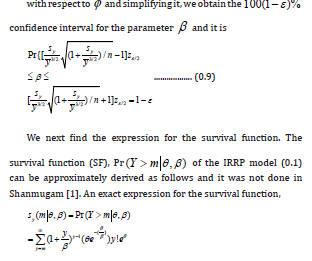
is consistently high in all regions (see Table 1). Using expression
(0.9), the lower and upper limit of the 95% confidence interval
for the restriction level parameter, b is computed and they are
displayed in the Table 1. In the regions, the South East Asians and
Americans who were exposed to the virus within their country,
all Europeans (no matter where they were exposed to the virus),
East Mediterranean who were exposed to the virus in China
experienced a significant restriction level. Using expressions (0.12),
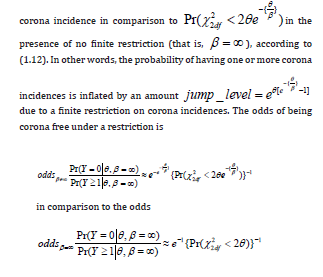
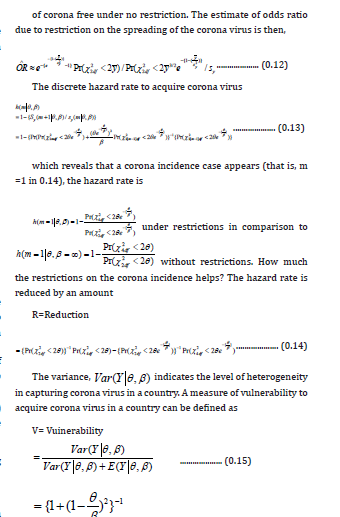
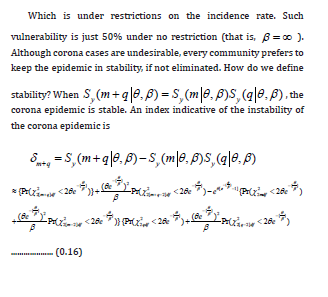
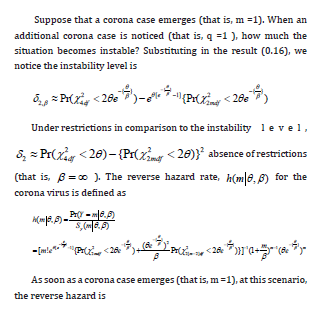
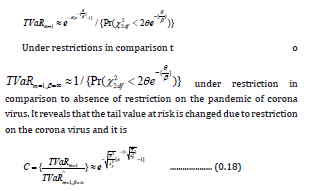
(0.14), (0.15) and (0.17), we computed the odds ratio (OR) , the
reduction level (R), the vulnerability (V ) and the change ( C ) in the
tail value risk were computed respectively and displayed . The OR
illustratesthe chance for being corona virus free under restrictions
in comparison to under no restrictions and it was largest in the
Western Pacific region for those who were exposed to the virus in
China. The hazard rate for becoming a corona case is reduced (R)
significantly because of restrictions imposed on the corona virus
and it was highest for the Western Pacific residents who were
exposed to the virus within the region itself. The vulnerability (V)
to acquire corona virus was high, unfortunately, in all the regions
and it was highest for Western Pacific residents and Europeans
who were exposed to the virus within their region. The measure
(C) illustrates the change in the tail value risk due to restriction
on the corona virus pandemic and it was highest for the East
Mediterranean who were exposed to the virus in China, though the
change was phenomenal in almost all regions. The change in the tail
value at risk is significantly negatively correlated with the estimate of the incidence rate
 as well as with the estimate
of the restriction level
  suggesting that smaller the
change in the tail value at risk relates to higher the incidence rate
as well as the restriction level. Likewise, the change in the tail value
at risk is significantly negatively correlated with the estimate of the
odds ratio
  implying that lower the change in the tail
value at risk amounts to higher the odds ratio (of being corona risk free). Furthermore, pictures worth the thousand words. In that
sense, let me emphasize the findings out of the new methodology
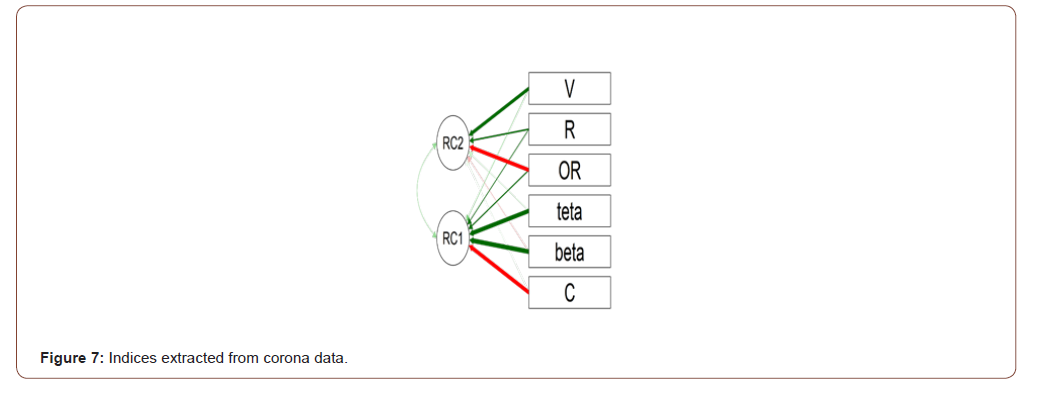
about the corona virus. The six estimated indices namely the incidence rate (θ), odds ratio (OR) , hazard
rate reduction (R) , vulnerability (V ) , and change in the tail value
risk (C ) form themselves as two groups (RC1, RC 2) of importance
as shown in the Figure 7.
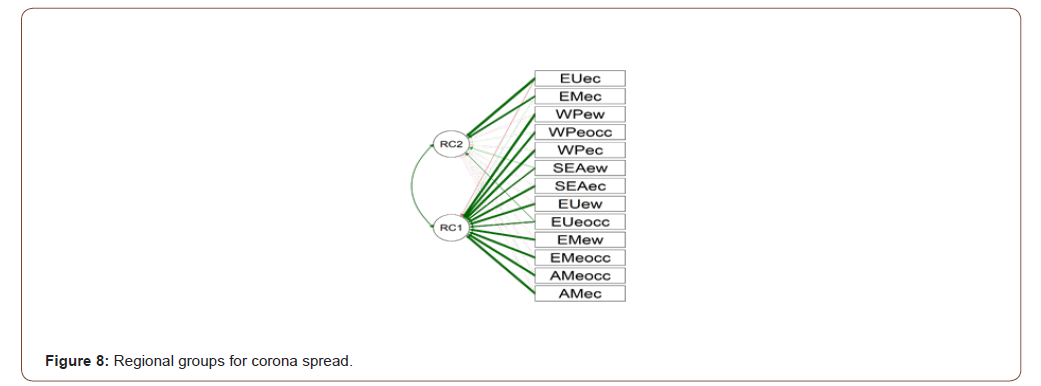
Likewise, the Europeans and East Mediterranean with those exposed to the corona virus in China form the first group (RC1). The West Pacific, South East Asians, Europeans, East Mediterranean with those who were exposed to the corona virus within their own country, the Europeans, West Pacific, South East Asians, and East Mediterranean with those exposed to corona virus in China, West Pacific, Europeans, East Mediterranean and American with those exposed to the corona virus outside China as well as outside their own country form (see Figure 8) a cluster (RC 2).
Conclusion
The incidence rate restricted Poisson with two parameters but not the traditional Poisson parameter with a single parameter is versatile enough to match the reality of the corona pandemics. The odds ratio, reduction in corona cases, vulnerability, and change that ocfcurs in tail value at risk due to the restrictions imposed to curtail the spread of corona virus are assessed with the methodology and the IRRP model.
The WHO compiled the data for countries grouped in terms of the regions: Western Pacific (WP) with 8 countries, South East Asia (SEA) with 4 countries, (North & South) Americas (AM) with 3 countries, Europe (EU) with 20 countries, and Eastern Mediterranean (EM) with 6 countries along with the 34 locations in China in which the pandemic is known to have originated. The data are utilized to test the null hypothesis, H0 :β = ∞ (which is synonymous with a scenario of ineffective restrictions on the spread of corona in a region) against an alternative hypothesis,
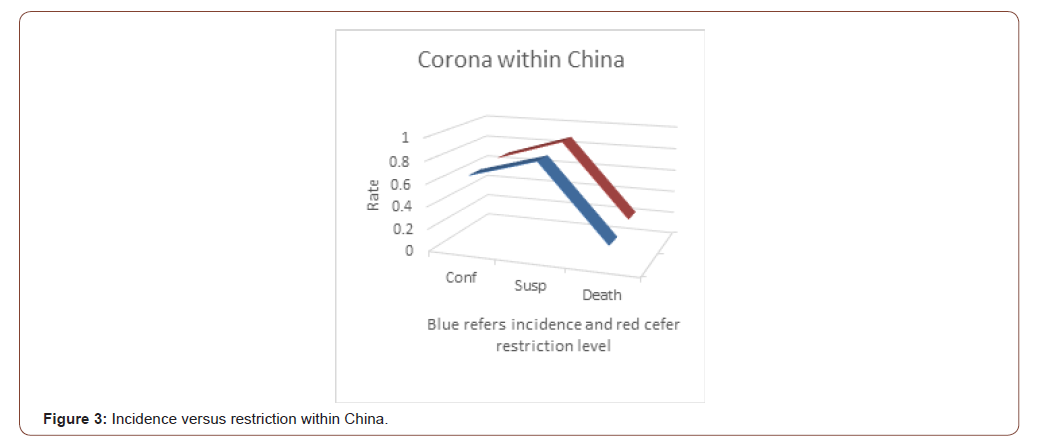
Ha β = β < ∞ (which refers an effective and significant restriction). The p-values and the power are displayed in Table 1. Except for those exposed to corona virus within the region in SEA, AM and EM along with those exposed in China, the restrictions in regions have been effective. The power of our methodology has been consistently excellent in all regions. In every region, the restriction has been intensified proportionally to the higher incidence rate of corona (see Figure 3 through Figure 8) and it attests to the efforts by the healthcare professionals and governing authorities.

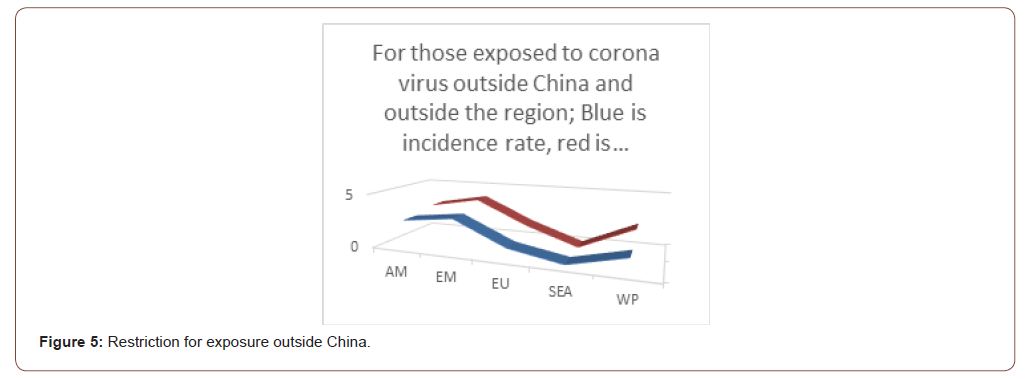
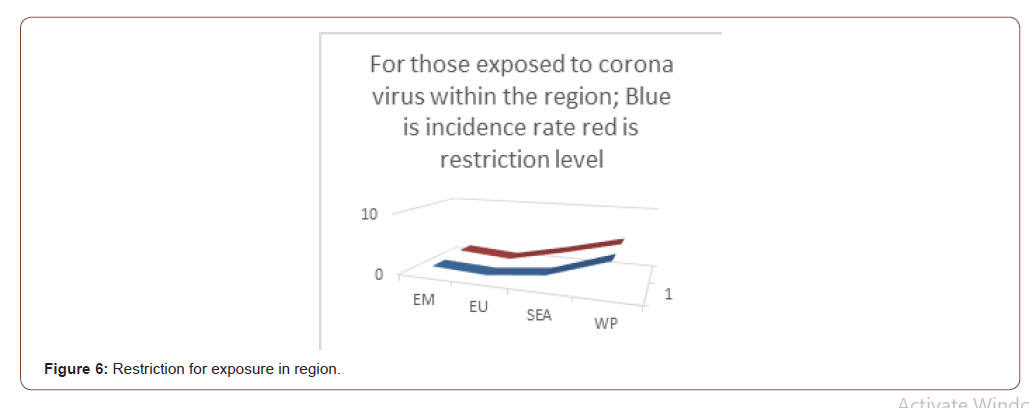
In the beginning of the outbreak of corona virus in China, many underestimated its virality. The WHO has been warning the world that the corona (COVID-19) virus should not be neglected as it could turn into pandemic and it happened exactly so (https:// www.arcgis.com/apps/). There had been 3,056 deaths in China, 827 deaths in Italy, 429 deaths in Iran, 66 deaths in South Korea, 55 deaths in Spain, 48 deaths in France, 30 deaths in USA, 16 deaths in Japan, 8 deaths in Iraq, 8 deaths in United Kingdom,
5 deaths in Netherlands, 4 deaths in Switzerland, 3 deaths in Belgium, 3 deaths in Germany and so on with a total of 127,863 confirmed corona cases worldwide. The idea of asking employees to stay in home and do the work assignment is getting popular worldwide phenomenon to contain the virus from spreading. The international travels are discouraged and the airlines cut down or cancel their flights. The schools and universities resort to closing temporarily their campuses and it stumbles the learning/ dissemination of knowledge. The associated businesses like food industries, retaurents, lodgings, recreations, sports, conferences etc. do get cancelled. All these fuel the world wide economic stagnations, crippling the prosperity and growth leave along the psychological panicking among worldwide citizens. It is time for all professionals in public health arenas apply serious efforts to curtail not only this corona virus but also be prepared to dealth with other future pandemic in its embryonic stage itself.
Acknowledgement
None
Conflict of Interest
No conflict of interest.
References
- Shanmugam R (1991) Incidence rate restricted Poissonness, Sankhya (B) 53(2): 191-201.
- https://www.who.int/emergencies/dis eases/novel-coronavirus, as of 27 February 2020 (Report #19).
- Backer JA, Klinkenberg D, Wallinga J (2020) Incubation period of 2019 novel coronavirus (2019-nCoV) infections among travellers from Wuhan, China, 20–28 January 2020. Euro Surveill 25 (5): 1-10.
- Chen N, Zhou M, Dong X, Qu J, Gong F, et al. (2020) Epidemiological and clinical characteristics of 99 cases of 2019 novel coronavirus pneumonia in Wuhan, China: a descriptive study. Lancet 395: 507-513.
- Liu Y, Gayle AA, Wilder-Smith A, Rocklöv J (2020) The reproductive number of COVID-19 is higher compared to SARS coronavirus Journal of Travel Medicine, Journal of Travel Medicine 27(2): 1-4.
- Phan LT, Nguyen TV, Luong QC, Nguyen TV, Nguyen HT, et al. (2020) Importation and human-to-human transmission of a novel coronavirus in Vietnam. N Engl J Med 382: 872-874.
- World Health Organization. Disease Outbreak News: Pneumonia of unknown cause – China.
- Stuart A, Ord K (2015) Kendall’s Advanced Theory of Statistics,Oxford University Press, London.
- Shanmugam R (2011) Is Poisson dispersion diluted or over-saturated? An index is created to answer, American Journal of Biostatistics 2(2): 56-60.
- Blumenfeld D (2010) Operations Research Calculations Handbook, CRC Press, Boca Raton, Florida.
- Shanmugam R (2011) Correlation between dispersion and mean to assess healthcare service efficiency, American Journal of Biostatistics, 2(2): 36-43.
- Khokhlov V (2016) Conditional value-at-risk for elliptical distributions. Evropský časopis Ekonomiky a Managementu 2 (6): 70-79.
-
Ramalingam Shanmugam. An untangling of global corona pandemics. Annal Biostat & Biomed Appli. 3(5): 2020. ABBA.MS.ID.000580.
Incidence Rate; Index of Dispersion; Poisson Distribution; Odds Ratio; Restriction Level; Reduction Level; Tail Value at Risk; Vulnerability..
-

This work is licensed under a Creative Commons Attribution-NonCommercial 4.0 International License.


