


 Review Article
A Simple and Effective Method for Validation of Transcriptomic Data
Received Date: July 25, 2025; Published Date: August 01, 2025
Abstract
In the field of research on medical reproduction, the selection of embryos with the best potential for implantation is the main challenge for biologists. Several studies suggest that the genes involved in oocyte cell crosstalk could represent biomarkers of candidate genes for the selection of embryos with the greatest potential for implantation. Variability (noise) of different sources (biological, technical, etc.) was observed during the transcriptomic experiment. Thus, one could hypothesize reasonable doubt about the validity of these transcriptomic data to provide a reliable and robust predictive model of pregnancy. In summary, the main objective of this study is to validate or not these transcriptomic data by The PCA method, The Likelihood Report and the Youden Index. Why? The association of information from the PCA Technique, the Likelihood Report and The Youden Index, lead to a powerful tool in terms of diagnostic effectiveness. The data is composed of 21 biomarker genes involved in qPCR (quantitative Polymerase Chain Reaction) analysis of 102 embryo / cumulus cell samples from patients undergoing in vitro fertilization. The PCA and the Stochastic Indexes cited above will make it possible to give up the complete analysis in the case where the data are biased and thus save time in termed of processing./p>
Keywords:Reproduction; embryos; oocyte cells; biomarkers; variability; transcriptomic; PCA; likelihood Report; youden index
Introduction
The transcriptomic data used correspond to 21 genes as genomic signature and 102 sample-cumulus of patients previously treated. And our goal is to optimize the time of data analysis and their interpretations in terms of correlation (redundancy). The factorial tool that will be used for pre-treatment is the main component decomposition [1,2]. It is recalled that the Principal Component Analysis is used to extract and visualize the important information contained in a multivariate data table. The PCA synthesizes this information into just a few new variables called main components. These new variables correspond to a linear combination of the original variables. The number of principal components is less than or equal to the number of original variables [3-6]. The information contained in a dataset corresponds to the variance or total inertia it contains. The objective of the PCA is to identify the directions (main axes or principal components) along which the data variation is maximum. In other words, the PCA reduces the dimensions of a multivariate data to two or three main components, which can be visualized graphically, losing as little information as possible [7-9].
Background
Basics of the PCA
Note that the PCA is particularly useful when the variables in the dataset are highly correlated. The correlation indicates that there is redundancy in the data. Because of this redundancy, the PCA can be used to reduce the original variables to a smaller number of new variables (= principal components), the latter accounting for most of the variance contained in the original variables.
Data Standardization
In principal component analysis, variables are often standardized. This is particularly recommended when variables are measured in different units (for example: kilograms, kilometers, centimeters, ...); otherwise, the result of the PCA obtained will be strongly affected. The goal is to make the variables comparable. Typically, the variables are normalized so that they ultimately have (i) a standard deviation of one and (ii) an average of zero. Technically, the approach is to transform the data by subtracting a reference value (the average of the variable) from each value and dividing it by the standard deviation. At the end of this transformation, the data obtained are called centric-reduced data. The PCA applied to these transformed data is called the standard PCA. Data standardization is a widely used approach in the context of analysing gene expression data prior to PCA and clustering analyses.
When normalizing variables, the data can be transformed as follows:

Where mean (x) is the average of the values of x, and sd (x) is the standard deviation? The scale function can be used to normalize the data under R.
Eigenvalues / Variances
As described in previous sections, eigenvalues measure the amount of variance explained by each major axis. We examine eigenvalues to determine the number of principal components to consider. The eigenvalues and the proportion of variances (i.e., information) retained by the main components can be extracted using the function get eigenvalue [10].
Formulation of the problem
The variable to explain Y that takes only two modalities: the positive or negative pregnancy (Gr + /Gr−) is a categorical and dependent binary random process that follows a binomial probability distribution with the parameters (N, p). This random variable is formulated as follows: in relationships also occur for other types of bioactivities [33].

X is the descriptive matrix ∈Rp+1
β is the predictor vector ∈RN+1
ε is the residual error following a normal distribution defined
on the space Ω (0,σ 2) of zero mean and of variance =σ 2 .
The explanatory variable X represents the gene expression data. In our case, it is the following matrix:

It is an explicative matrix of N rows (cumulative), and P genes. The goal is to predict the Y vector. To do this, we performed PCA analysis and we compute the Likelihood Report (LR) and Youden Index (YI) to explore the quality of the data and see if we go far in the analysis [11-16].
Results of the PCA method:
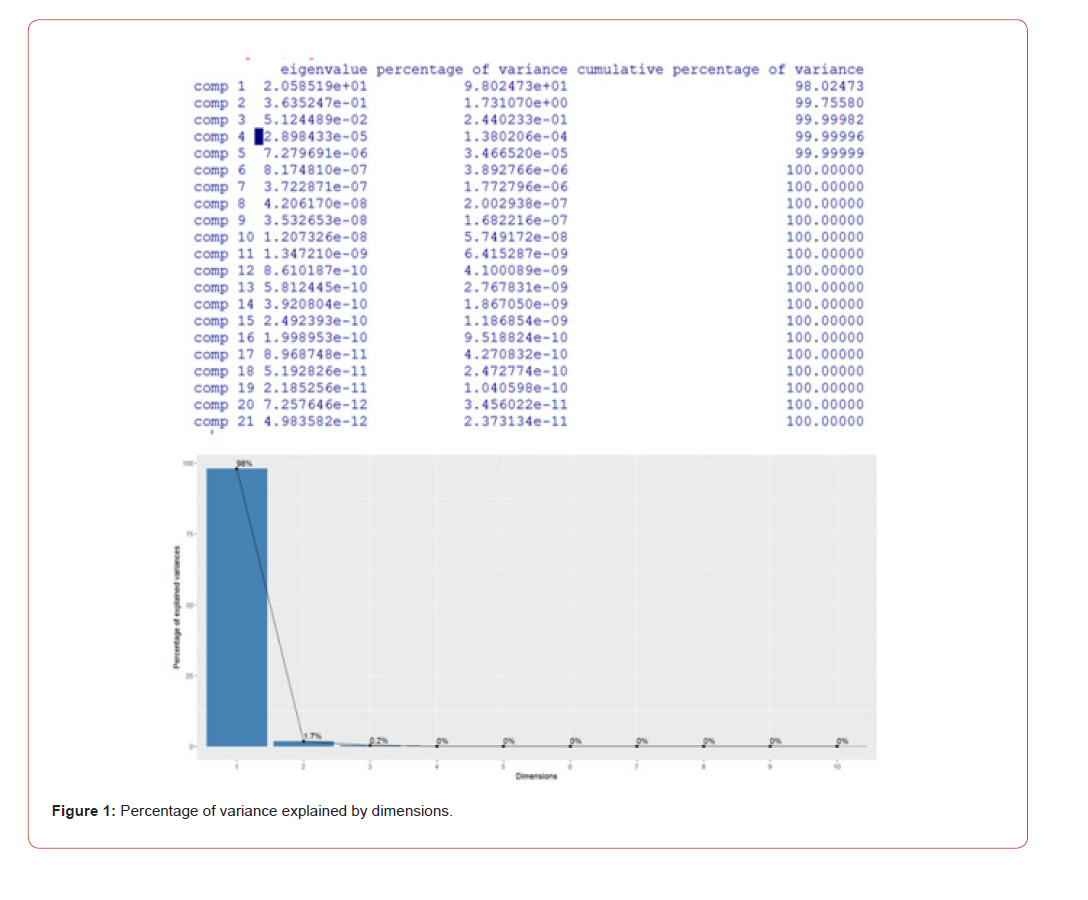
Eigenvalues and cumulative variances
Below, we give the results of the PCA of our dataset
Note that the large variation is held by the main component 1:
98.024 % From the graph above, we might want to stop at the first
main component. 98% of the information (variances) contained in
the data is retained by the first main component (Figure 1).
Correlation circle
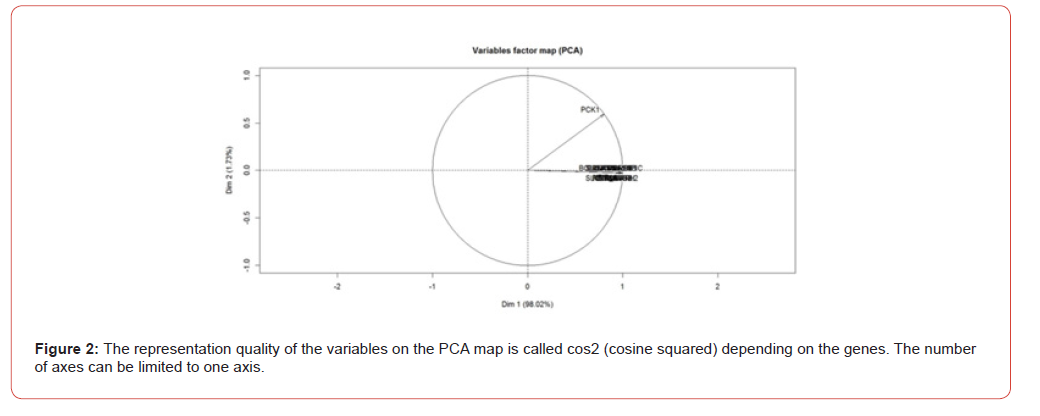
The correlation between a variable and a Principal Component (PC) is used as the coordinates of the variable on the principal component. The representation of the variables differs from that of the observations: the observations are represented by their projections, but the variables are represented by their correlations [17] (Figure 2):
The graph above is also known as a correlation graph of variables.
It shows the relationships between all the variables. It can be
interpreted as follows:
• Positively correlated variables are grouped together.
• Negatively correlated variables are positioned on opposite
sides of the chart origin (opposite quadrants).
• The distance between the variables and the origin measures
the quality of representation of the variables.
• Variables that are far from origin are well represented by the
PCA.
Note that almost all variables are correlated and contained in axis 1.
Note that individuals are similar are grouped on the graph. There is strong redundancy between the variables and therefore strong correlation.
Likelihood Report (LR):
Two versions of the likelihood ratio exist, one for positive and one for negative test results. Respectively, they are known as the positive likelihood ratio LR+, for positive results and likelihood ratio LR- for negative results [18,19]. In medicine, the LR is used in the context of clinical tests (any medical examination) to statistically determine the probabilities for a patient to have a pathology or not. If the LR is equal to 1, this means that patients and non-patients obtain the same test results. It therefore has no diagnostic interest. The LR becomes interesting when it is greater than 1 since this indicates that the positive test is more frequent in sick patients. In this case, therefore, it has real diagnostic value. The Likelihood Ratio associating sensitivity (Se) and specificity (Sp) have been proposed. The most classical are:
Positive Likelihood Report
Definition: how often is it more likely to present the Gr+ event knowing that one has the positive test (T+):

The measure of the likelihood of having a positive test if the Gr event is true (Gr+) .
• LR(+) varies from 0 to infinity. The higher it is, the higher
the “Gain in diagnosis” is important.
• LR+ =1: brings nothing to the diagnosis.
• 1< LR+ ≤10 : minor contribution.
• −LR+ >10 : significant contribution.
A positive likelihood ratio of 10 e.g., means that there is 10 times more chance of presenting a positive test when the person presents the event Gr =1 (true) than when the person does not present this event (Gr = 0) .
Negative Likelihood Report
Definition: how often is it more likely not to present the Gr event knowing that we have the Negative Test (T −) ?

LR-: quantifies the chance of presenting a negative test when the subject does not present the true Gr event compared to a subject presenting the Gr event.
Note: LR reference values
Table 1:

A negative likelihood ratio of ¼ e.g., means that there is four times more chance of presenting a negative test when the subject does not have Gr event than when the subject in Gr event is true.
The Youden Index
The Youden Index noted YI such as:

This measures the accuracy of the diagnostic method. It depends on the specificity and sensitivity of the test, but not on the prevalence of the event (Gr + / Gr−) . The Youden’s Index varies between -1 and 1. When equal to 0, it indicates that the test is ineffective. The diagnosis is maximal when the index YI is close to 1. It therefore allows the quantification of the informative value of a clinical sign, such as the Pregnancy event [20,21].
Stochastic Results regarding The Likelhood Report and Youden Index Values result:
We have obtained from this combination technique the following results:
The Original Input Data is characterized by their results in which, the step sampling is: first half data as the leaning data, the other half is as the validation. For as threshold of 0.5, we find this result:
-Sensitivity Se = 0.4444. - Specificity Sp = 0.8307.
-LR+ = 2.59. - LR- = 0.67. and - YI = 0.2751.
The step sampling is the first 2/3 of data, it is used as leaning data, the other 1/3 of data is for the validation and at the same threshold:
- Sensitivity Se = 0.7286. - Specificity Sp = 0.2581.
- LR+ = 0.98. - LR- = 1.052. - IY = -0.0133.
Conclusion
The data is strongly correlated, and the principal component number can be reduced to a single component (axis_1). The result is the impossibility of defining a mathematical model, because all the inertia (variability) is carried by a single principal component (component_1), The inertia is carried by only the axis_1 (CP1). The complete analysis of this data stops there, no need to continue the treatment thus saving time for the user. Only axis 1 is representative, thus suggesting the existence of a single group with common characteristics. Discrimination is almost impossible. It can therefore be deduced from the obtained results that these transcriptomic data do not allow obtaining a model that discriminates in the absolute sense, consequently, these data are not exploitable. It therefore appears that these data are highly correlated indicating a single group of individuals whose variance is practically collinear with axis 1 and more or less representative since cos2 is less than or equal to 1. Analysis of LR+/- indicates a low informative contribution in terms of diagnostic effectiveness. The YI is far from 1, which means that the informative value of the clinical sign (Pr) is low. Finally, we say that the PCA, the Likelihood Index (report), the Youden Index are powerful tools for biological test’s analysis and interpretation.
References
- DE Birch (1996) Simplified hot start Nature 381(6581): 445-446.
- CA Heid, J Stevens, KJ Livak, PM Williams (1996) Real time quantitative PCR. Genome Res 6: 986-994.
- B Anselme (2015) Biomathématiques : Outils, méthodes et exemples. Sciences Sup Dunod.
- HT Eastment, WJ Krzanowski (1982) Cross-validatory choice of the number of components from a principal component analysis. Technometrics 24:73-77.
- H Hotelling (1933) Analysis of a complex of statistical variables into principal components. J Educational Psychology 24(6): 417-441.
- JV Stone (2004) Independent Component Analysis: A Tutorial Introduction. Cambridge: MIT Press; 2004.
- S Everitt (2002) The Cambridge Dictionary of Statistics.
- JE Jackson (1991) A User’s Guide to Principal Components. New York: John Wiley & Sons.
- JB Kruskal (1978) Factor analysis and principal component analysis: Bilinear methods. In: WH. Kruskal, JM. Tannur eds. International Encyclopedia of Statistics. New York: The Free Press PP: 307-330.
- PA Cornillon, F Husson, A Guyader, N Jegou, J Josse, et al. (2012) Statistiques avec R (3rd Edition), Presses Universitaires de Rennes, France.
- M Bardos (2001) Analyse Discriminante Application au risque et scoring financier, Dunod.
- F Habibzadeh, P Habibzadeh (2019) The likelihood ratio and its graphical representation. Biochem Med 29(2): 193-199.
- CL Lebart, M Piron, A Morineau (2006) Statistique exploratoire multidimensionnelles. 4ème Edition. Visualisation et inférence en fouille de donné Collection: Sciences Sup, Dunod.
- S McGee (2002) Simplifying likelihood ratios. J Gen Intern Med 17(8): 646-659.
- M Nendaz, AA Perrier (2004) Sensibilité, spécificité, valeur prédictive positive et valeur prédictive négative d’un test diagnostique. Rev Mal Respir 21(2): 390-393.
- MR Nendaz, AA Perrier (2002) Etude de validation d’un test diagnostique: un guide de lecture critique. À propos de la place de la biopsie endo bronchique dans le diagnostic de la sarcoï Rev Mal Respir 19(6): 767-777.
- MW David Powers (2011) Evaluation: From precision, recall and F-measure to ROC, informedness, markedness & correlation. Journal of Machine Learning Technologies. 2(1): 2229-3981.
- MD Steven McGee (2002) Likelihood Ratios. Journal of General Internal Medecine 17(8): 647-650.
- JR Thornbury, DG Fryback, W Edwards (1975) Likelihood ratios as a measure of the diagnostic usefulness of excretory urogram information. Radiology 114(3): 561-565.
- H Delacour, N François, A Servonnet, A Gentile, B Roche (2009) Immuno-analyse & Biologie Spécialisée. Elsevier 24(2): 92-99.
- EF Schisterman, NJ Perkins, A Liu, H Bondell (2005) Optimal cut-point and its corresponding Youden Index to discriminate individuals using pooled blood samples. Epidemiology 16(1): 73-81.
-

This work is licensed under a Creative Commons Attribution-NonCommercial 4.0 International License.