 Research Article
Classification of cancer cell lines on their radiosensitivity by machine learning
Majd Wannouss, Gleb G. Golyshev, Alexey N. Goltsov*
Department of Biocybernetics systems and technology, Institute for Artificial Intelligence, Russian Technological University (MIREA), Moscow, Russia
Alexey N. Goltsov, Department of Biocybernetics systems and technology, Institute for Artificial Intelligence, Russian Technological University (MIREA), 78 Vernadsky Avenue, Moscow, 119454, Russia.
Received Date:April 21, 2023; Published Date:May 16, 2023
Abstract
The outcomes of radiotherapy (RT) of cancer patients significantly depend on the radiosensitivity of tumor to ionizing radiation. The degree of radiosensitivity (RS) and radioresistance (RR) of the tumor is clinical predictor of the therapeutic responce of oncopatients to RT and should be considered as a key factor in RT treatment planning in defining the delivered dose, fractionation, and the duration of the RT course. In this work, we developed a method for determining cancer cell RS/RR based on the analysis of experimental data on clonogenic survival of cancer cells using machine learning. A combination of the clustering methods with the principal component analysis was applied to discriminate clusters of RS and RR cancer cells using parameters of dose dependencies of cancer cell survival. Based on the obtained results, a statistical model was developed and trained on a dataset of experimental data and was successfully validated to determine the radiosensitive and radioresistance cancer cells.
Keywords:Radiotherapy; Radioresistance; Ionizing radiation; Clonogenic survival analysis; Classification; Machine learning
Introduction
In recent decades, the significant progress in radiotherapy (RT) in oncological patients has been made thanks to the rapid development and implementation of the new radiosurgical methods and radiotherapy equipment with high-quality ionizing beams, precision methods of dose delivery to the target volume, and the use of optimal RT plans. All this led to increasing effectiveness of RT by achieving its main goal - to maximize the accuracy of the beam delivery and minimize the dose load on critical organs and healthy tissues in order to reduce the risk of acute post-radiation complications [1]. However, there remains a problem of high variability in the responses of individual patients to RT, which poses the challenge of short- and long-term prognostics of the treatment outcomes. As radiobiological and clinical studies have shown, RT results significantly depend on the radiosensitivity (RS) of cancer cells of oncology patients to ionizing radiation (IR). It has been found that cancer cells have a wide range of radiosensitivity, which can vary from high radiosensitivity with high contrast to radiosensitivity of healthy cells to low radiosensitivity up to radioresistance (RR) [2]. It has been established that the RS of cancer cells depends not only on the dose of IR but also on the cancer cell’s ability to adaptation to IR, in particular, by repairing damaged DNA when exposed to IR. The therapeutic response of tumor to RT depends on many factors, which requires optimization of the delivered dose, the number of fractions, and the duration of the RT course for each patient, as well as the inclusion of molecular and genetic diagnostic methods for prognostic estimation of RT results. In this direction, the use of machine learning (ML) and artificial intelligence for prediction of treatment outcomes is the promising way to further development of the personalized and precision RT [3].
In this work, we developed a computational method for determination of the radiosensitivity of cancer cells based on the analysis of clonogenic survival data using machine learning. The method consists in clustering the characteristics of cancer cells in order to determine clusters of RS and RR cancer cells.
Methods
To determine the parameters of cell survival under radiation, the experimental dose dependence data were approximated by the linear-quadratic (LQ) model commonly used in radiobiology [4]. In the process of training of the developed ML model, we used a dataset of published experimental data on 35 cancer cell lines [5-14] and non-cancerous cell HPDE (immortal human pancreatic duct epithelial cell line) [14] (Table 1). The dataset included RS cell lines like Capan-2, Dan-G [14], MCF-7, ZR-751 [15] as well as RR cell lines like suit-2 007, patu-8998T, HPDE [14], BT-20 [15] and others.

The experimental dose dependencies of cell survival were approximated using the equation of the linear-quadratic (LQ) model [4] which is commonly used in radiobiology to describe damaging effects of IR and to develop RT plan in radiotherapy [16]. In the LQ model, dependence of the survival fraction (SF) of cellular clones on the radiation dose D is defined by the equation: SF(D)=S0e-(αD +βD) , where α and β – parameters characterize the cell’s radiosensitivity. Parameter α reflects probability of lethal damages of cellular DNA by IR, while parameter β relates to sublethal DNA damages which can be repaired by cellular reparation mechanism. Radiosensitivity of cancer cells is characterized by the steepness of a survival curve (Figure1) and is generally defined by a ratio α/β. Radiosensitive cells exhibit a high α/β ratio and show a steep survival curve, while radioresistant cells or cells with the weak radiosensitivity show a low α/β ratio and their survival curves possess a pronounced curvature. The equation of survival fraction SF(D) of the LQ model was applied to fit experimental data on clonogenic survival of 36 cell lines and define parameters α and β which were then used in clustering of RS and RR cell lines.
Taking into account the high variability of α/β ratio for cancer cells, the clustering method was used together with the principal component analysis (PCA) in order to separate RF and RR cells according to α and β values [14]. The PCA method is meant for reducing the dimension of the dataset by projecting it into a lower- dimensional sub-space of principal components (PC) [17]. In addition, it is used to increase the diversity of the dataset features, because the first axis of the PC is constructed to hold the most variance of the data and the next PCs are chosen orthogonal to the last to capture the rest of variance of the data. The construction of the PC system is reduced to the diagonalization of the covariance matrix cov Cij = (Xi Xj) , where i X (i=1, 2, 3, ... n) – a vector of n observations of the dataset under investigation. An orthogonal transformation of vector i X to the principal components i Z consists in its projection into PC axes: Z = AX T , where А is a transformation matrix which contains the eigenvectors of the matrix C in its columns.
The PCA was used in the combination with k-means clustering method [14]. The statistical model was developed in the Python programming language (version 3.10.2) using the Python machine learning library sklearn (scikit-learn.org).
Results and discussion
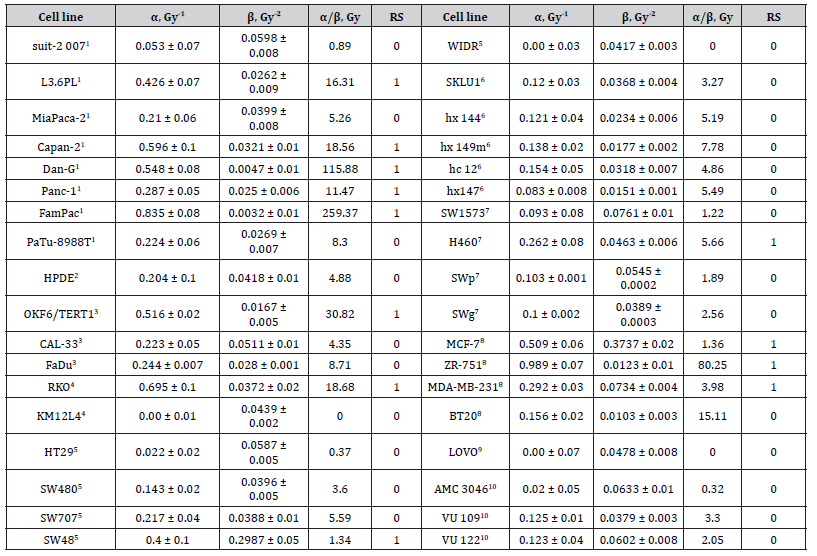
The theoretical dose-response curves together with experimental data are presented in Figure 1. The parameters α, β and a ratio α/β for the cell lines are given in Table 1. As seen, the LQ model satisfactorily describes the experimental dose-response curves that is quantitatively characterized by a high coefficient of determination R2 (see Table 1). Calculations showed that the α/β ratio for the selected set of cells range widely from 0. Gy to 261 Gy that corroborate the high variability of the radiosensitivity of cancer cells. In particular, high α/β values were obtained for the radiosensitive cells Dan-G and FamPac of pancreatic cancer, OKF6/TERT1 of squamous cell carcinoma, RKO of colon cancer, and ZR-751 of breast cancer (see Table 1).
Table 1:Parameters α and β of LQ model, α/β ratio, coefficient of determination R2. RS cells are marked, and rasiosensitivity of cells RS (1 – radiosensitive and 0 – radioresistant cells)

1human pancreatic cancer, 2immortal human pancreatic duct epithelial cell line, 3squamous cell carcinoma, colon cancer, 5adenocarcinoma of the colon,6adenocarcinoma lung cancer, 7epithelial lung cancer, 8breast cancer, 9human colorectal carcinoma, 10glioblastoma
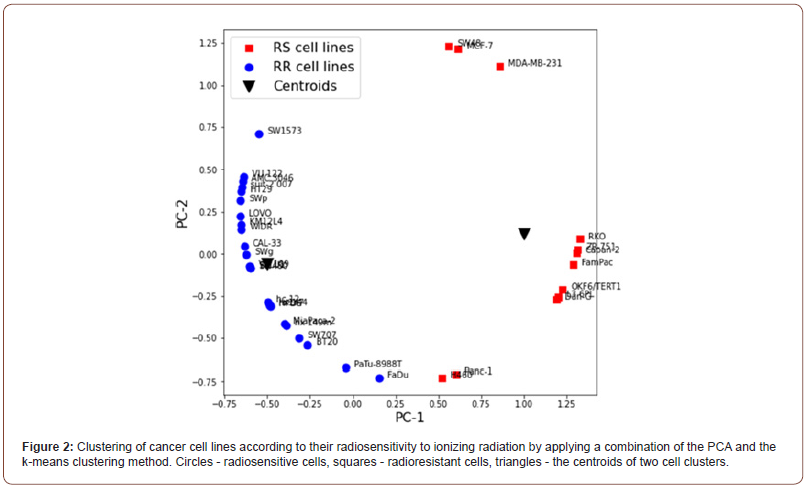
The principal component analysis (PCA) was applied to the set of parameters X1 =α β and X2 =α , which were previously transformed into normalized-centered values by converting them into variables with zero mean and normalizing by dividing them by their variance. After performing the PCA, the k-means clustering method was applied. Figure 2 shows the results of the combination of PCA and k-means clustering of the dataset in the axes of the principal components PC-1 and PC-2, where the obtained PCs of the data were placed on a unit circle by normalization. As seen, the model reproduces two clusters which respectively include radioresistant and radiosensitive cells. The predicted radiosensitivity (RS) of all the cells is given in Table 1. According to the clustering results, cells Capan-2, Dan-G (human pancreatic cancer), MCF-7, ZR-751 (breast cancer), SW48 (lung cancer) were classified as RS cells. Otherwise, cells hx 144, hx149m, hc 12 (lung cancer), AMC 3046, VU 109, VU 122 (glioblastoma), HPDE (non-cancerogenous immortal human pancreatic duct epithelial cell), suit-2 007, PaTu-8988T (human pancreatic cancer), and BT20 (breast cancer) were classified as RR cells. The prediction of RS of these cell lines made by the developed model agreed well with experimental data of RS of different cancer cells [14,18].

To validate the developed model, we used the new dataset of parameters α/β and α of cells which were not included in the model’s training dataset. The transformation of vector (α/β, α) to the principal components PC-1 and PC-2 by matrix A Allowed for the correct classification of the new set of cells according to their radiosensitivity.

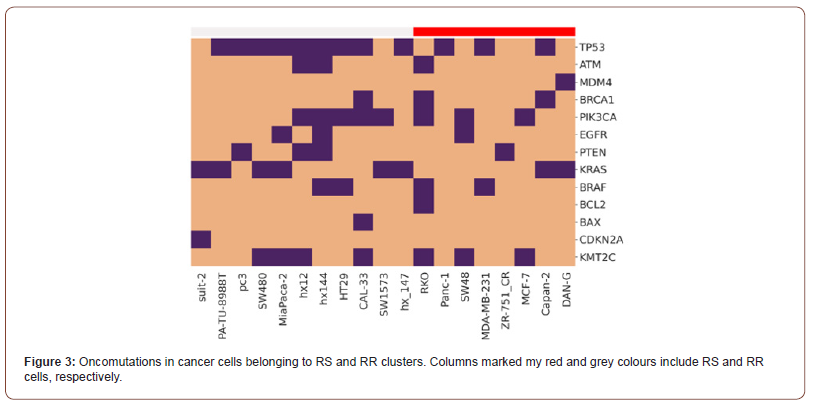
To investigate association between genetic alteration and radioresistance of the selected cancer cells, we performed bioinformatics analysis of the mutations in cancer cells belonging to the RS and RR clusters. Gene data were derived from the mutation databases COSMIC (sanger.ac), GeneCards (www.genecards.org ) and DepMap (depmap.org). The heatmap in Figure 3 shows mutations in the genes coding proteins of the key cellular signaling pathways which are responsible for 1) repair of DNA damage (TP53, ATM, BRCA1 genes, etc.); 2) cell proliferation (EGFR, PTEN, PI3K, BRAF, etc.), and 3) apoptosis (BCL, BAX, etc.) [7]. As established previously the listed mutations are responsible for the occurrence of radioresistance in RT patients [4]. Today the systems extensive investigation directs to reveal a link between the radiosensitivity/ radioresistance of cancer cells and the activity of these signalling pathways in order to develop prognostics biomarkes of the therapeutic response of individual patients to RT [19].
Conclusion
The statistical model for classifying radiosensitive and radioresistant cancer cell lines was developed and trained on a dataset of experimental data on clonogenic survival under ionizing radiation. The model validation showed that the clustering method satisfactorily classifies cells according to their radiosensitivity. Application of the proposed model to classify the radiosensitivity of cancer cells and determination of radioresistant cell lines can be used to define the total doses, fractionation doses, and fractionation schedules in optimal radiotherapy treatment plans in personalized therapy. The further development of the model aims at increasing training dataset of cancer cells and the extension of the model to the analysis of radiosensitivity of heterogeneous tumors.
Acknowledgement
None.
Conflict of Interest
The authors declare no conflict of interest.
References
- Schaue D, Mc Bride WH (2015) Opportunities and Challenges of Radiotherapy for Treating Cancer. Nature Reviews Clinical Oncology 12(9): 527-540.
- Sven de Mey, Dufait I, De Ridder M (2021) Radioresistance of Human Cancers: Clinical Implications of Genetic Expression Signatures. Frontiers in Oncology 11: 761901.
- Huynh E, Hosny A, Guthier C, Bitterman DS, Petit SF, et al. (2020) Artificial Intelligence in Radiation Oncology. Nature Reviews Clinical Oncology 17(12): 771-781.
- Fowler J F (1989) The Linear-Quadratic Formula and Progress in Fractionated Radiotherapy. Br J Radiol 62(740): 679-694.
- Braselmann H, Michna A, Heß J, Unger K (2015) CFAssay: Statistical Analysis of the Colony Formation Assay. Radiat Oncol 10: 223.
- Brix N, Samaga D, Hennel R, Gehr K, Zitzelsberger H, et al. (2020) The Clonogenic Assay: Robustness of Plating Efficiency-Based Analysis Is Strongly Compromised by Cellular Cooperation. Radiat Oncol 15(1): 248.
- Dunne AL, Price ME, Mothersill C, McKeown SR, Robson T, et al. (2003) Relationship between Clonogenic Radiosensitivity, Radiation-Induced Apoptosis and DNA Damage/Repair in Human Colon Cancer Cells. Br J Cancer 89(12): 2277-2283.
- Franken NAP, Oei AL, Kok HP, Rodermond HM, Sminia P, et al. (2013) Cell Survival and Radiosensitisation: Modulation of the Linear and Quadratic Parameters of the LQ Model. International Journal of Oncology 42(5): 1501-1515.
- Gray M, Turnbull AK, Ward C, Meehan J, Martínez-Pérez C, et al. (2019) Development and Characterisation of Acquired Radioresistant Breast Cancer Cell Lines. Radiat Oncol 14(1): 64.
- Li S, Miyamoto C, Wang B, Giaddui T, Micaily B, et al. (2021) A Unified Multi‐activation (UMA) Model of Cell Survival Curves over the Entire Dose Range for Calculating Equivalent Doses in Stereotactic Body Radiation Therapy (SBRT), High Dose Rate Brachytherapy (HDRB), and Stereotactic Radiosurgery (SRS). Med. Phys 48(4): 2038-2049.
- Menegakis A, Yaromina A, Eicheler W, Dorfler A, Beuthien-Baumann B, et al. (2009) Prediction of Clonogenic Cell Survival Curves Based on the Number of Residual DNA Double Strand Breaks Measured by ΓH2AX Staining. International Journal of Radiation Biology 85(11): 1032-1041.
- Park C, Papiez L, Zhang S, Story M, Timmerman RD, et al. (2008) Universal Survival Curve and Single Fraction Equivalent Dose: Useful Tools in Understanding Potency of Ablative Radiotherapy. International Journal of Radiation Oncology Biology Physics 70(3): 847-852.
- Russo SM, Tepper JE, Baldwin AS, Liu R, Adams J, et al. (2001) Enhancement of Radiosensitivity by Proteasome Inhibition: Implications for a Role of NF-ΚB. International Journal of Radiation Oncology Biology Physics 50(1): 183-193.
- Unkel S, Belka C, Lauber K (2016) On the Analysis of Clonogenic Survival Data: Statistical Alternatives to the Linear-Quadratic Model. Radiat Oncol 11: 11.
- Speers C, Zhao S, Liu M, Bartelink H, Pierce LJ, et al. (2015) Development and Validation of a Novel Radiosensitivity Signature in Human Breast Cancer. Clinical Cancer Research 21(26): 3667-3677.
- McMahon S J (2018) The Linear Quadratic Model: Usage, Interpretation and Challenges. Phys Med Biol 64(1): 01TR01.
- Jolliffe IT, Cadima J (2016) Principal Component Analysis: A Review and Recent Developments. Philos Trans A Math Phys Eng Sci 374(2065): 20150202.
- Corey Speers, Shuang Zhao, Meilan Liu, Harry Bartelink, Lori J Pierce, et al. (2015) Development and Validation of a Novel Radiosensitivity Signature in Human Breast Cancer. Clin Cancer Res 21(16): 3667-3677.
- Meehan J, Gray M, Martínez-Pérez C, Kay C, Pang L Y, et al. (2020) Precision Medicine and the Role of Biomarkers of Radiotherapy Response in Breast Cancer. Front Oncol 10: 628.
-
Majd Wannouss, Gleb G. Golyshev, Alexey N. Goltsov*. Classification of cancer cell lines on their radiosensitivity by machine learning. Annal Biostat & Biomed Appli. 5(2): 2023. ABBA.MS.ID.000609.
Radiotherapy, Radioresistance, Ionizing radiation, Clonogenic survival analysis, Classification, Machine learning
-

This work is licensed under a Creative Commons Attribution-NonCommercial 4.0 International License.


