 Research Article
Pattern Electroretinogram as an Objective Measure of Contrast Sensitivity in Diffractive Multifocal Intraocular Lenses
Anne Irvine, Jack Tian, Kirsten Anderson, Benjamin Rostami, Jeffrey Show Tran, Stuart G Coupland, Alfredo A Sadun, Kenneth Lu* and Rustum Karanjia
Department of Ophthalmology, University of California Los Angeles, USA
Kenneth Lu, Department of Ophthalmology, University of California Los Angeles, USA.
Received Date: August 07, 2019; Published Date: August 14, 2019
Abstract
Purpose: Traditionally, contrast sensitivity (CS) has been an important component of vision measured by subjective in-office testing that can be qualitatively, but not quantitatively analyzed without introduction of patient biases such as motivation, effort and capacity to focus. Alternatively, Pattern Electroretinogram (PERG) provides objective, quantifiable changes in waveform amplitudes that are generated as the final common pathway of visual processing. It is less influenced by subject bias. In this study, we have developed and validated methodology to use N95 waveform amplitudes generated by PERG as a tool to objectively measure CS. We then applied this methodology to a second experiment to quantify changes in CS in young healthy eyes induced by an ex-vivo lens system which incorporated different intraocular lenses (IOL). This allowed us to objectively measure CS changes induced by different IOLs.
Methods: Five young healthy subjects with best corrected visual acuities of at least 20/20 were recruited for this study. The pERGs were recorded using an ISCEV compliant protocol at 7 different spatial frequencies across 7 contrast intensities. The N95 amplitude and the contrast intensity at which the N95 amplitude was 50% on maximal was determined for each subject (termed contrast threshold (CT)). The effects of IOLs were determined using an ex-vivo lens system using four different experimental paradigms. The N95 was again measured and statistically analyzed was preformed using SATA.
Results: Pattern ERG as a measure of CS: There was a linear decrease in the N95 amplitude as contrast intensity decreased, and across all CPD/ spatial frequency trials. In all subjects CT increased between 0.125 and 0.25 CPD and subsequently decreased until 5 CPD. This CT curve mirrored classical contrast by logarithmic VA and normalized contrast sensitivity by CPD curves that mirror the increasing, followed by decreasing CSF at increasing spatial frequencies. CS and Intra-Ocular Lenses: As the percent contrast increased the N95 amplitude increased as well and the highest amplitude was recorded with no IOL or lens system in place (Paradigm 1). There was a significant decrease in the N95 progressing from no lens system to the custom trial lens system (Paradigm 1 v 2; p <0.0001) There was however no further reduction in the N95 amplitude by placing a neutralized monofocal lens in the lens system (Paradigm 2 v 3; p>0.05). Importantly there was a significant decrease in the N95 amplitude when the multifocal IOL was placed (Paradigm 4) when compared to the other three paradigms (Paradigm 1 v 4; p<0.0001, Paradigm 2 v 4; p<0.0001; Paradigm 3 v 4; p<0.0005).
Conclusion: Contrast sensitivity can be measured by pERG and this provides an objective way to measure the effects on contrast by optical devices.
Introduction
Traditional contrast sensitivity (CS) testing, the basic form of which has not changed for over a hundred years Moseley MJ & Hill AR [1], relies on patients’ subjective response to stimuli to generate data points. Clinically, CS is typically measured using computerbased software programs such as Freiburg Visual Acuity & Contrast Test (FrACT), or Pelle-Robson charts. After data points are acquired, they can be quantified and analyzed statistically, but as the data is subjectively acquired, it can project biases including patient motivation timing and effort. Alternatively, electroretinograms (ERG) provide an objective, quantifiable, electrical amplitude from the eye in response to stimulation. Typically, two types of stimuli are used, flash and pattern. Pattern stimuli allow for alterations in both contrast and special resolution independently and thus provides the ideal stimulus for testing contrast sensitivity at different spatial resolutions. In the first piece of this study, we demonstrate an objective method of measuring contrast sensitivity using pattern electroretinogram (pERG) to quantify the electrical potential generated by the retinal ganglion cells (RGCs) in response to varying levels of contrast. The output of RGCs corresponds to the final common pathway for visual output from the eye and thus this signal, as opposed to visual evoked potentials is unfiltered and free from post ocular processing. There is a growing body of literature that suggesting that the use of premium, multifocal intraocular lenses (IOLs) has a negative effect on CS, resulting in patient dissatisfaction despite improvement in visual acuity [2-6]. There is, however, no objective method to validate subjective patientreported outcomes. In the present study, we used our methodology for assessing CS with pERG to determine the effects, of monofocal, and diffractive multifocal IOLs have on contrast sensitivity.
Materials and Methods
Five normal subjects (mean age 25) with no known eye disease and a best corrected visual acuity of 20/20 were selected for this study. Informed consent was obtained, and the study was approved by the Institutional Ethics Board of UCLA, in accordance with the Declaration of Helsinki (World Medical Association, 2000) for the use of human subjects in biomedical research.
Pattern ERG as a measure of CS
The pERGs were recorded using an Espion Electrophysiology System (Diagnosys, Lowell, Massachusetts). The stimuli were generated on a CRT monitor (SONY GDM-5402, Tokyo, Japan) with a mean stimulus luminance of 50 cd/m2. Seven different horizontal bar grating designs were projected at 0.125, 0.25, 0.75, 1, 2, and 5 cycles per degree at seven different contrast levels (100%, 95%, 90%, 85%, 80%, 75%, 70%). The pERG was recorded with DTL electrodes (Diagnosys, Lowell, Massachusetts) placed at the lower limbus of the right eye. Topical anesthesia (0.5% proparacaine hydrochloride, Alcon, Fort Worth, TX, USA) and artificial tears were used for patient comfort. The active electrode was referenced to the ipsilateral lateral canthi, and a Fz ground electrode. Electrical impedance was found to be less than 5 kΩ for all electrodes. Subjects were instructed to blink normally during recording. Sweep length was 650 msec. and 200 artifact free sweeps per cpd and contrast were collected. Excursions exceeding 40 μV were automatically rejected as artifact. The n35, p50 n95 components of the pERG were automatically identified by the software.
CS and intra-ocular lenses
The effects of monofocal and multifocal lenses on the N95 component of the PERG were evaluated. One control group and three experimental paradigms with the following characteristics were created:
1. No IOL or trial lenses between the monitor and the eye
2. Plano trial lens only
3. Monofocal IOL and neutralizing trial lenses
4. Diffractive multifocal IOL and neutralizing trial lenses.
The monofocal or diffractive multifocal were mounted in balanced salt solution in the center of a custom lens system and the power of the IOL was neutralized by the lens system. Each subject was refracted to 20/20 with trial lenses as part of the lens system. A 0.75 cpd stimulus was used, as this would negate any residual refractive error. All subjects had 20/20 or better visual acuity with the lens system in place.
Data analysis
Data was analyzed using STATA (StataCorp LLC, TX, USA), and an analysis of variance was used to evaluate contrast percentage, lens, and N95 waveform amplitude. A paired students’ t-test with equal variance was used to compare difference between lenses across all contrast percentages. Analysis of combined variables was done using an ANOVA. The contrast threshold (CT), defined as the contrast percentage corresponding to half maximal N95 amplitude, was also determined for each CPD.
Results
PERG as an objective measure of CS
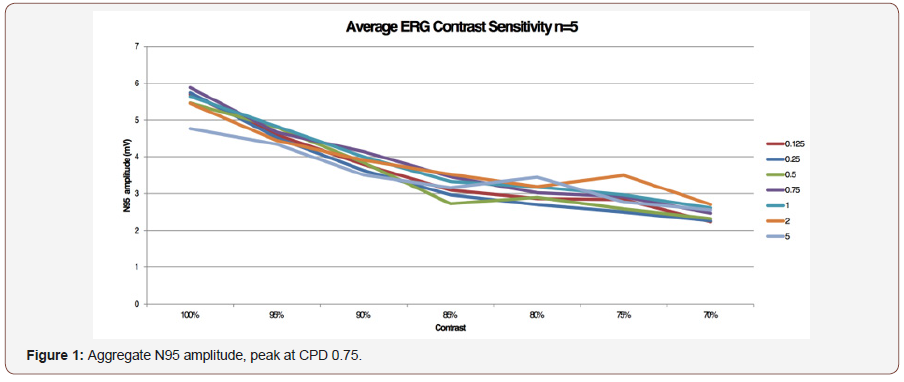
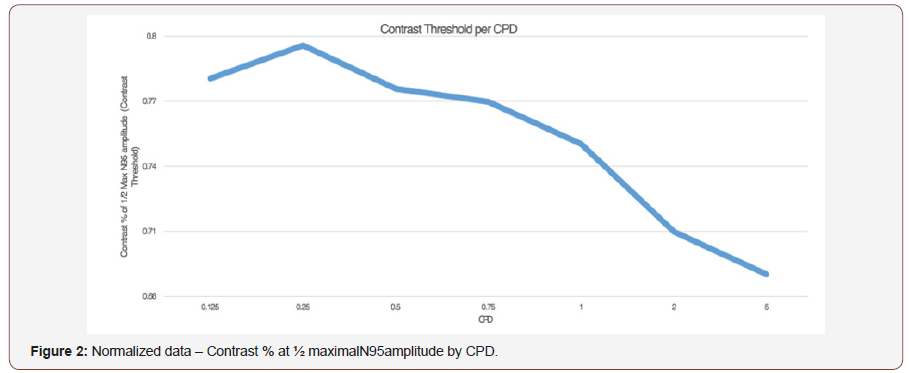
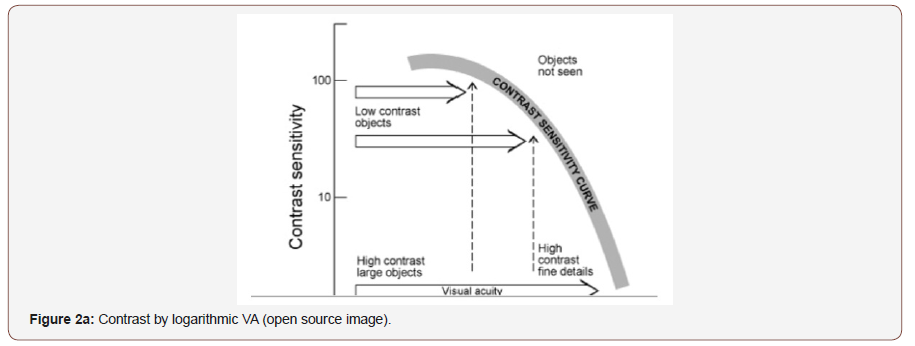
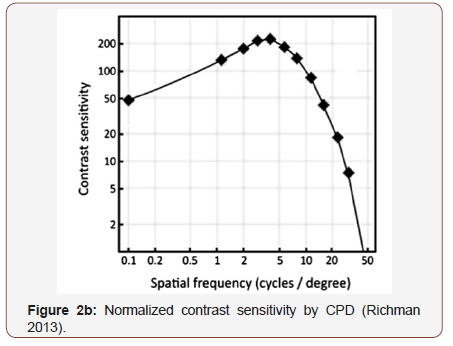
To validate PERG as an objective measure of contrast sensitivity, subjects were tested over contrasts ranging from 70%-100% and across 0.25-5 CPD. The amplitude of N95 waveform for the five study subjects, whether analyzed individually or as an aggregate, revealed a linear decrease in amplitude as contrast intensity decreased from 100% to 70% across each CPD (average = table 1, individuals – table 2a-2e). When data was analyzed in aggregate, peak N95 amplitude was noted at 0.75 CPD across all contrast sensitivities (Figure 1). When CT was graphed against CPD, CT was noted to increase between 0.125 and 0.25 CPD and subsequently decrease as the CPD increased to maximum tested 5 CPD (Figure 2). This CT curve corresponds closely to both contrast by logarithmic VA (Figure 2a) and normalized classic contrast sensitivity by CPD curves (Figure 2b) that mirror the increasing, followed by decreasing CSF at increasing spatial frequencies (Figure 1, 2, 2a&2b).
The effect of IOLs on CS as measured by PERG
Using the above data as proof of concept, we then applied the PERG methodology to test for potential alterations in CS induced by our custom ex-vivo lens system, held in front of the young healthy eyes. At fixed 0.75 CPD, the N95 amplitude was recorded across CS 75-100% for each individual and analyzed in aggregate form. As the percent contrast increased, the N95 amplitude increased as well and the highest amplitude was recorded with no IOL or lens system in place (Paradigm 1). There was a significant decrease in the N95 progressing from no lens system to the plano lens system (Paradigm 1 v 2; p <0.0001) There was however no further significant reduction in the N95 amplitude by placing the monofocal lens in the lens system (Paradigm 2 v 3; p>0.05). Importantly there was a significant decrease in the N95 when the multifocal IOL was placed (Paradigm 4) when compared to the other three paradigms (Paradigm 1 v 4; p<0.0001, Paradigm 2 v 4; p<0.0001; Paradigm 3 v 4; p<0.0005). Individual subject level data mirrored the aggregate data and is shown in supplemental Figure 1 and supplemental Table 1a-1e. Aggregate analysis of lens type, percent contrast and N95 amplitude was done using an ANOVA. By changing the IOL (p<0.0001), or changing the contrast (P<0.0001), a statistically significant difference was noted in N95 amplitude. Looking at the change to N95 amplitude by way of changing both IOL + contrast (p=0.0198), the difference was not noted to be statistically significant (supplemental Figure 1) (Table 1, Supplemental Table 1a-1e, 2a-2e, 3).
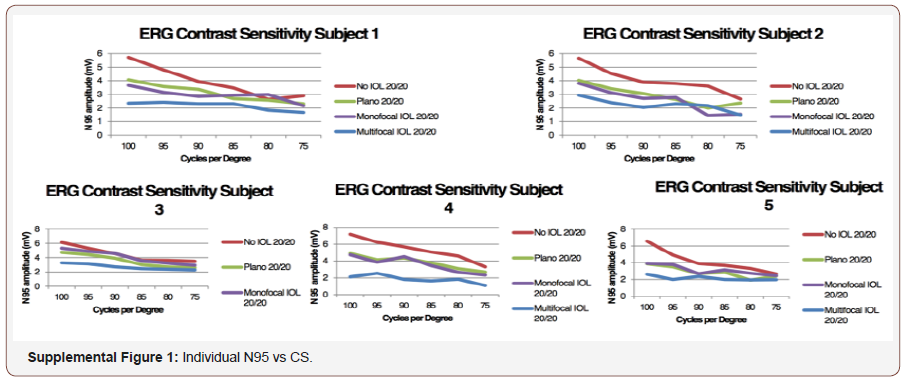
Table 1: Average of 5 subjects.

Supplemental Table 1a: Subject 1.

Supplemental Table 1b: Subject 2.

Supplemental Table 1c: Subject 3.

Supplemental Table 1d: Subject 4.

Supplemental Table 1e: Subject 5.

Table2a: Subject 1 JT.

Table 2b: Subject 2 AS.

Table 2c: Subject 3 KTK.

Table 2d: Subject 4 AL

Table 2e: Subject 5 AI.

Table 3: Aggregate N95 amplitude across decreasing CS at 0.75 CPD.

Discussion
To our knowledge this is the first study to use PERG as an objective measure of contrast sensitivity. The N95 waveform amplitude decreased from high to low contrast for each subject, as we expected, representing decreased signal from the RGCs. We found that using the CT technique of half maximal N95 amplitude to determine the threshold for each CPD produced a contrast sensitivity function curve similar to those reported for subjective contrast sensitivity testing modalities Figure 1, Figure 2a&2b. We opted to record the PERG as opposed visual evoked potentials which could be recorded using the same testing paradigm because PERG looks at the final common output from the eye and avoids any post ocular processing that may take place. Looking at the PERG amplitude gives us a measure of the electrical activity sent to the brain from the eye. We then applied this testing modality to look at the effects of multifocal IOLs on the electrical output to the optic nerve [7,8] (Figure 3&3a).
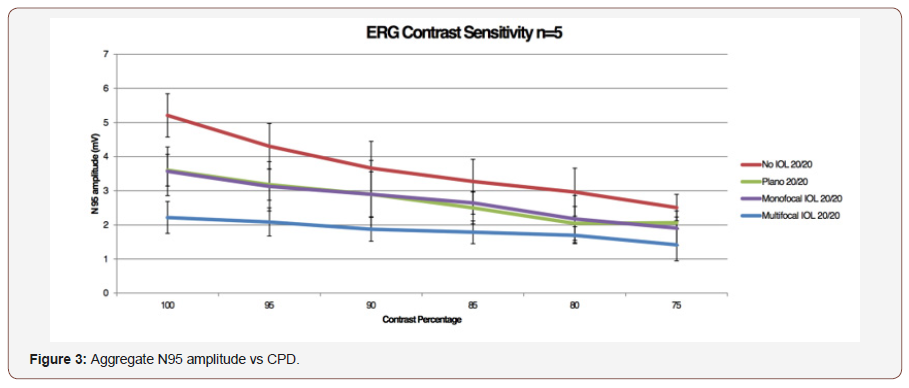
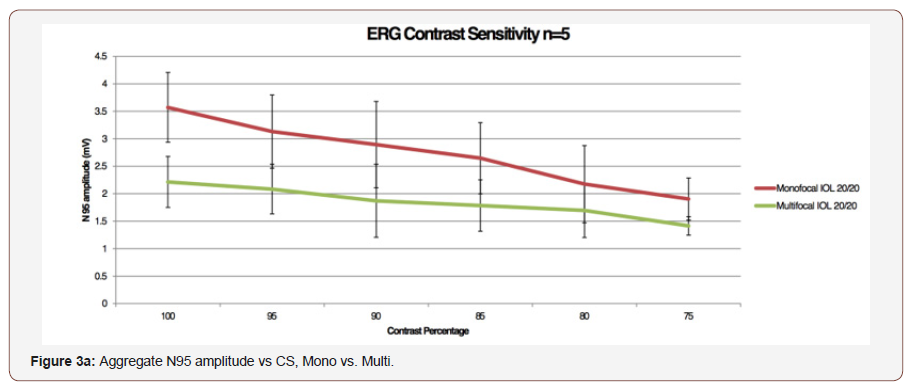
As expected, the largest N95 amplitude was seen with no external lens impeding light pathway. The lens system alone (paradigm 2), did significantly reduced the N95 amplitude (p = 0.0001), though there was no further reduction in the N95 amplitude with the addition of a monofocal IOL (Paradigm 3; p = 0.05064). Importantly, the addition of the diffractive multifocal IOL (Paradigm 4) resulted in a decreased in N95 amplitude by nearly 50% across all contrast sensitivities. This demonstrates that while signal is lost through the ex-vivo lens system, the monofocal IOL did not further degrade the signal, yet the multifocal IOL did. This decrease in amplitude was statistically significant despite the low number of subjects. Decreases in contrast sensitivity from multifocal IOLs as measured by subjective tests has been well established in the literature and may be an accepted consequence of multifocal IOLs by the refractive surgery community [2-6]. What is not readily apparent, however, is how to quantify the decrease in contrast sensitivity evoked by these lenses as measured by commonly employed online tests because the degree of ‘guessing’ by each patient involved cannot be measured. In an area of controversy, such as CS loss with multifocal IOLs, having additional objectivity should be important. In our testing methodology, pERG testing parameters are standardized across all subjects, and the electrical potential generated is an average of over a reproducible hundred measurements. Using an ISCEV standard protocol we were able to isolate the response from RGCs and generate a reproducible electrical amplitude that is not influenced by patients’ test-taking ability or motivation. Traditional subjective measures of CSF are less labor intensive and costly when compared to our PERG testing modality. However, our system provides objective, quantifiable results which can be useful in certain clinical scenarios such as during drug development and clinical trials were truly objective data is valued. We performed our exams on young, healthy eyes and found that our data was like well-established CS curves. PERG has not yet been validated as a measure of CSF over multiple age groups and pathologies, though it would follow that as it consistently measures RGC function, it is a reliable tool despite a test subject’s underlying pathologies. Limitations of this testing modality beyond access to the equipment and having trained technicians to perform test include the long duration of the testing protocol. While this can be tailored to specifically look at fewer contrasts or CPDs the test is still time consuming. Our findings demonstrate that PERG can be a useful tool to objectively evaluate and monitor CSF in the appropriate research or clinical scenario. We anticipate that this method will also be able to objectively quantify the effect on contrast by different types of IOLs.
Acknowledgment
None.
Conflicts of Interest
No conflicts of interest.
References
- Moseley MJ, Hill AR (1994) Contrast sensitivity testing in clinical practice. Br J Ophthalmol 78(10): 795-797.
- Peng C, Zhao J, Ma L, Qu B, Sun Q, et al. (2012) Optical performance after bilateral implantation of apodized aspheric diffractive multifocal intraocular lenses with +3.00-D addition power. Acta Ophthalmol 90(8): e586-e593.
- Ravalico G, Baccara F, Rinaldi G (1993) Contrast sensitivity in multifocal intraocular lenses. J Cataract Refract Surg 19(1): 22-25.
- Kamiya K, Hayashi K, Shimizu K, Negishi K, Sato M, et al. (2014) Multifocal intraocular lens explantation: a case series of 50 eyes. Am J Ophthalmol 158(2): 215-220.
- Bellucci R (2005) Multifocal intraocular lenses. Curr Opin Ophthalmol 16(1): 33-37.
- Montes Mico R, Alio JL (2003) Distance and near contrast sensitivity function after multifocal intraocular lens implanation. J Cataract Refract Surg 29(4): 703-711.
- De Silva SR, Evans JR, Kirthi V, Ziaei M, Leyland M (2016) Multifocal versus monofocal intraocular lenses after cataract extraction. Cochrane Database Syst Rev 12:CD003169.
- Thompson D, Drasdo N (1989) The effect of stimulus contrast on the latency and amplitude of the pattern electroretinogram. Vision Res 29(3): 309-313.
-
Kenneth Lu, Anne Irvine, Jack Tian, Kirsten Anderson, Benjamin Rostami, et al. Pattern Electroretinogram as an Objective Measure of Contrast Sensitivity in Diffractive Multifocal Intraocular Lenses. W J Opthalmol & Vision Res. 2(3): 2019. WJOVR.MS.ID.000538.
-
Contrast sensitivity, Vision, Capacity to focus, Eyes, Intraocular lenses, Contrast intensity.
-

This work is licensed under a Creative Commons Attribution-NonCommercial 4.0 International License.


