


 Research Article
Macular Edema and AI
Received Date:July 02, 2026; Published Date:July 16, 2026
Abstract
The CDC (CDC Vision and Eye Health Surveillance System) reports that about half the people with diabetic retinopathy, DR, will develop macular edema and the American Academy of Ophthalmology preferred practice pattern, AAO PPP, state that DME is the most common cause of visual impairment in patients with DR. Neovascular AMD, nAMD, comprises 10-15% of AMD according to AAO PPP, but 80-90% of nAMD is responsible for severe vision loss. On the bright side, 94.6% of patients receiving monthly intravitreal anti-VEGF injections have less than a 15-letter loss at 12 months compared to 62.2% with sham treatment. (Fleckenstein et al. JAMA 2024, 331(2):147) Regardless of the source of macular edema, diabetes, nAMD, vein or artery complete or branch occlusion, older age, genetic, dietary or environmental factors, the course can be devastating. Changes in retinal blood brain barrier, exudates, retinal thickening, intraretinal fluid, subretinal fluid, sub pigment epithelial fluid, photo receptor disarray, ellipsoid segment drop out, retinal pigment epithelial breakdown and loss and, most important, many of the rescue pathways are lost so that visual loss becomes inevitable. Over the last 40 years substantial research and clinical efforts have attempted to diagnose macula edema and its key features early.
Introduction
To appreciate the scope and depth of the evolutionary path of diagnosing and treating macular edema over the last forty years, a concise clinical feature timeline is first presented in this introduction and a more comprehensive retinal expert table is presented in the first portion of Results in this paper. The first report in 1985 is from the Early Treatment Diabetic Retinopathy Study Group who coined the term “clinically significant macular edema”, CSME, Although the definition of CSME consisted of retinal thickening within 500um of the macular center, hard exudates within 500um of macula center or central zone of thickening greater than or equal to 1 disc area within 1 disc diameter of macula center, eyes meeting any single criterion in this definition had a sufficient risk of vison loss to warrant focal laser treatment [1,2].
2002 Goebel, et al. were the first to correlate OCT-measured central retinal thickness with visual acuity in diabetic retinopathy. 2004 Browning et al illustrated that the OCT, Optical Coherent Tomography, image is more sensitive than stereoscopic slit lamp exam in detecting DME, diabetic macular edema. 2007 Browning et al found that visual acuity improved 4.4 letters for every 100um decrease in central retinal thickness, CRT. 2011 GallegoPinazo et al. demonstrated that SD-OCT (broadband light source and a spectrometer to capture the full interference spectrum of reflected light at once, in contrast to older time-domain OCT (TDOCT), which measured light reflections over time using a moving reference mirror, [Bing, Copilot]) is as safe as FA for guiding laser photocoagulation treatment of DME. Best corrected visual acuity, central macular thickness, and retina volume at baseline and two months after treatment were comparable, SD-OCT to FA treatment groups.
2016 Lee et al. introduced OCT angiography, OCTA, to investigate the superficial capillary plexuses and deep capillary plexuses in patients with DME and its response to anti-VEGF treatment. 2020 Spaide et al in retinal consensus group found that OCT/OCTA findings did not correspond to older FA categories and emphasized anatomic precision over angiographic leakage patterns. However, they did indicate that using OCT and OCTA does not replace FA or color photography but may augment it 2021 Gallardo. Machine Learning Can Predict Anti-VEGF Treatment Demand in a Treatand-Extend Regimen for Patients with Neovascular AMD, DME, and RVO Associated Macular Edema. 2026 Kumawat, et al. introduced the C-Metrical system, which integrates clinical evaluation, OCT imaging, and angiographic findings in DME diagnostics. 2026 Abreu-Gonzalez, et al. Artificial Intelligence Driven Adjusted OCTBased Classification System for Diabetic Macular Edema (AIDME): To develop and validate an adjusted scoring system of DME classification using qualitative and quantitative parameters to improve clinical decisions.
Arriving at the end of the timeline in 2026 brings the reader to Artificial Intelligence Driven Adjusted OCT-Based Classification System for Diabetic Macular Edema (AIDME) with the aggregate of new terminology, parameters, and qualitative and quantitative diagnostic modalities to gain a modern understanding of the diagnosis and management of macular edema. For a full reference guide for each investigator or group and a nuanced individual summary capsule, please refer to Historical Ophthalmologic Definitions in Clinically Significant Macular Edema and their Associated Evolving Diagnostic Tools in the early Results part of this paper. The AI tools for OCT image analysis provide the basis for the recently adopted classification of macular edema gradation as well as a battery of new commercially available technologic tools to quantify: OCT images for central retinal thickness, intraretinal fluid, subretinal fluid, and hyperreflective foci These new clinical OCT AI tools can also track macular edema progression in individual patients. On the FA side of macular edema diagnostics, AI tools have become commercially available to help differentiating DME from other macular disease or identify macular capillary nonperfusion or to explain vison loss not responsive to therapy, widefield peripheral lesions including neovascularization that may not be apparent, central and peripheral retinal blood brain barrier reduction and best corrected visual acuity.
Methods
For the first part of the paper, Historical Macular Edema definitions, diagnostic modalities, and new management, searches were undertaken in Pub Med and Google Scholar as well as Monica, DOX gpt, and Google Gemini for historical papers on macula edema associated with diabetes, macular degeneration, central serous chorioretinopathy and retinal vein occlusion. Studies that used retinal experts for consensus on definitions, new terminology, diagnostic modalities, and new management adaptations were favored. The papers were then tabulated along a chronological timeline for historical perspective. Lead authors and titles were then summarized with their journal sources in the extended table in the early part of the Results portion of this paper with key paper gleanings from retina council expert results.
For the second part of this paper, searches for the use of AI with fluorescein angiography, leakage, macular edema, retinal blood brain barrier, and best corrected visual acuity were done in PubMed, Google scholar, Monica, Doxgpt, and Google gemini; likewise, searches in the above modalities were carried out for AI in macula edema associated with diabetes and or macular degeneration using OCT images to measure central retinal thickness, best corrected visual acuity, retinal layer disruption/ drop out, retinal pigment epithelial detachments, breaks, intra and subretinal fluid, outer and inner retinal layer atrophy.
Results
A. Extended Chronological Macular Edema Table Historical Ophthalmologic Definitions in Clinically Significant Macular Edema, their reference sources and their Associated Evolving Diagnostic Tools Extended table format: Regular type is the background information column; Bold type is the study’s significant contribution to understanding macula edema column
1985,the Early Treatment for Diabetic Macular Edema, (Report Number 1 of the Early Treatment Diabetic Retinopathy Study Research Group) appeared in JAMA Ophthalmology, Vol 103, N 12. Clinically significant macular edema, CSME, was defined as “retinal thickening of at least one disc area, part of which is within one disc diameter of foveal center” (even if the visual acuity is not yet reduced), or “hard exudates within 500um of the foveal center and is assessed by stereo contact lens biomicroscopy or stereo photography”.
1999,Fourteen years after the ETDRS 1985 article, Otani, et al in Am J Ophthalmol, 1999, 127(6):688 reported Patterns of Diabetic Macular Edema with Optical Coherence Tomography. They provided the first tomographic classification of macular edema: “sponge-like retinal swelling, cystoid macular edema, and serous retinal detachment”.
(1961 The first description of Fluorescein Angiography, FA, for retinal vascular disease: Novotny and Alvis, Circulation, 24:82-86; 24 years later ETDRS used FA to define leakage patterns (focal, diffuse, or ischemic for DME) to guide laser photocoagulation; 38 years later OCT became the standard for diagnosing DME. However, in 1986, Arch Ophthalmol, 104(5):694, the Macular Photocoagulation Study Group. Argon Laser Photocoagulation for neovascular maculopathy: 3-year result from randomized clinical trials, had used FA for AMD diagnosis). 2002 Goebel, et al. Retina, 22(6) :759 were the first to correlate OCT-measured central retinal thickness with visual acuity in diabetic retinopathy. 2004 Browning, et al. Ophthalmology, 111(4):712, stereoscopic slit- lamp examination of the fundus, then the standard of care, is less sensitive than OCT for detection of DME. 2007 Browning, et al. Ophthalmology 114(3):525, approximately 4.4 letters of better visual acuity improvement is achieved for every 100 um decrease in central retinal thickness in DME, (measurement on OCT taken from 1mm diameter centered from the fovea) 2008 Browning et al. Ophthalmology 115(8):1366, Preferred DME analysis Methods: High correlation of macula OCT center point thickness with central subfield mean thickness (CSMT), ( 0.98-0.99, AUC), and CSMT is the preferred OCT measurement of central macula; total macular volume may be the preferred metric when central macula is less important; absolute change in retinal thickness is the preferred method in studies involved in eyes with mild macular thickening; relative change in thickening may be preferable when retinal thickening in DME is more severe.
2010 Danis, et al. Retina, 30(10:1627, found that while FA leakage is associated with visual acuity and some OCT and color photographic variables, no unique FA variables had a stronger association with visual acuity than OCT measurement of retinal thickness. 2011 Gallego-Pinazo, et al. Clin Ophthalmol,5:613, demonstrated that SD OCT is as safe as FA for guiding laser photocoagulation treatment of DME. Best corrected visual acuity, central macular thickness, and retina volume at baseline and two months after treatment were comparable, OCT to FA groups.
2015 Virgili, et al. Cochrane Database Syst Rev 7;1(1), systematic review concluded that: Diabetic Macular edema, DMO, is a thickening of the central retina or the macula and is associated with long- term visual loss in people with diabetic retinopathy. Clinically significant macular edema, CSMO, is the most severe form of DMO. ETDRS 30 years prior found that CSMO, diagnosed by stereoscopic fundus photography leads to moderate visual loss in one of four patients within three years. Grid or focal laser photocoagulation to the macula halves this risk. Intravitreal injection of antiangiogenic drugs has also been helpful in improving vision in patients with macular edema due to DR. OCT can image retinal thickness and produce 3-dimensional images of the central retina and provide initial and progressive quantitative assessment of macular edema, unlike subjective fundus biomicroscopic evaluation.
The median central retinal thickness cut off in nine studies providing data on CSMO (759 participants, 1303 eyes) was 250um, pooled sensitivity 0.78 and specificity 0.86. 2016 Lee, et al. Ophthalmology, 123(11):2368, introduced OCT angiography to investigate the superficial capillary plexuses and deep capillary plexuses in patients with DME and its response to anti-VEGF treatment. An anti-VEGF responder was defined by a reduction of more than 50um in central retinal thickness after 3 consecutive anti-VEGF treatments. A poor responder was defined by a reduction of less than 50um or an increase in central retinal thickness after 3 monthly injections. DME eyes had a lower vascular density and larger foveal avascular zone in the deep capillary plexuses and more microaneurysms than non-DME eyes, but there was no significant difference in the superficial capillary plexus between anti-VEGF responders and poor responders. The disrupted portion of the outer plexiform retinal layer on SD- OCT corresponded exactly to the outflow area of the deep capillary plexus on OCTA.
2018 Wong, et al. Ophthalmology 125(10):1608, Guidelines on Diabetic Eye Care: The International Council of Ophthalmology Recommendations for Screening, Follow-up, Referral, and Treatment Based on Resource Settings; Guidelines included laser and intravitreal injection of anti-vascular endothelial growth factor inhibitors and corticosteroids; as well as management during pregnancy and or concomitant cataract. 2020 Spaide et al. Ophthalmology, 127(5):616, A consensus meeting of retina experts defined AMD beginning with Dr Gass’s work from early drusen to neovascular AMD and slightly later work of Blair, 1976, which described geographic atrophy of the retinal pigment epithelium. They concluded that OCT/OCTA findings did not correspond to older FA categories and emphasized anatomic precision over angiographic leakage patterns. However, they did indicate that using OCT and OCTA does not replace FA or color photography but may augment it.
2021 Gallardo, et al. Ophthalmol Retina, 5(7):604 Machine Learning, ML, Can Predict Anti-VEGF Treatment Demand in a Treat-and-Extend Regimen for Patients with Neovascular AMD, DME, and RVO Associated Macular Edema; 377 eyes with nAMD, neovascular AMD, RVO, retinal vein occlusion or DME treated with anti-VEGF agent according to a treat and extend regimen from 2014-2018 were grouped by level of disease, low, moderate, and high treatment demands. Average treatment interval (low, equal to or greater than 10 weeks, high equal to or less than 5 weeks. remaining eyes, moderate). Two random forest models using OCT volumes at baseline and after two consecutive visits along with demographic information were able to predict low and high treatment demand in nAMD, RVO and DME eyes with similar accuracy with AUC of .76 to .79 for the three mentioned diagnostic groups. Thus, ML classifiers may be helpful in predicting treatment classification to establish patient treatment plans. 2023 Channa, et al. Ophthalmol Sci, 4(3):100420, A New Approach to Staging Diabetic Eye Disease: Staging of Diabetic Retinal Neurodegeneration and Diabetic Macular Edema; Experts were used to identify the optimal modalities to identify diabetic retinopathy and DME. The modalities included microperimetry, full-field flash electroretinogram, SD OCT adaptive optics, and OCT angiography. The highest level modality to quantify DME and diabetic retinopathy was OCT. Most of the other modalities will require prospective studies to define their role in management of diabetic retinal disease.
2024 Ramakrishnan, et al. J Vitreoretin Dis, 8(3): 234, American Society of Retina Specialists Clinical Practice Guidelines on Multimodal Imaging for Retinal Disease. retinal vascular disease includes fundus photography, OCT, OCTA, and FA to evaluate macular edema, retinal ischemia and complications of neovascularization. OCT and FAF, fundus autofluorescence play a key role in diagnosing and treating maculopathies; FA, OCTA and ICGA, indocyanine green angiography, can help diagnose macular neovascularization, posterior uveitis and choroidal venous insufficiency. OCT and B-scan ultrasonography can assist with pre-op planning and prognostication in vitreoretinal surgical conditions. 2025 Lim, et al. Ophthalmology, 132(4):75, Diabetic Retinopathy Preferred Practice Pattern® AAO Retina/Vitreous Committee, Although FA is not indicated as a part of the regular exam of patients with diabetes, FA is valuable for: differentiating DME from other macular disease, or for unexplained visual loss, identify macular capillary nonperfusion or to explain vison loss not responsive to therapy, persistent retinal or disc neovascularization after previous scatter laser surgery, widefield peripheral lesions including neovascularization that may not be apparent. OCT is used by clinical trials testing anti-VEGF treatment to follow macular edema with regard to amount and location of retinal thickening; retinal thickness even when measured by OCT is not consistently correlated to visual acuity.
2026 Kumawat, et al. Nature Eye Open,2(2026), after analysis of existing DME classification system proposed the C-Metrical system, which integrates clinical evaluation, OCT imaging, and angiographic findings. By incorporating both qualitative and quantitative measures, including OCT metrics, morphological subtypes, biomarkers, and angiographic features such as focal or diffuse edema and the status of the foveal avascular zone is best ascertained. In addition, the C-Metrical system accounts for diabetic retinopathy severity and systemic comorbidities, including hypertension and nephropathy, which influence treatment choices and prognosis. 2026 Abreu-Gonzalez, et al. Clin Ophthalmol, 19:20:60473, Artificial Intelligence Driven Adjusted OCT-Based Classification System for Diabetic Macular Edema (AIDME); To develop and validate an adjusted scoring system of DME classification using qualitative and quantitative parameters to improve clinical decision making and correlate disease severity with visual outcomes. Key quantitative DME variables included the scoring of retinal thickness, intraretinal fluid, and subretinal fluid along with visual acuity. Qualitative index measurements included: disorganization of retinal inner layers and epiretinal membranes; At 2 points per parameter, the patients were classified according to total score: mild: (0-3), moderate (4-6 points) and severe ((> 7 points). The scoring system showed an AUC of 0.89, illustrating the impact of quantitative fluid accumulation, structural biomarkers***, and visual acuity impairment in DME.
***The European School for Advanced studies in Ophthalmology proposed a new classification system for OCT DME based on the structural biomarkers in this list: 1. hyperreflective foci, 2. Ellipsoid zone disruption, 3. external limiting membrane integrity, 4. intraretinal hyperreflective material, 5. subretinal hyperreflective material, 6. inner nuclear thickening, and 7. epiretinal membranes.
Based on the above, DME was categorized into four subtypes: 1. Early: Cystoid DME with hyperreflective foci; all retinal layers visib(le and intact. 2. Advanced: Multiple Cystoid spaces and macrocysts; retinal layer disorganization, ellipsoid zone, EZ or external limiting membrane may be intact or disrupted on OCT. (The EZ is a critical retinal layer composed of densely packed mitochondria (energy packets) in the inner segments of the photoreceptor cells.) 3. Severe: Macular thickening greater than 30% above normal; advanced structural damage: EZ and or ELM absent, disorganization of retinal inner layers may or may not be present. 4. Atrophic: Extensive disruption of outer and inner retinal layers; macular thickening reduced to <10% of normal values. B. Commercial AI tools for AI image analysis in the clinic
AI tools for OCT image analysis have provided objective and reproducible quantification of key biomarkers in DME and AMD and include: RetInSight R, DeepMind R, MR-DocOphthal R, and ReF-NET; Each AI modality has its own specific capabilities. The RefNet, for example, enables volumetric segmentation of retinal fluid in both OCT and OCT angiography images.
Retinai, (Bern, Switzerland) developed deep learning algorithms that automatically analyze OCT images for central retinal thickness, intraretinal fluid, subretinal fluid, and hyperreflective foci and can track patient progression. [46]. C. AI Techniques in More Recent Macular Edema Investigation
1. AI Role in FA Diagnostic Ability in Macula Edema
In 81 nAMD, eyes and 7 healthy eyes of prospectively recruited patients, over age 50, from a single center in Toronto Canada, between 2017 to 2023, ultra-widefield IVFA, intravenous fluorescein angiogram, images were processed using the AI RETICAD FA assist system. (The RETICAD is an AI tool that generates dye free fluorescein angiograms. This AI tool might also eliminate dye injection, possible discomfort or allergy.) The goal was to accurately quantify information on blood flow, perfusion, and retinal blood brain barrier, RBBB, permeability. On univariable analysis, RBBB permeability centrally measured was highly related to central macula thickness (P<0.001). Central perfusion and blood flow were closely related to macular volume (P = 0.043 and 0.037, respectively). On multivariate analysis RBBB permeability remained significantly associated with central macular thickness (P = 0.026) [3].
Ryan, et al [3] with AI quantitative IVFA, intravenous fluorescein angiography, in nAMD, neovascular AMD, vs normals found higher central RBBB permeability associated with central macula thickness, CMT, even after adjusting for demographic variables such as sex, race, age, and lens status. This graded weakening of the RBBB in nAMD resulted in greater fluid accumulation and retinal thickening, [4] which may be an early diagnostic marker for baseline nAMD diagnosis and potentially aid in considering adjunctive and earlier therapies for n AMD [3]. Along similar lines, to the question of baseline n-AMD evaluation, there is substantial inter-examiner and intra-examiner variability in classifying choroidal neovascularization, CNV, in early n-AMD from fluorescein angiograms [3,5]. AIFA, may be able to establish a more objective baseline of early nAMD severity (and level of CNV) to help reduce the examiner variability and enable clinicians to work from a more standard baseline in individual patients [3]. On the other hand, Ryan, et al [3] in a non-longitudinally designed study were unable to distinguish subretinal from intraretinal fluid leakage with IVFA.
2. Deep Learning CNN Architectures on OCT for Macular Edema
However, Alsaih, et al. [6] using four deep-encoder-decoder neural networks, on SD OCT fluid volumes, segmented three retinal fluids: intraretinal fluid, IRF, subretinal fluid, SRF, and pigment epithelial detachment, PED. (This deep-learning neural network ability to image intra and subretinal fluid presence and provide for clinical follow up analysis, as well as illustrate key retinal layer health or disease, relative to the fluid location, may well be one of the reasons OCT leapfrogged ahead of FA as the new gold standard for diabetes and macular edema diagnosis). Although nAMD is mainly in elderly patients and may derive from several environmental and genetic factors, nAMD (and DME for that matter) are characterized by fluid leakage and vision loss [4-6]. The CNN (networks) used in Alsaih, et al [6] performed slightly better than the human grader level and some of the teams that participated in the training of the data.
Convolutional neural networks, CNN, are deep learning models designed to process images. The layers of the CNN filter input images and without manual feature extraction they automatically detect edges, patterns, and key image features. This technology is effective for image classification, segmentation, object detection and other image content intelligence. The use of image registration has led to increasingly high quality transformational mappings that have significantly improved performance in related processing tasks, such as segmentation via labeled fusion, imaging-based statistical analysis involving template based normalization, algorithmic image classification, better evaluation strategies [7]. Schlegl, et al [8] developed and validated an automated deep learning neural network to detect and quantify IRF and SRF in macular OCT scans from large datasets of eyes presenting with nAMD, DME, and RVO, imaged with Heidelberg Spectralis, and Zeiss Cirrus. Scans were graded for IRF and SRF by two independent experienced retinal specialists from the Vienna Reading Center database. For fluid quantification, datasets for nAMD, DME, and RVO with completed annotations of IRF and SRF from Vienna Reading Center were randomly selected. For each diagnostic category a consistent number of scans, pixel resolution and field of view were used [8]. They used a machine learning technique that maps from OCT images of large amounts of labeled training data so that meaningful abstract representations are achieved. The neural network then following a semantic segmentation approach, maps an input image of a specific size to an image of the same size but with class labels. Thus, there are 2 processing components in the network, an encoder part of the network that transforms the input image to an abstract representation of the image and a decoder that maps the abstract representation to a clinical class image of pixel assignments with normal, IRF or SRF [8].
The encoder is mapped from raw images to abstract representations. No prespecified mathematic descriptions or hand crafted features were used. So, encoder parameters were automatically learned and convolved on the basis of annotated data used during training, (only from raw image embedding step to the association with label input resolution image). Hence the term “low dimensional embedding “of the encoder [8]. The decoder then maps the embedding to a full input resolution label image. Run time e.g. for Cirrus scans was about 70 seconds [8]. Evaluation of pixel-level segmentation for the amount of fluid in AMD, DME, and RVO was done independently for IRF and SRF, using volume-wise automated and manual measurements of the number of fluid pixels per volume. 200 scans per disease per OCT device, i.e., 100 scans with fluid and 100 scans without fluid per group were used. The computations for performance, AUC, were based on ROC curves. For all 3 macular edema pathologies for detection and quantification of IRF, the mean accuracy, AUC was 0.94. For SRF the mean accuracy, AUC was 0.92. Superior performance in nAMD and RVO compared with DME was rarely represented in the population studied. High correlation between automated and manual fluid localization and quantification by Pearson’s correlation coefficient of 0.90 for IRF and 0.96 for SRF was achieved [8].
Returning to Alsaih, et al [6] using RETOUCH AND OPTIMA datasets, multiple experiments were done with from 3-12 volumes for IRF, SRF, and PED on Cirrus, Spectralis, and Topcon checking CNN type (FCN, U-net, Seg-net, Deeplab3+, PatchFCN, PatchUnet, PatchSegnet, PatchDeeplab3+, Ex-Unet, PactchEx- Unet) for dataset fine tuning and network performance [6]. PatchDeeplabv3 and PatchEx-Unet performed better than the other networks [6]. Thus, the networks trained with patches, which meant that the image could be captured at different scales and neighboring regions at the same location could lead to better network spatial consistency [6]. The above CNN architectural networks, (annotated, encoder/ decoder, conditioned learning), trials with the different OCT units and different volumes are presented to illustrate the level of supervised detail learning in CNN. Far more complex, however, is the unsupervised detail learning in the iterative convolving input/ output, in the different CNN layers themselves, with different CNN architectures that may be adapted for OCT image processing to understand macula edema, intraretinal fluid and sub retina fluid [6-8].
Table 1:Lexicon on Some Neural Network Architectures, Similarities and Differences
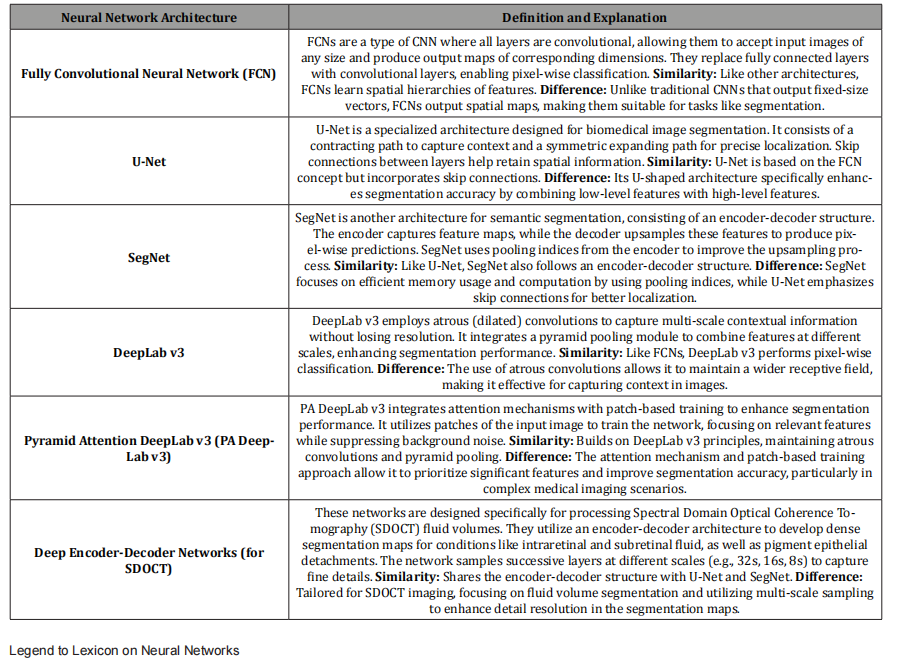
Table 1 presents a sampling of various OCT neural networks used in medical imaging, particularly the tactics for image segmentation. Each neural network employs slightly different methods, such as input image correlated to annotated image, “attention mechanisms”, patch-based training, multi scale sampling , and yet other CNN deep learning techniques, (not presented here), add different deep learning CNN tactics to highlight different aspects of disease vs normal in medical image analysis, such as in Alsiah, et al [6], and Schlegl [8] in their demonstration of IRF and SRF amounts from different SD OCT imaging devices.
3. Strategic Adjustments for diagnosing Macular Edema; CNN Architectures/Optimizing: size of CNN, Deep learning, DL, Algorithms, Retinal Activation Maps; Dataset choice and dataset combinations
From the standpoint of expert review, Altan, (after reviewing the advances in OCT image processing in detecting DME from hand-crafted features to adapting DL algorithms to diagnose DME, including transfer learning, feature learning, and pruning pre-trained CNN architectures), proposed a lightweight CNN architecture called DeepOCT using “an acceptable number of training parameters “ to visualize the salient retinal activation maps for clinical understanding of macula edema [9]. First, he excluded non-retinal OCT sections, then made curvature correction for retinal layer analysis with a standardized OCT scan alignment [9]. The CNN architecture identified macula edema from scratch and it developed weight initialization for retinal layers for easy transfer learning to adapt acquired knowledge into ready analysis of subsequent related medical images [9]. Using small and large scale data sets (Zhanglab and Singapore Eye Research Institute), DeepOCT was then implemented, checking the effectiveness of the proposed architecture. The robustness of the same CNN architecture was checked on OCT scans with different specifications [9].
Adjustments for Problems of CNN Efficacy in Diagnosing Macular Edema and Diabetic Macula Edema:
Overweight models, ill-defined sources of CNN architecture learning, segmentation choices for optimal pathology localization, questionable concordance of initial CNN architectures with OCT image pathologies, discordant OCT filtering techniques, managing retinal curvatures and boundaries, better database choices, allowable model loss functions
By comparison to other pre-trained DL architectures which have a large variety of classification parameters, e.g., 25M, (ResNet-50) [9], 60M, (AlexNet) [8], Deep OCT has 7.9M parameters, lightweight [9]. Although many related studies reported high accuracy, specificity, sensitivity, or AUC, it is unclear how to estimate the actual role of the learned feature in the model outcome. I.e. it is hard to understand responsible regions or network architectures in the iterative CNN learning procedure that are the key to the model performance [9,10,15]. Transfer learning helps this problem by training a CNN model with specific traceable information of other trained architectures. However, there must be a concordance of the initial and target problem goals for the already learned material of feature trained learning to be relevant. Nonetheless, other investigators’ may not have had this concordance in their models, for OCT images for DME identification [9,10, 11,12,14, 17, 18,21,25].
DeepOCT, trained from scratch not using any prior weight factor or pretrained architectures generated feature activation maps just related to the OCT retinal evaluation at hand [9].
Given the intensive speckle noise of OCT, many researchers have opted for the use of denoised images. That has led to the evolution of many types of segmentation for viewing retinal pathology and better localization. However, in contrast to analysis of raw OCT scans, various filtering techniques are arduous and make different sequences with different parameters hard to compare. e.g. In cases of advanced DME with different curvatures and background specifications, identifying retinal boundaries can be challenging [9]. Thus, investigators used median filtering [8,10], BM3D [8,12], sparsity-based block matching [10,20], and Surrogate Image Generation [20] to extract retinal layers. Then OCT-specific non-automatic cropping was used for extracting relevant regions of DME [15-18]. Since a flattened layer on CNN for DME is more effective to grasp the pathology of the retinal layer [9,16], Altan [9] in addition to BM3D use for noise suppression and retinal edge preservation, also achieved flattening for curvature correction as well as binarization for upper and lower boundary detection and automatic cropping of non-ophthalmic OCT patterns [9].
Ji Q, et al. [10] further adapted popular CNN models to improve the accuracy of DME identification in OCT images. They experimented by removing deep convolutional layers of GoogleNet, ResNet, and DenseNet, thereby reducing the number of parameters to 8.5 M. [9, 10]. However, in order to understand the clinical validity of such adjustments, correlating feature maps from CNN output to actual disease pathology is required [9]. Rasti, et al. [15] using wavelet transform CNN to compare the efficiency of multiple machine learning algorithms sought to define the optimal spatialfrequency domain of CNN for macular pathology diagnosis. But because of the limited number of OCT scans, it was not suitable for generalization of DME pathology [9]. Rasti, et al. [16] with a muliscale CNN model used a new cost function. (Cost function or “loss function” measures how well the network is performing) Rasti et al. compared their CNN model training time and discrimination ability with known CNN architectures. Although they found their model superior, there was no visual correlates to show which sections were learned by their proposed CNN architecture [9]. By chaining together hand-crafted CNN features, Gabor filters and a fixed scale transform with a convolutional block at the middle layers, X. Li, et al. [19] created a ribcage network for dense CNN layers. The network was then trained on a ZhangLab database and achieved a reduction in training time and greater disease indentification than VGG-16, DenseNet, and Xception architectures on OCT images. However, their hand-crafted techniques were time consuming; their initialized weights to the ImageNet layer did not relate to the knowledge for OCT; and using random crop in the data augmentation might feed the network with non-related small pathologic changes for DME in the ZhangLab data [9].
Rong, et al. [20] developed a surrogate generation feature by an optimized non-orthogonal wavelet filter to OCT. It was a lightweight CNN model with four convolutional layers that could denoise and use mask extraction to identify retinal diseases. However, too few OCT scans were used in training and visual evaluation was not possible for learned data and decisions on pathology [9]. Since a large number of CNN architecture developers trained data using a limited number of OCT scans, [9], they were not suitable for training deep learning models which was also not helped much by using cross validation [9, 15,16,12,13,17,14,18,21]. Finally, in the above CNN critique considerations [9], whereas the normative AI techniques for large databases is to split training and testing data sets and hold out a certain initial percentage of the data for testing and validation testing, some related CNN investigators mentioned above commonly just combined available datasets or just used one. [15,19,21,11] Thus, the generalization impact of those CNN architectures on OCT image scan might be less significant [9]. in a comparative of investigators of CNN OCT architectures for high accuracy, sensitivity, and specificity, the DeepOCT [9] was amongst the highest with accuracy 99.12, sensitivity 98.58, and specificity 99.66, despite utilizing the lowest number of input parameters at 7.9M [9]. The closest CNN architectural competitor, AlexNet with 99.80,100, 99.60, (accuracy, sensitivity and specificity) [10], used 60M input parameters [9,10].
5a. Preprocessing OCT images, OCT image Datasets, Denoising OCT images, Retina Layer Stratification, DME or AMD Macula Fluid Cassification, CNN architectural Adaptations, Algorithms to Flatten and Align Retinal Layers and Achieve Activation Map images of edema, mapping qualitative Fluid and Location; High Accuracy Metrics
Returning to the topic of assaying types of retinal fluid collection, [3,6,9] intra-retinal, subretinal, and pigment epithelial detachment, the Altan [9] points will be discussed further. His methodology from pre-processing OCT images through CNN architectural adaptations, activation mapping of qualitative fluid and location, and accuracy metrics were amongst the most noteworthy, as the large number of citations of his paper might suggest. Of particular note is his approach of using DNN for CNN architectural modeling before training and testing DL algorithms. While CNNs usually have 1 or 2 hidden layers for convolving input and output data, DNNs have 3 or more hidden layers. So, in a CNN with a larger number of hidden layers to take input from say item specific “attention focused” layers input and output where every layer trains on different focused features, there is a greater number of chances to evolve more significant relationships that are nonlinear as well as linear. Thus, DNNs are more adept at convolving unstructured and unlabeled data, which is the majority of the data in the world.
(Hence, DNNs through separate stages, for example, can extract benign and malicious malware programs by analyzing hidden deep and deeper layer input and output layers for calibrated probability malware scores. [Mohanasundaram, Periasamy chapter authors in Practical Machine Learning for Data Analysis Using Python, (Abdulhamit Subasi book author), chapter titled: Deep Learning and Parallel Computing Environment for Bioengineering Systems, 2019, Pages 139-151, Science Direct] Thus, the CNN architecture proposal should consider feature learning as well as supervised learning with DNNs [9]. This method allows for each feature map to have the possibility of performing high generalized predictions for different dense layer specifications. This also provides for feature activation maps derived from different convolved deep layers to achieve high performance by having a chance to learn from the progressively better model output characteristics from earlier layers [9].
OCT images with different scans of the same patient macula, (be it normal, edema and or degeneration) can identify key characteristics of the retinal layers. The location and size of the pathology can vary e.g.in OCT of DME from non-DME. So nonDME presents a normal foveal pit and extrusion, (full dimension character of the plexiform layers). DME OCTs have shallow or absent foveal pit and little or no extrusion of the plexiform layers, causing variable retinal detachment with variable macula disease severities [9]. Zhanglab, Singapore Eye Research, SERI were open-access clinical databases used for OCT images to analyze macula edema classification models. ZhangLab dataset contained 11,349 DME and 51,140 normals; SERI, 126 OCT for each subject; resolution of 512x1024 pixels [9]. Datasets were stratified by patients not by OCT images and segregated into trained and tested. The ZhangLab and SERI datasets were trained and tested separately, and cross validated, from the SERI group [9].
The OCT images were: denoised for retinal edge detail preservation; flattened for curvature correction; binarized for detection of upper and lower OCT boundaries; cropped to exclude non-ophthalmologic patterns; and resized to feed into the DL architecture [9]. The BM3D algorithm was first applied to the OCT images to reduce noise because of its greater effectiveness than conventional OCT filtering methods. [9,10,18] BM3D designates a group of similar patches from non-local regions of OCT images and extracts a 3-D wavelet representation of the patch groups respectively [9,22]. Adjusting BM3D parameters for ZhangLab and SERI datasets respectively not only attenuated OCT image noise but also made the morphological details of retinal layers and pathologies more prominent [9, 23,24]. Since the position of the retina varies depending on the given OCT image, a flattening algorithm, anisotropic diffusion, was next utilized to get retinal layers uniformly aligned and to minimize morphological variations [9,25]. Each of the OCT images was horizontally cropped using binarized images. After an adaptive threshold value, which was manually determined to achieve clear retinal layers, ten random OCT scans with DME and 10 non-DME were selected; this excluded non-ophthalmologic patterns in OCT images. Lastly, each OCT image was resized to 224x224 pixels for comparable architecture for the remaining pretraining networks, VGG-16, VGG-19, ResNet, EfficientNet, and others. [9]
Regarding application of pre-trained CNN models to detect DME from OCT images, Lee et al [26] with VGG-16 on Heidelberg Spectralis database with 2.6 million images identified AMD macula edema with an accuracy of 87.63%, a sensitivity of 84.63%, and a specificity of 91.54%. Rasti et al [15] looking at abnormal maculae, using wavelet-based CNN on Heidelberg Spectralis and DUKE databases, on the latter had 99.33% precision and 99.11% sensitivity, and with Heidelberg 98.67% precision and 98.22% sensitivity. Rong et al ]20] using a CNN surrogate image generation system identified DME from non-DME with 95.09% accuracy and 96.39% sensitivity. Alternatively, about a decade ago, several investigators by using feature extraction and training a classifier were able to reliably diagnose AMD and DME. For example, Liu, et al. [27] computed the Local Binary Pattern to encode the texture and shape of information in OCT images. They then presented the images using a multiple scale pyramid followed by dimension reduction with principal component analysis.
Sugruk, at al. [28] segmented the OCT images to locate the RPE layer and then used a binary classification to distinguish between AMD and DME. Srinivasan et al, utilizing multi-scale histogram made histogram-oriented descriptors or feature vectors of the OCT image and then developed SVM CNN. (SVM or Support Vector Machine is a shallower machine learning algorithm. SVM cannot understand a raw image. It must first extract image features using separate algorithms, like histograms of scale, transform, or color and then develop classifier algorithms for AMD and DME [29]. Thus, several distinct CNN tactics have been successfully used to take an OCT image and render its salient features so that different patterns of macular edema can be diagnosed. Ji, et al. [10] reported an accuracy rate of 100% identifying DME using Inception V3 CNN architecture. (Inception V3 is a deep Neural network composed of specialized “inception models” that convolve raw image pixels running parallel input. It then automatically learns from simple edges in early layers to complex object parts in deeper layers; it thrives on large datasets which are essential to train the data without overfitting, (which is when the model erroneously captures noise, outliers, and random changes rather than the actual pattern.) However, inception V3 CNN requires heavy GPU, graphing processing unit, to accelerate 3 D graphics, as in video games, for training and inference.
Ji, et al. [10] technique in more detail, adopted the image preprocessing method of Sun, et al [31]. The sparsity-based block matching, the BM3D filter performs the denoising [32] binarization, median filtering, morphological closing and opening in conjunction with Inception V3 CNN, then obtains the subject image. A fitting stage follows where a set of data points are chosen and then linear of second-order polynomial fitting are obtained. The retinal image is then normalized by aligning it to a unified morphology and it is cropped to trim excess space. Thus, the preprocessing and detailed processing steps take the image from a noisy, deformed state to an advanced image of AMD or DME [9]. In a very brief way, we have illustrated some CNN architectural possibilities to distinguish macula edema from absence of macula edema in OCT images, with very high accuracy [9,10].
5b. Figures illustrating Macular Edema; IRF, SRF, altered retinal layer anatomy after CNN analysis from Dr. Mikhail’s Laboratory
With Permission: Figures 1 and 2, captions and legends are from Dr. Mikhail Kulyabin Journal: ArXiv:2312.08255v1 [eess.IV] 13 Dec 2023, open source [****] databases License: CC BY 4.0 OCTDL: Optical Coherence Tomography Dataset for ImageBased Deep Learning Methods
Mikhail Kulyabin Pattern Recognition Lab, Department of Computer Science, Friedrich-Alexander-Universität ErlangenNürnberg, Martensstr. 3, 91058 Erlangen, Germany
Figure 1: Histopathological Description; OCT with AMD shows disrupted normal for architecture of outer and inner retina with heterogeneous hyper and hypo reflectivity in the choroid and cystic spaces in the outer retina.
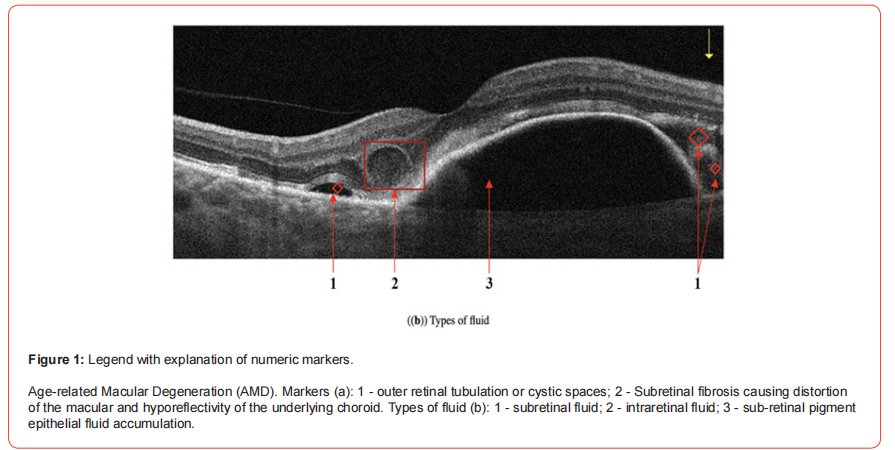
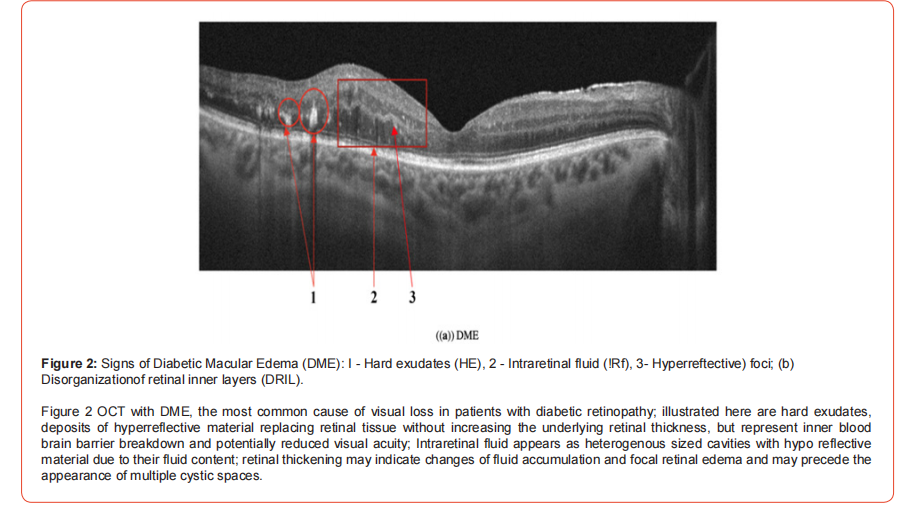
The above two figure images derive from the 2023 OCTDL data set: 1618 B-scan images, JPG format, the name of each image consists of a shortcut of the corresponding disease and a sequence number;
Optovue Avanti RTVue XR- Equipment was used to create and store images in over 1000 patients. The cohort characteristics included age 50-85, male to female, 3:2, mean age 63 patients are from Yekaterinburg, Russia; A CSV file stored the labels with classification by pathological condition, AMD, DME, ERM (Epiretinal membrane), NO(Normal), RAO, (Retinal artery occlusion) RVO (Retinal vein occlusion), VID (vitreomacular Interface Disease): labels in the dataset, and open access [****].
The images were marked by a practicing medical retina specialist. Labeling of the scans was made based on the retinal pathology and the patient’s clinical diagnosis. The study was approved by the ethics committee of Ural Federal University, Russia, Feb 2023 and informed consent was obtained from all study subjects [****]. The OCTDL dataset performance has had testing of the Deep Learning architectures of ResNet50 with labels of the above mentioned pathological conditions with accuracy of 0.891 and AUC 0.985; OCTDL testing with VGG16 with labels ERM, NO, RAO, RVO, VID had 0.895 accuracy and 0.980 AUC [****].
OCTDL dataset has the potential for AI automated OCT image layers and may have extensions to diagnose retinal dystrophies and retinopathy of prematurity as well [****].
5c. AI based RETICAD for widefield scanning laser on iv fluorescein images of RVO to measure RBBB permeability, central macula thickness, and macula volume
Returning to Ryan, et al. [3], investigators with the AI based RETICAD, used an ultrawide field scanning laser ophthalmoscope on iv fluorescein images, IVFA, to quantify macula edema in a cohort with retinal vein occlusion, RVO. They presented 41 RVO eyes with greater than or equal to 310 um central macula thickness, CMT [33]. (Normal macula thickness is between 250 and 300 micrometers typically measured with OCT.) Using univariate and multivariate regression models they investigated associations between baseline best corrected acuity, BCVA, central macula thickness, and macula volume. Subgroup analysis showed that in central RVO patients, central RBBB permeability was significantly associated with CMT (p=0.022) and macular volume (p= 0.010); no association was found to BCVA; However, in branch RVO subgroup patients, central RBBB permeability was significantly associated with BCVA (p= 0.006) and CMT (p = 0.009), but not with macula volume (p = 0.723). Both central and peripheral RBBB permeability in patients with RVO and DME [32] was significantly higher compared to healthy patients (p < 0.001). [33,34]. These quantitative FA measurements using AI to obtain RBBB permeability, macula volume, CMT, BCVA, and disease entity correlations help remove some of the “black box” [9] of then unknown patho-physiological associations in macula edema seen with at least the early CNN techniques.
5d. Quantitative AI generated OCT image fluid metrics, amount and location, central and para macula, statistical methods, demographics and visual acuity and fluid characteristics of study eyes,
Recently, Franquesa-Garcia, et al. Gende, et al. and Alzu’bi, et al. provided quantitative links between AI CNN architectural methods and retinal fluid location and amount. Thus, these papers contributed to the “explainability element” of CNN, raised by Altan [9]. Using UNet, ResNet, and Grad-Cam upgraded OCT retinal image analysis to allow for robust fluid segmentation and quantification in OCT retinal images [35,37,38], Franquesa-Garcia, et al. [35] processed OCT cube scans of patients with DME Dexamethasone implants using a Commission Europeenne marked AI -based software solution (Discovery Ikerian [36]) to quantify IRF and SRF compartments. Central foveal 1mm, parafoveal 3mm, and perifoveal 6mm areas, were evaluated and automated thickness and volume maps were generated for location and amount of retinal fluid. Clinical data and OCT scans were collected at baseline, 3 months and 12 months. Fluid volumes were determined in nanoliters and eyes were categorized into quartiles, top 25% volume, highest quartile, lowest volume bottom quartile. Comparisons were made of the quartiles and the distance from the fovea, listed above, and applied to all IRF and SRF found in the fovea, parafovea, and perifovea regions.
T-tests, Mann-Whitney U tests, and Wilcoxon signed rank tests as well as counts, percentages, means with SD, medians, and quartile values were tabulated. To estimate fluid and visual acuity association, univariate and multivariate generalized estimating equations and linear mixed models were used to account for inter eye correlation in the analysis. “Analysis was performed in R V.4.0.3 (cran.r-project.org; http://cran.r-project.org) using nlme (3.1.153) and geepack (1.3.2) packages for linear mixed models and GEE, respectively.” [35]. 101naive eyes from 83 patients treated with DEX implants for DME, mean age 67.5 years, were included. Mean visual acuity untreated: at baseline, 3 months, and 12 months: from baseline to 3 months was +2.9 letters, at 12 months was -1.7 letters. DEX Implant treated: 3 months was 10.9 letters and 12 months was18.3 letters. Treated eyes received an average of 1.8 DEX implants during follow up; 2 implants ware needed in 33% of eyes and 23% required 3 or more injections. The mean number of visits was 7.3, 5.5 of which were non-treatment related [35].
The fluid quantifications were performed at baseline. The predominant fluid type was IRF, followed by SRF, 424 nL vs 66.8nL, respectively in perifovea. Across all measured IRF and SRF there was an initial reduction from baseline to 3 months. But at 12 months there was a slight increase in IRF but not greater than baseline [35]. The mean central subfield thickness, CST, untreated at baseline was 463.1um, 3 months was 366.2 um, and 12 months was 378 um; treated at baseline was 124.1 um, 3 months was 85.7 um, and 124.6 at 12 months [35]. At baseline, SRF and IRF were associated with worse final visual acuity in the univariate model, SRF: -12.5 letters p = 0.01, IRF: -8.95, p = 0.07. At month 3, IRF and SRF volumes were associated with statistically significantly less final visual acuity, (-29.8, p<0.001; -17.9, p=.02) IRF and SRF respectively, univariate analysis and worse final visual acuity at about the same level (-26.4 each) with multivariate analysis, p=0.004. At 12 months, IRF volume was strongly associated with worse final visual acuity in both uni and multivariate analysis (-11.6 and -12.5, both p = 0.03) Of significance, at 3 months, a 100nL drop in IRF volume was consistently associated with slightly more than 1 letter visual acuity gain on univariate and multivariate analysis, p =0.02 and 0.03 respectively. For SRF in adjusted multivariate analysis -4.79 letters, p=0.06). At 12 months, none of the fluid compartments illustrated significant associations to visual acuity gain [35].
Although central retinal thickness, CRT, has been a significant driver of clinical decisions in DME [40], along with retinal atrophy, (as a more cogent issue,) [41] there is controversy about whether baseline CRT is a predictor of visual acuity [42,43]. Franquesa Garcia, et al. [35] explored the relationship between IRF and SRF in the DEX implant cohort where treatment achieved a notable reduction of IRF and SRF, especially at 3 months, after the peak of maximum drug release, 8 weeks. While there was no statistically significant association between IRF volume at baseline and final visual acuity, at 3 months, IRF volume was shown to be a predictor of poor long term visual acuity. The unresolved IRF fluid volume by three months predicted the final visual acuity of these patients at 12 months. A 100nL IRF fluid reduction at 3 months was associated with final visual acuity of +1.5 letters. However, it would appear that the initial visual acuity improvement with IRF reduction was not sustained over time, possibly either because of IRF fluid relapses or fluid relapses above a certain level cause retinal damage [35]. SRF baseline volume was associated with worse final visual acuity level at 12 months [35].
However, even though the absolute values of SRF were much lower than those of IRF, fovea :10.4nL SRF vs 69.7nL IRF; parafovea: 37.4 nL vs 259 nL; and perifovea: 66.7 nL vs 424.4 nL. a reduction of 100nL of SRF in the overall cohort at 3 months had a trend for visual acuity loss.[35] Whether this was due to greater, more diffuse retinal atrophy early with SRF vs IRF is unclear [35]. By the authors admission, [35] the 12-month timepoint may contain a combination of stable DME eyes and those that require further injections right at the moment of the visit, which is a pattern often seen in DEX studies, which may limit the visual outcomes reported at 12 months. Also, fluid measurements were accepted as ground truth without independent verification by a reading center.
Nonetheless, the study illustrates associations between AI based retinal fluid volumes and one-year visual outcomes in DME patients treated with the DEX implant in a real-world study setting [35].
Gende, et al. [37] to address the limitations of single expert central serous chorioretinopathy, CSC, subjectivity in OCT diagnosis, utilized intra- and inter-expert analysis of multiple ophthalmologists and models trained and validated using a representative dataset of patients with CSC and normals. An external dataset was used for validation. Six representative configurations of backbone segmentation networks and encoder architectures were trained and validated on the representative OCT image dataset. Intra- and inter-expert comparisons were made from the best model configurations for each backbone architecture amongst themselves, and with two experienced experts vs the models and each other [37]. The dataset contained 303 CSC images and 254 healthy controls acquired with a Heidelberg Spectralis optical imaging platform. The images were macula centered representative from both eyes using 1-7-line scans with severity variability of CSC from small to large fluid accumulations. All images were re-sized to 512 x 512 pixels during pre-processing [37]. After sampling, Gende et al. trained and validated different CNN architectures: (1) FPN, feature pyramid network, which uses nearest neighbor data pick-up and outputs feature maps for bounding box predictions and class scores, and (2) U-Net which uses transposed convolutions for data pick-up and outputs a precise segmentation mask for each pixel through skip connections that combine features from different convolution depths [37].
Regardless of the use of FPN or U-Net architecture, the segmentations for MobileNet, DenseNet, and ResNet each achieved 0.999 accuracy. [37] However, the U-Net architecture, generally more complex in terms of trainable parameters, seemed to display less variability than the FPN architecture, indicating that he U-Net is less prone to overfitting [37]. Bland-Altman plots showed that the models achieved results comparable to the experts, with a bias toward the second expert, which suggests that the models may over-segment when compared to the first expert. (In BlandAltman plots the X-axis, which is the average of two measurements and Y-axis which is the difference between two measurements; the plot shows the correlation, not agreement of two measurements) [37] Comparing the two experts, their Dice and Cohen’s Kappa coefficients of 0.952 and 0.951 are what you would expect from manual inspection of OCTs in clinical practice. (Dice and Kappa measure agreement, but dice is a spatial overlap metric measuring the size of the intersection of two areas divided by the total of the two areas combined. Dice ranges from 0 to 1, O no overlap, 1, 100% overlap; Cohen’s Kappa is equal to how often the experts are observed to agree minus the hypothetical chance that they agree if both guessed blindly divided by 1 minus the hypothetical chance that they agree if both guessed blindly.) [37], [Google Gemini] Of interest, comparing the AI models to the experts, the models agree more with each of the human experts than the experts agree with each other [37]. Both deep learning architectures found consensus close to either human expert. Thus, deep learning models using the Heidelberg Spectralis for data can provide robust and repeatable analysis of CSC OCT images for accurate diagnosis [37]. To learn more about areas where the model has a higher fluid activation, with more explainable results, Axiom-based Gradient weighted Class Activation Mapping (XGrad-CAM) can be used for easier to interpret segmentation results [37, 45]. One shortcoming of Gende, et al. [37] is that the actual severity of the initial CSC images had not been graded. Another is that all the images were validated from a single platform, Heidelberg Spectralis.
Alzu’bi, et al [38] used CNN architectures InceptionV3, 97% Grad-Cam activation density from hyper-reflective regions to restored retinal layers. These Grad-Cam differences provide visual evidence (explainability) of treatment or disease response [38]. Segmentation for volume quantification, through skip connections that preserve spatial localization of fluid boundaries across scales with UNet encoder-decoder architecture help illustrate volume accuracy, ResNet, 95% accuracy. and MobileNetV2, 89%accuracy, on a data set termed KAUH in conjunction with (XAI)-Grad-CAM, (“explainable” techniques) to distinguish between DME and AMD with OCT scans. MobileNet, however, using a public dataset had 97% accuracy. Grad-CAM was applied to visualize model predictions and the outcomes were manually validated against annotated data to check interpretability [38]. “Explainability” using Grad-CAM on Inception V3, ResNet, and MobileNet architectures consists of early layers with broad receptive fields capturing retinal structure and context, and later layers, especially layer 23 with highly localized activation, capturing overlapping fluid filled spaces and subretinal pockets with precision. Attention maps intersecting expert-annotated fluid boundaries are applied to capture fluid volumes. Shifts in volume changes over time cause shifts in Grad-Cam activation density from hyper-reflective regions to restored retinal layers. These Grad-Cam differences provide visual evidence (explainability) of treatment or disease response [38]. Segmentation for volume quantification, through skip connections that preserve spatial localization of fluid boundaries across scales with UNet encoder-decoder architecture help illustrate volume changes. Gende, et al. [37] found that UNet models have lower inter-model variability, better reproducibility of attention than FPN architectures. i.e. UNet’s convolving pathway with symmetric filtering may provide more consistent fluid localization over independent data training runs. [37].
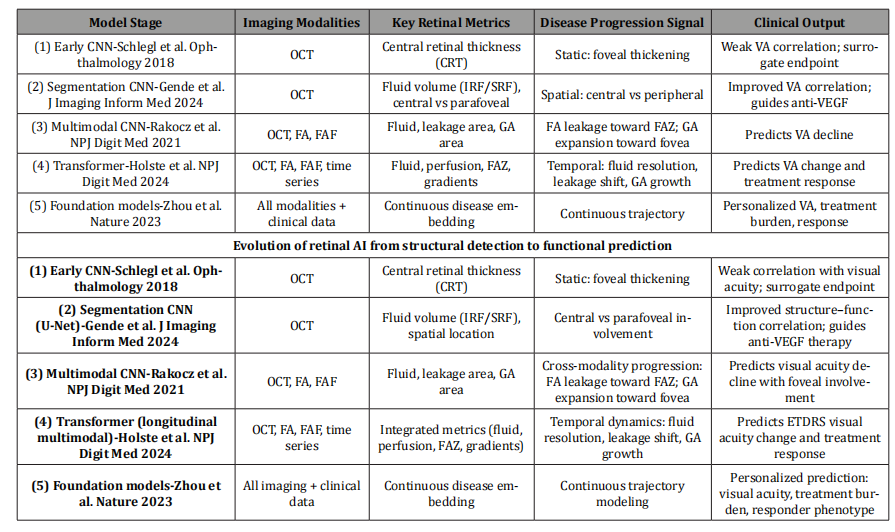
Table 2: Evolution of retinal AI from CNN-based structural quantification (OCT thickness and fluid volume) to multimodal and transformer based models integrating OCT, FA, and FAF, enabling temporal disease modeling and prediction of visual acuity outcomes and treatment response
References for model stage
1. Schlegl, T., Waldstein, S. M., Bogunović, H. et al. Fully automated detection and quantification of macular fluid in OCT using deep learning. Ophthalmology 125, 549-558 (2018). 2. Gende, M., Sguazzin, C., Rodríguez, A. et al. Intra- and interexpert validation of an automatic segmentation method for fluid regions associated with central serous chorioretinopathy in OCT images. J. Imaging Inform. Med.37, 1-12 (2024). 3. Rakocz, N., Zhao, S., Cheung, B. et al. Automated identification of clinical features from sparsely annotated 3-dimensional medical imaging. NPJ Digit. Med. 4, 1-9 (2021). 4. Holste, G., Keane, P. A., Denniston, A. K. et al. Deep learning for longitudinal prediction of retinal disease progression using multimodal imaging. NPJ Digit. Med. 7, 1-10 (2024). 5. Zhou, Y., Chia, M. A., Wagner, S. K. et al. A foundation model for generalizable disease detection from retinal images. Nature 624, 398-405 (2023).
Conclusion
Moving from historical facets of macula edema using FA measurements of retinal blood flow, macula volume, retinal blood brain barrier permeability [3,33,34] to OCT qualitative [9- 32] and recently quantitative [33-43] measurements of central retinal thickness and retinal blood volume, using increasingly evolved, sophisticated CNN architectures of the last decade, this paper has endeavored to characterize the progression and depth of approximately four decades of research in the clinical diagnosis of macula edema. Macular edema accounts for visual demise from high profile eye diseases such as diabetic retinopathy and macular degeneration to lesser publicized, central serous chorioretinopathy and retinal vein occlusion, all of which are referenced in different portions of this paper. In the lesser publicized group as well, macular edema may also be the uninvited consequence to a host of many other inflammatory /immune ocular and systemic diseases.
Thus, it is not surprising that so much effort has been devoted to identifying, localizing, and quantifying macular edema using AI techniques. CNN, for example, offers many sophisticated architectures with iterative and hierarchical adaptations and analysis of different OCT images or portions thereof, (such as transformative pre-processing, segmentation/reconstructive, spot sampling , position and scale amplification, annotated labeling and others), which can leverage the sometimes occult patterns of disease in AI validated OCT or FA image datasets of patients to enhance our understanding of the qualitative and quantitative elements of macula edema and its early distinct disease pathways.
Acknowledgments
None.
Conflict of Interest
None.
References
- Lim JI, Kiim SJ, Bailey S, Kovach J, Vemulakonda, G et al. (2025) Diabetic Retinopathy Preferred Practice Pattern. Ophthalmology 132(4): 75-162.
- Mansour S, Browing D, Wong K, Flynn H, Bhavsar A (2020) The evolving treatment of diabetic retinopathy. Clin Ophthalmol 14: 653-678.
- Ryan H, Mihalache A, Popovic M, Munn C, Melo I (2024) Artificial Intelligence-Enhanced analysis of retinal vasculature in age related macular degeneration. Retina 44(9): 1478-1485.
- Vyawahare H, Shinde P (2022) Age-related macular degeneration: Epidemiology, pathophysiology, diagnosis, and treatment. Cureus 14: e29583.
- Holz FG, Jorzik J, Schutt F, et al. (2003) Agreement among ophthalmologists in evaluating fluorescein angiograms in patients with neovascular age-related macular degeneration for photodynamic therapy eligibility (FLAP-study). Ophthalmology 110: 400-405.
- Alsaih K, Yusoff M, Tang T, Faye I, Meriaudeau F (2020) Deep learning architectures analysis for age-related macular degeneration segmentation on optical coherence tomography scans. Comput Methods and Programs in Biomed 195: 105566.
- Tustison N, Avants B, Gee J (2019) Learning image-based spatial transformations via convolutional neural networks: A review. Magn Reson Imaging 64:142-153.
- Schlegl T, Waldstein S, Bogunovic H, Gerendas B, Langs G (2018) Fully Automated Detection and Quantification of Macular Fluid in OCT Using Deep Learning. Ophthalmology125(4): 549-558.
- Altan G (2022) DeepOCT: An explainable deep learning architecture to analyze macular edema on OCT images. Engineering Science and Technology 34: 101091.
- Ji Q, Huang J, He W, Sun Y (2019) Optimized deep convolutional neural networks for identification of macular diseases from optical coherence tomography images. Algorithms, 12: p. 51.
- Kermany D, Goldbaum M, Cai W, Valentim C, Liang C, (2018) Identifying Medical Diagnoses and Treatable Diseases by Image-Based Deep Learning. Cell 172: 1122-1113.
- M Awais, H Muller, TB Tang, F Meriaudea (2017) Classification of SD-OCT images using a Deep learning approach. Proceedings of the 2017 IEEE International Conference on Signal and Image Processing Applications, ICSIPA 2017 IEEExplore, Kuching, Malaysia: pp. 489-492.
- Rong Y, Xiang D, Zhu W, Yu K, Shi F (2019) Surrogate-assisted retinal OCT image classification based on convolutional neural networks. IEEE J Biomed Health Inform: pp. 253-263.
- Chan G, Muhammad A, Shah SA, Tang TB, Lu C (2017) Transfer learning for Diabetic Macular Edema (DME) detection on Optical Coherence Tomography (OCT) images. Proceedings of the 2017 IEEE International Conference on Signal and Image Processing Applications. ICSIPA 2017 IEEExplore, Kuching, Malaysia: pp. 493-496.
- R Rasti, A Mehridehnavi, H Rabbani, F Hajizadeh (2018) Automatic diagnosis of abnormal macula in retinal optical coherence tomography images using wavelet-based convolutional neural network features and random forests classifier. Journal of Biomedical Optics: pp. 1-10.
- R Rasti, H Rabbani, A Mehridehnavi, F Hajizadeh (2018) Macular OCT Classification Using a Multi-Scale Convolutional Neural Network Ensemble. IEEE Transactions on Medical Imaging: pp. 1024-1034.
- O Perdomo, S Otalora, FA Gonzalez, F Meriaudeau, H Muller (2018) OCT-NET: A convolutional network for automatic classification of normal and diabetic macula using SD-oct volumes, Proceedings - International Symposium on Biomedical Imaging. IEEExplore, Washington, DC, USA pp: 1423-1426.
- GC Chan, SA Shah, TB Tang, CK Lu, H Muller, et al. (2018) Deep Features and Data Reduction for Classification of SD-OCT Images: Application to Diabetic Macular Edema, International Conference on Intelligent and Advanced System. IEEE, Kuala Lumpur, Malaysia: pp. 1-4.
- X Li, L Shen, M Shen, CS Qiu (2019) Integrating Handcrafted and Deep Features for Optical Coherence Tomography Based Retinal Disease Classification. IEEE Access: pp. 33771-33777.
- Y Rong, D Xiang, W Zhu, K Yu, F Shi, et al. (2019) Surrogate-assisted retinal OCT image classification based on convolutional neural networks. IEEE J Biomed Health Inform: pp. 253-263.
- S Kaymak, A Serener (2018) Automated Age-Related Macular Degeneration and Diabetic Macular Edema Detection on OCT Images using Deep Learning, 2018 IEEE 14thInternational Conference on Intelligent Computer Communication and Processing (ICCP). IEEE, Cluj-Napoca, Romania: pp. 265-269.
- K Dabov, A Foi, V Katkovnik, K Egiazarian (2007) Image denoising by sparse 3-D transform-domain collaborative filtering. IEEE Trans Image Process pp. 2080-2095.
- B Chong, YK Zhu (2013) Speckle reduction in optical coherence tomography images of human finger skin by wavelet modified BM3D filter. Optics Communications 291: 461-469.
- S Huang, C Tang, M Xu, Y Qiu, Z Lei (2019) BM3D-based total variation algorithm for speckle removal with structure-preserving in OCT images. Appl Opt, 58 (23): p. 6233.
- F Li, H Chen, Z Liu, X Zhang, Z Wu (2019) Fully automated detection of retinal disorders by image-based deep learning. Graefe’s Arch Clin Exp Ophthalmol 257: 495-505.
- CS Lee, DM Baughman, AY Lee (2017) Deep Learning Is Effective for Classifying Normal versus Age-Related Macular Degeneration OCT Images. Kidney International Reports 1: 322-327.
- Liu YY, Chen M, Ishikawa H, Wollstein G, Schuman JS, et al. (2011) Automated macular pathology diagnosis in retinal OCT images using multi-scale spatial pyramid and local binary patterns in texture and shape encoding. Med Image Anal: 748-759.
- Sugruk J, Kiattisin S, Leelasantitham A (2014) Automated classification between age-related macular degeneration and diabetic macular edema in OCT image using image segmentation. In Proceedings of the 7th Biomedical Engineering International Conference, Fukuoka, Japan: pp. 1-4.
- Srinivasan PP, Kim LA, Mettu PS, Cousins SW, Comer GM, et al. (2014) Fully automated detection of diabetic macular edema and dry age-related macular degeneration from optical coherence tomography images. Biomed. Opt. Express: 3568-3577.
- Szegedy C, Vanhoucke V, Ioffe S, Shlens J, Wojna Z (2016) Rethinking the inception architecture for computer vision. In Proceedings of the IEEE Conference on Computer Vision and Pattern Recognition (CVPR 2016). Las Vegas, NV, USA.
- Sun YK, Li S, Sun ZY (2017) Fully automated macular pathology detection in retina optical coherence tomography images using sparse coding and dictionary learning. J Biomed Opt 16012.
- Dabov K, Foi A, Katkovnik V, Egiazarian K (2007) Image denoising by sparse 3-D transform-domain collaborative filtering. IEEE Trans. Image Process: 2080-2095.
- Huang R, Mihalache A, Popovic M, Munn C, Melo M (2025) AI-based extraction of quantitative ultra-widefield fluorescein angiography parameters in retinal vein occlusion. Can J Ophthalmol 60(3): 177-185.
- Huang R, Mihalache A, Popovic M, Munn C, Martins I (2025) Quantitative fluorescein angiography biomarkers in diabetic macular edema. Retina 45(6): p 1125-1133.
- Franquesa Garcia F, Romero Nunez B, Martin Pinardel M, De Zanet S, Gonzales Lopez J (2026) Artificial intelligence-based fluid quantification predicts clinical outcomes in diabetic macular oedema eyes treated with intravitreal dexamethasone implants: DIADEMA project. Br J Ophthalmol, bjo: 328172.
- Mantel I, Mosinska A, Bergin C, et al. (2021) Automated Quantification of Pathological Fluids in Neovascular Age-Related Macular Degeneration, and Its Repeatability Using Deep Learning. Transl Vis Sci Technol 10:17.
- Gende M, Castelo L, de Moura J, Novo J, Ortega M, (2024) Intra- and Inter-expert Validation of an Automatic Segmentation Method for Fluid Regions Associated with Central Serous Chorioretinopathy in OCT Images. J Imaging Inform Med 37(1): 107-122.
- Alzu'bi A, Momany S, Aleshawi A, Mais Tashtoush M, Al Dwairi R (2025) The utility of artificial intelligence in characterization and detecting causes of macular edema: A spectral-domain OCT-based algorithm study. Exp Eye Res 260: 110619.
- Mantel I, Mosinska A, Bergin C, et al. (2021) Automated Quantification of Pathological Fluids in Neovascular Age-Related Macular Degeneration, and Its Repeatability Using Deep Learning. Transl Vis Sci Technol 10:17.
- Patrao NV, Antao S, Egan C, Omar A, Hamilton R, (2016) Real-World Outcomes of Ranibizumab Treatment for Diabetic Macular Edema in a United Kingdom National Health Service Setting. Am J Ophthalmol 172: 51-57.
- Torjani A, Mahmoudzadeh R, Salabati M, (2023) Factors Associated with Fluctuations in Central Subfield Thickness in Patients with Diabetic Macular Edema Using Diabetic Retinopathy Clinical Research Protocols T and V. Ophthalmol Sci 3: 100226.
- Zhang Y, Xu F, Lin Z, (2022) Prediction of Visual Acuity after anti-VEGF Therapy in Diabetic Macular Edema by Machine Learning. J Diabetes Res: 5779210.
- Bressler NM, Odia I, Maguire M, (2019) Association Between Change in Visual Acuity and Change in Central Subfield Thickness During Treatment of Diabetic Macular Edema in Participants Randomized to Aflibercept, Bevacizumab, or Ranibizumab. JAMA Ophthalmol 137: 977.
- G Huang, Z Liu, LVD Maaten, KQ Weinberger, in 2017 IEEE Conference on Computer Vision and Pattern Recognition (CVPR). (IEEE, 2017), pp. 2261-2269.
- R Fu, Q Hu, X Dong, Y Guo, Y Gao, et al. (2020) Axiom-based grad-cam: Towards accurate visualization and explanation of cnns. British Machine Vision Conference (BMVC Oral) 10.48550/arXiv.2008.02312.
- Kurmann T, Yu S, Márquez Neila P, et al. (2019) Expert-level automated Biomarker identification in optical coherence tomography scans. Sci Rep 9: 13605.
- Kurmann T, Yu S, Márquez Neila P, et al. (2029) Expert-level automated Biomarker identification in optical coherence tomography scans. Sci Rep 9: 13605.
-

This work is licensed under a Creative Commons Attribution-NonCommercial 4.0 International License.