 Research Article
Macular Changes after Uneventful Phacoemulsification in Diabetic Patients in a Tertiary Hospital
Maaly Abdel Halim Abdel Fattah1,2*, Faisal Mesfer Alqahtani2 and Selwa Abdullah Alhazzaa2
1Department of Ophthalmology, Cairo University, Egypt
2Department of Ophthalmology, King Faisal Specialist Hospital & Research Center, Saudi Arabia
Maaly Abdel Halim Abdel Fattah, King Faisal Specialist Hospital &Research Center, Saudi Arabia.
Received Date: September 17, 2018; Published Date: September 26, 2018
Abstract
Purpose was to evaluate the subclinical influence of uncomplicated phacoemulsification surgery on foveal thickness in the early postoperative period.
Materials and methods: This study was conducted on 50 eyes of 44 subjects who underwent uneventful phacoemulsification in King Faisal Specialist Hospital and Research center (KFSH&RC). They were divided into
Groups: Diabetes mellitus group consisted of 25 eyes (21 diabetic patients), Control group consisted of 25 eyes (23 non-diabetic patients). Best corrected visual acuity and Optical coherence tomography were recorded preoperatively, 2 weeks, one month and two months postoperative.
Results: Despite that Mean foveal thickness was stable 2 weeks, 1 month and 2 months postoperative in the control group; our study showed significant increase in mean foveal thickness (MFT) 1 month and 2 months post-operative in diabetic group compared to the 2nd week postoperative. However, after converting the MFT into Log OCT, the MFT in diabetic and control groups was stable postoperatively without any step deterioration.
Conclusion: Diabetic patients may need prophylactic therapy before cataract surgery.
Keywords: Macular edema; Phacoemulsification; Optical coherence tomography; Diabetes mellitus
Abbreviations: KFSH&RC: King Faisal Specialist Hospital & Research Center; OCT: Optical Coherence Tomography; BCVA: Best Corrected Visual Acuity; DR: Diabetic Retinopathy
Introduction
The incidence of subclinical macular edema after uneventful phacoemulsification has become an issue of safety for this frequently performed operation. Advances in phacoemulsification techniques and intraocular lens design have led to improved outcomes following cataract surgery. Nevertheless, ME may develop and can result in suboptimal postoperative vision [1].
Aim of the Study
The aim of our study was to evaluate the subclinical influence of uncomplicated phacoemulsification surgery on foveal thickness in the early postoperative period.
Materials and Methods
This study was conducted on 50 eyes of 44 subjects who underwent uneventful phacoemulsification and posterior chamber IOL implantation in King Faisal Specialist Hospital and Research center. They were divided into 2 groups: Group 1: Diabetes mellitus group consisted of 25 eyes (21 diabetic patients), Group 2: Control group consisted of 25 eyes (23 non-diabetic patients). BCVA and OCT were recorded preoperatively, 2 weeks, one month and two months postoperative. The study was approved by the institutional review board of our hospital. Any participant with preoperative central involved DME (more than 310 μm on spectral domain (SD-OCT) {Carl Zeiss Meditec}, Eyes with major ocular surgery or received intravitreal Anti VEGV in the prior 4 months, were excluded from the study. Medical treatment for macular edema either topical or intravitreal injection was not performed during the study time. The data entry and analysis were performed using Statistical Package for the Social Sciences Program (SPSS) 23rd Edition.
Result
1. The mean age of control group was 68.14±6.7 while that of the diabetic group was 64±10.126 with a mean duration of diabetes of 16 years ±8.124.
2. No diabetic retinopathy (DR) was detected preoperative in 40% of diabetic eyes. Five patients (20%) had moderate non-proliferative diabetic retinopathy. Mild non-proliferative diabetic retinopathy was recorded in 32% of eyes of diabetic patients.
3. Proliferative diabetic retinopathy (treated with complete laser photocoagulation 2-3years before cataract surgery) was realized in 2 patients only (8%).
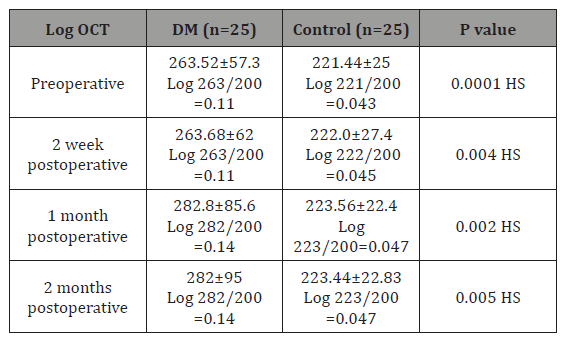
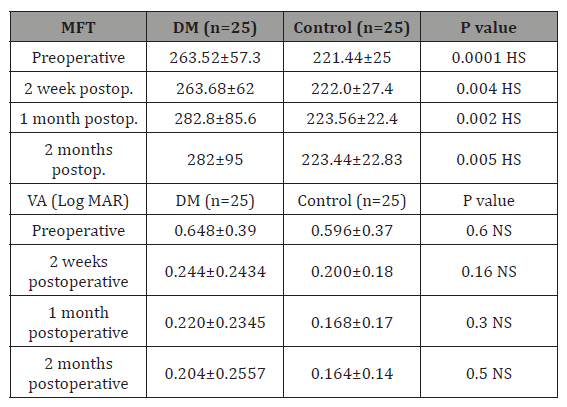
Mean Foveal Thickness (MFT) in diabetic patients was higher than control group preoperative and postoperative (2 weeks, 1 month, and 2 months) with high statistical significance difference (Table 1). Significant increase MFT 1 month and 2 months postoperative in diabetic group compared to the 2nd week postoperative. MFT was stable 2 weeks, 1 month and 2 months postoperative in the control group. Visual acuity is markedly improved from 0.6 to 0.2 postoperatively in all patients of group 1 and 2 at the second week postoperative. Despite there was no statistical significance difference in the VA recorded in diabetic patients at 2nd week, 1st month and 2nd month postoperative but statistical significance difference was noted in group 2 as the visual acuity improved to 0.2 in the 2nd week then showed one line improvement in the 1st month and 2nd month postoperative as described.
Table 1: Comparison between diabetics & control groups regarding log OCT.

Comparison between diabetics & Control groups regarding log oct
Logarithmic transformation of retinal thickness is a proposed method for assessing whether the observed OCT change in a patient is real; one step log scale change exceeds the measurement error for all degrees of retinal thickness in current instruments. This Logarithmic transformation of retinal thickness has a value for the follow up visits for statistical comparisons.it is calculated by taking the log base of the ratio of the central subfield thickness divided by 200 and rounding to the nearest hundredth [1]. Our results showed that after converting the MFT into Log OCT, the MFT in diabetic and control groups was stable postoperatively without any step deterioration.
Changes occurred at each time Interval regarding MFT in each group
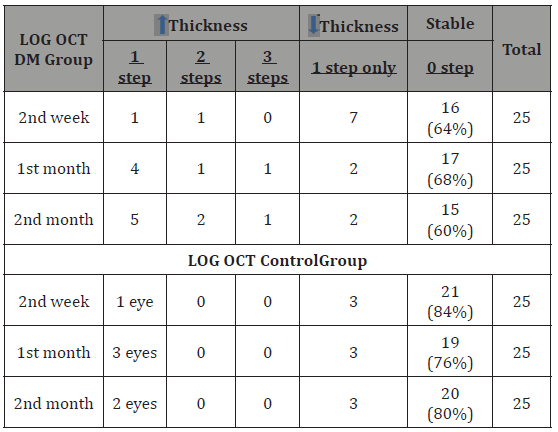
MFT of 64% in diabetic group, 68%, and 60 % of eyes were stable in 2nd week, 1st month &2nd month postoperative respectively. 5 eyes (20%) showed one step deterioration in the second month postoperative. only one eye showed deterioration 3 steps in the 1st month and 2nd month postoperative. In control group: MFT of 84%, 76%, and 80 % of eyes were stable in 2nd week, 1st month &2nd month postoperative respectively. 3 eyes (12%) showed only one step deterioration in the first month postoperative. No one showed deterioration 2 or 3 steps in the 1st or 2nd month postoperative (Table 2).
Table 2: Showed changes occurred at each time interval regarding MFT in both groups.

Comparisons between LOG MAR in both Groups
There was no statistical significance difference in the VA (log MAR) between both diabetic patients and control group either in the 2nd week, 1st or 2nd month postoperative (Table 3).
Table 3: Comparison between diabetics & control group regarding MFT and BCVA.

HS: highly significant; NS: non-significan
Changes occurred at each time interval regarding VA in each group
In the diabetic group 19 (76%), 20 (80%), 22 (88%) eyes showed improvement of their vision at 2nd week, 1st month and 2nd month postoperative respectively. While in the control group most of eyes showed improvement over the follow up period with no one showed deterioration of his vision.
Correlation between the VA (log mar) and MFT (mean foveal thickness)
There was no statistical significance correlation between BCVA (log MAR) and mean foveal thickness in both groups except at the second month in diabetic patients where the BCVA correlated significantly with MFT.
Correlation between BCVA and AGE, DM duration in diabetic patients
Preoperative and postoperative Visual acuity has no statistical significance correlation with Age and DM duration.
Correlation between MFT and AGE, DM duration in diabetic patients
Preoperative and postoperative MFT has no statistical significance correlation with the age and DM duration.
Discussion
Our concern was the diabetic population as Saudi Arabia is considered as the seventh highest rate in the world in terms of diabetes incidence, with about 3.4 million people having been diagnosed with diabetes in 2015. The recent estimate of the disease showed that 24.4% of the adult population is suffering from DM [2]. Among diabetic patients, we were able to analyze subsets of eyes that did not have any intraoperative complications or any preoperative macular edema and to stratify theses eyes according to the severity of preoperative retinopathy and the level of glycosylated hemoglobin. We found that the Mean MFT preoperatively, 2 weeks, 1 month and 2 months postoperatively in diabetic patients with diabetic retinopathy (mild, moderate and proliferative DR) was statistically higher compared to patients without DR. There were statistical improvement of visual acuity after 1 and 2 month postoperatively in patient with no DR than those with DR. this finding is consistent with the intuitive expectation of deficient blood retinal barrier function in those patients with more advanced vascular changes resulting from DR [3]. Many previous studies [4,5] showed the high risk of developing macular edema in patients with diabetes and retinopathy but most of the studies did not exclude the patients with preoperative high macular thickness like ours.
Our results showed that after converting the MFT into Log OCT, the MFT in diabetic and control groups was stable postoperatively without any step deterioration. We believe that our study is the unique to use the Log OCT changes in denoting the macular thickness postoperatively. As it was shown that a 1 step log scale change exceeds the measurement error for all degrees of retinal thickness in current instruments, subsequently, a 1-step log Oct change likely represents a real change beyond variability limits. However, Carl and his colleagues concluded that eyes with DME at the baseline and no history of DME treatment had a 4 % incidence of central – involved ME and eyes with DME at the baseline with history of DME treatment had a 21% incidence at 16 weeks following cataract surgery but they did not record Log OCT changes [6].
Conclusion
Our study is the unique to use the Log OCT changes in denoting the macular thickness postoperatively. Despite the significant increase of the MFT in the diabetic group of our patients in the 1st month and 2nd month postoperative, the Log OCT was stable in the diabetic and control group without any step of deterioration during the study time. There was no statistical significance difference in the VA (log MAR) between both diabetic patients and control group either in the 2nd week, 1st or 2nd month postoperative. In addition, more than 85 % of diabetics’ eyes regain their good vision at the 2nd month post-phacoemulsification.
References
- Ferris FL, Miller Km, Glassman AR, Beck RW (2010) Diabetic retinopathy clinical research network. A proposed method of logarithmic transformation of optical coherence tomography data for use in clinical research. Ophthalmology 117: 1512-1516.
- Ibrahim A Bani (2015) Prevalence, Knowledge, Attitude and Practices of Diabetes mellitus among Jazan Population, Kingdom of Saudi Arabia (KSA). Journal of Diabetes Mellitus 5(2): 115-122.
- Colin J Chu, Robert L Johnston, Charlotte Buscombe, Ahmed B Sallam, Mohamed Q, et al. (2016) Risk factors and incidence of macular edema after cataract surgery: A database study of 81984 Eyes. Ophthalmology 123(2): 316-323.
- Brito PN, Rosas VM, Coentrao LM, Carneiro ÂV, Rocha-Sousa A, et al. (2015) Evaluation of visual acuity, macular status and subfoveal choroidal thickness after cataract surgery in eyes with diabetic retinopathy. Retina 35(2): 294-302.
- Horozoglu FA, Yanyali, Aytug B (2011) Macular thickness after phacoemulsification in previously vitrectomized eyes for diabetic macular edema. Retina 31(6): 1095-1100.
- Carl W baker, Talat Almukhtar, Neil Bressler, Adam R Glassman et al. (2013) Macular edema after cataract surgery in eyes without preoperative central involved diabetic macular edema. JAMA Ophthalmol 131(7): 870-879.
-
Maaly A H A F, Faisal M A, Selwa A A Macular Changes after Uneventful Phacoemulsification in Diabetic Patients in a Tertiary Hospital. W J Opthalmol & Vision Res. 1(1): 2018. WJOVR.MS.ID.000502.
-
Diabetic Patients, Tomography, Cataract Surgery, Macular Edema, Phacoemulsification, Optical coherence tomography, Diabetes mellitus, Best Corrected Visual Acuity, Diabetic Retinopathy, Ocular Surgery, Diabetic Retinopathy, Diabetic’s Eyes
-

This work is licensed under a Creative Commons Attribution-NonCommercial 4.0 International License.


