


 Research Article
A Brief History of Retinal OCT: The Jump from Traditional Machine Learning to Deep Learning CNNs: Diagnosing Key Retinal Layer Integrity, Macula Edema and Treatment
Received Date:September 21, 2026; Published Date:October 06, 2026
Abstract
In the historical line of milestone medical images, from Rontgen’s discovery of X rays in 1895 and its application to locating lead bullets,
swallowed objects, and bone fractures to chest imaging of tuberculous chest lesions and enlarged hearts in 1897 to barium contrast to image the
gastrointestinal tract in 1910, to the first commercially available fundus camera by Carl Zess Company in 1926, the first commercially cleared Optical
Coherence Tomography unit by Humphrey of Carl Zeiss in 1996 ranks as one of the great human achievements. (Dates from Google Gemini)
By 2002 thanks to the Humphrey team at Zeiss and MIT researchers James Fujimoto, David Huang, Eric Swanson, the Stratus OCT became the
first globally adopted retinal OCT imaging device. Owing to the evolved specialized diagnostic tools of eye care: direct and indirect ophthalmoscopy,
slit lamp biomicroscopy and, fluorescein angiography, in 1978-9, the American Academy of Ophthalmology and the American Academy of
Otolaryngology formally separated. (Truhlsen S, Whatever happened to the EENT Specialists? Survey of Ophthalmology, 58(1), 92-94)
The integration of AI and machine learning to retinal OCT, 2003-2010, transformed the imaging device from a manual imaging documentation
device to an automated search engine with biomarking capability. With the addition of deep learning, 2016-2018, most notably CNN modeling,
physiological and pathophysiological pixel segmentation enabled the visualization of individual retinal layers, qualitative fluid amounts and their
localization in and/or near the macula in major diseases such as macular degeneration and diabetic retinopathy. In short order from the qualitative
fluid segmentation in retinal OCT images, U Schmidt-Erfurth and the Vienna Study Center published some of the earliest CNNs automatically
calculating retinal fluid volumes in nanoliters or cubic millimeters./p>
Introduction
Beginnings of OCT
Michel Duguay of AT&T Bell Labs in 1971 first proposed using light echoes to see inside of biological tissue [1,2,3]. Duguay used an ultrafast, laser activated optical shutter to “photograph propagated light pulses of light in flight” [1,2,3]. Even though the velocity of light is about 3 x 10⁸ meters/second, the optical shutter achieved picosecond resolution using a laser pulse to induce birefringence, (the Kerr effect) in a chemical solution of milk and water between crossed polarizers. Thus, he was able to achieve a type of “freeze” to the light motion and capture it with high speed photography. Also, Duguay was able to develop “gated picture ranging”. He gated out unwanted scattered light and recovered the desirable image [1-4].
Based on Duguay’s suggestion “to see inside tissue”, Fujimoto et al applied “nonlinear cross correlation” to measure femtosecond light echoes in an ex vivo bovine eye. A very short laser pulse is split into a reference beam traveling a variable time delay and a second beam directed onto the tissue. The time delay of the reference pulse allows for the sampling of the echo profile of a second harmonic generation and the time delayed pulse is scanned. This results in an A-scan generation. The laser had a 625-nm wavelength and generated 65-fs pulses. This resulted in 15μm axial distance resolution in tissue. Sensitivity of -70 dB or 10-7 of incident intensity were achieved [1,4,5,6,7]. Since most biological tissues like skin have high optical scattering, the eye was used because the anterior segment and vitreous are transparent [7]. Current OCT systems, which use longer 1300-nm wavelengths to reduce attenuation from scattering, can achieve -100 dB or 10-10 incident intensity [1,8].
The first OCT image was from MIT in 1991 and required several minutes to obtain a B-scan comprised of 100 A-scans [1,9,10]. Using fiber optical implementation, high sensitivity from interferometric receivers, and galvanometric steering devices, from laser satellite communication, a 19 inch wide tabletop unit was designed around a slit lamp with scanners to pivot the OCT beam and a visible aiming beam. The latter arrangement could access the pupil and target the desired retinal area [1,10].
In 1993 the first in vivo retinal OCT images were obtained by Swanson et al., MIT, [1, 11] and independently by Fercher, et al. by the Medical University of Vienna [1,12].
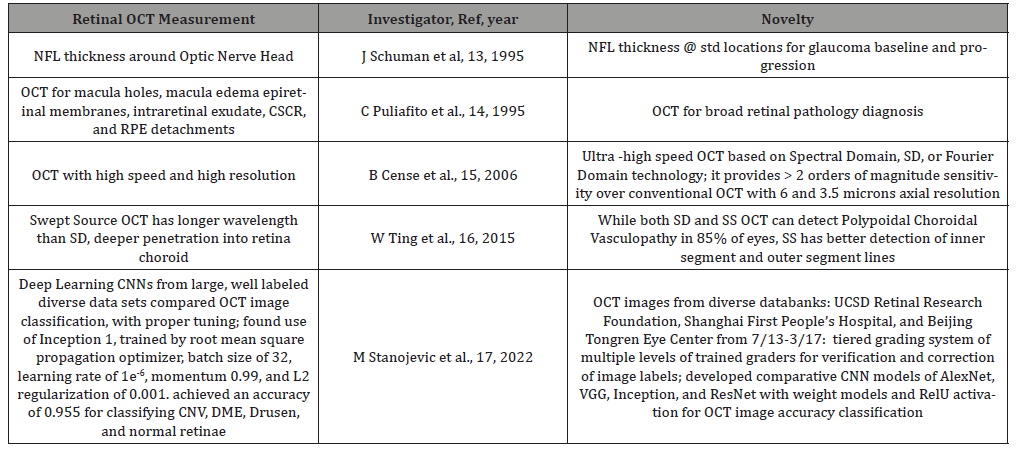
Table 1:Reviews: Noteworthy Evolutionary Retinal OCT Developments: Optical, Patho-Physiological and AI Precision Diagnostic Achievements
Methods
For the first part of the paper, “Beginnings of OCT”, searches were undertaken in Dox gpt, Google Gemini and Microsoft Copilot for papers in Pub Med and Google Scholar contributed by the earliest investigators to the development of retinal OCT and their seminal contributions with regard to either the advancement of the OCT modality or making ocular disease diagnosis. Table 1 was then constructed with the major ophthalmological investigators, the OCT type used, and their specific measurements or ocular disease advances. For the middle part of the paper, the above sources were again queried for references in Pub Med and Google Scholar that from 2015 to 2023 applied techniques of Machine Learning and Deep Learning to retinal OCT to detect or diagnose ocular disease. A second table was then assembled with those techniques and their references.**
For the second third part of the paper, Deep Learning Applications to Retinal OCT images, Dox gpt, Google Gemini, and Microsoft Copilot were asked to search in Pub Med and Google Scholar for references with concise definitions of CNN architectures, AlexNet, VGG, Inception, ResNet, and UNet and NN UNet for an explanatory table 2** to show the evolution of CNN in interrogating retinal OCT images (and other medical images.)
The last part of the paper, (Deep Learning Applications to retinal OCT images and Advances in Deep Learning to measure key portions of retinal layers and location and amount of retinal fluid) is derived from searches with Dox gpt, Google Gemini, and Microsoft copilot for recent references within the last 2-3 years that used queries with CNN, UNet, nnUNet to measure retinal layers and macula fluid. These investigators and those like them laid the foundation for normal as well as pathological retina classification.
Results
Deep Learning Applications to retinal OCT images
The last entry in Table 1, Stanojevic at al. illustrates with its many detailed hyperparameter tunings, the progression of understanding necessary to probe the diverse and varied elements of retinal OCT images. CNN architectures that can classify CNV, choroidal neovascularization, DME, diabetic macular edema, drusen, and normal retinae have special convolving features that are featured in Stanojevic et al in Table 1 [17]. To their credit, Stanojevic et al [17] compared different CNN convolving architectures to diverse but well culled and expert labeled retinal OCT data sets. Thus, their weights used in comparing different CNN model architectures were given appropriate balance and generalizability [17,18].
Table 2:CNN architectures and their evolving adoptive features in the spectrum of medical imaging.
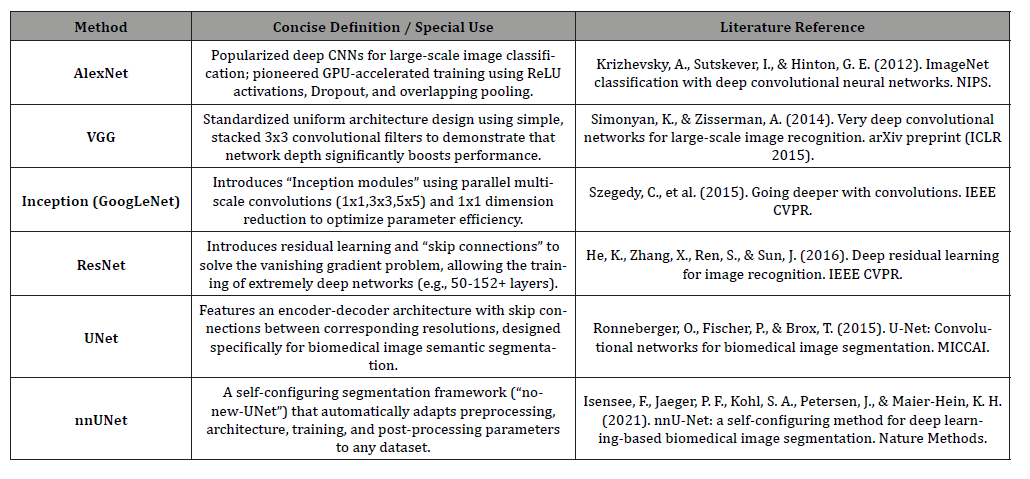
The progressive advancement of AI technology particularly in accurately analyzing OCT retinal images comparable to expert practitioners has elevated it to a significant role in early diagnosis, tracking changes, and informing on the effectivity of treatments in AMD and DME [18].
Initial AI technology grounded in algorithms, mathematical concepts to solve problems e.g. with Machine Learning and Deep Learning [18,19,20] generated models. These models could be used to classify, predict, and generate data on complex retinal disorders. Algorithms using decision trees, random forests, support vector machines were initially used and have since given way largely to CNNs deep learning methods [21] in diabetic retinopathy; [22] in retinal vein occlusion; [23] in Retinopathy of Prematurity and AMD [18].
AI and Advanced Deep Learning for Measuring the Integrity of Key Retinal Layer Levels and Macular Fluid Levels
CNNs and their variants, unlike traditional machine learning modeling, process retinal OCT images directly, minimizing external segmentation and computation errors [18]. Unlike fundus photography, CNN retinal layer segmentation e.g. using branch residual U-shaped networks provide high resolution of key retinal structures illustrating diagnostic deficiencies in the RPE, retinal pigment epithelium (the metabolic and visual regenerative support system of the rods and cones), and EZ, ellipsoid zone, (densely packed with mitochondria that supply energy/waste removal to the rods and cones), and ELM, (links Muller glial cells to rod and cone inner segments for their efficient light capture and support) [18,24,25,37].
Whereas Chan, et al. found that Alzheimer disease [38] is associated with the inner retinal thinning, ganglion cell and inner plexiform layers on SD OCT, Kim, el al. [39], reported that patients with frontotemporal degeneration, FTD, had thinner outer retina than controls, 132 vs 142 μm, p = 0.004, thinner outer nuclear layer, ONL, 88.5 vs 97.9 μm, p = 0.00, and ellipsoid zone (EZ) (14.5 vs 15.1 μm, p = 0.009) than controls, but had similar thicknesses to controls for inner retinal layers [39].
In a large cohort from UK Biobank, Ko et al [40] measured RPE thickness, RPE-Bruch’s membrane by SD-OCT. In people less than 45, with no self- reported ocular disease, diabetes, neurologic disorder, visual acuity of equal to or better than 20/25, the mean was 26.3 μm, standard deviation 4.8μm, at central subfield. It was significantly thinner over age 45, (-0.10μm/year, p < 0.001, Asian ethnicity (-0.45 μm vs. white; P = 0.02), taller height (-0.02 μm/cm; P < 0.001), higher IOP (-0.03 μm/mmHg; P < 0.001), and regular smoking (-0.27 μm vs. nonsmokers; P = 0.02). The authors pointed out that the RPE thickness reduction in higher IOP, intraocular pressure, is noteworthy as a tip off for the diagnosis of glaucoma, and smoking and age RPE thickness reduction may have some relevance in the etiology of early stages of AMD [40].
Wu, et al. [41], in 280 eyes from 140 patients with bilateral large drusen, found that the extent of ELM, EZ, and RPE layer loss over 6 to 36 months, derived in the central 5 mm diameter and within 5 equi- aerial sectors in the central 3.6mm where microperimetry was performed, was significantly changed from baseline in the first 12 months for ELM and EZ loss and at 24 months for RPE. Changes in ELM, EZ and RPE loss were all individually associated with change in mean sensitivity showing greater than or equal to 7 decibels loss from baseline. Measurements of EZ loss had the highest performance for capturing longitudinal change [41].
Segmentation of raw retinal data set images by threedimensional U-Net architecture can create a tissue map with anatomy, pathology and image artifacts [26, 27 28]. Frank, et al. [29] to overcome the time-consuming nature of manual CNN retina layer quantifications, used a High-res SD OCT with imaging at a shorter central wavelength of 850μ. Using a larger spectral bandwidth for better axial resolution, up to 3μ, and increased power from 1.2 to 2.2mW, they were able to improve imaging of in vivo intermediate age related macular degeneration photoreceptor integrity loss compared to standard OCT by 4.6% [29].
Goyanes, et al. [30] to precisely identify subretinal fluid, SRF, regions in retinal OCT images and predict photodynamic therapy, PDT, response for central serous chorioretinopathy, CSCR, [31,32, 33] used a deep learning method.
This deep learning method had the following features: a CNN named nnU-Net to automatically process the vertical and horizontal features of the retinal images, [34], expert labeling of images, and a computer generated computational strategy to separate complete, partial and no resorption of fluid. To assist with the fluid processing, 3D images from 3D Dense Net convolving with 3D features and fusion extraction was used. This was followed by an SVM classifier for images for 3D volume vs images with 3D CSCR fluid regions. 5 different biomarkers from the 3D images plus the same biomarkers from 2D projections of 3D images provided the areas of bounding boxes enclosing CSCR fluid pixel regions. Thus, by 3D contextual information from labeled OCT scans (in a shorter time and with less effort) more accurate models were trained to delineate fluid and predict PDT response [30].
2769 OCT images were collected before PDT treatment from 124 patients with persistent, subretinal fluid for more than six months, total area of RPE alteration greater than 2 disc diameter patients. Each of these images was combined with a corresponding fluid label annotated by an ophthalmologist with over ten years of experience. Data was parsed into 124 3D volumes, each volume representing a different patient, representing a diverse, but representative collection of OCT scans for model training [30].
The dataset used for PDT response prediction contained 216 volumes from 216 chronic CSCR patients treated with half-fluence PDT between Jan 2017 and Dec 2020 in Hospital CLAnico San Carlos, Madrid. Evaluation for SRF resolution of SD-OCT images was with Heidelberg Spectralis; (the volume scan employed was “fast volume”, 25 sections separated by 240 um). Experts evaluated the sections before treatment and at 3 months. This led to 3 groups of patients.
1. 100 patients exhibited complete SRF resolution
2. 66 patients with partial SRF resolution by at least 15%
decrease in baseline SRF height
3. 50 patients with no SRF resorption or less than 15% [30]
NiBabel Library [35] was used to read and write 3D image data, version 4.0.2 Python package. To train and validate the CSCR classification model, the MONAI (Medical Open Network for AI) framework [36] was used in conjunction with the PyTorch platform for medical imaging [30].
For predicting a patient’s response to treatment before initiation, comprehensive categories were explored for achieving the most efficient modeling (of e.g. 3D volumes and fluid regions); 3D Dense Net classifier e.g. uses concatenated 3D volumes and 3D fluid regions as input to predict a corresponding group; other previously trained classifiers took concatenated 3D volume-3D fluid regions and then went through a SVM classifier, (Support Vector Machine learning algorithm to find the optimal decision boundary) for final prediction.
The PDT response predictions using different fluid volume classifiers, e.g. 3D by region, by volume, by fusion or biomarkers, came up to as high a precision* as 0.9283 with 3D + 3D by biomarkers classification group [30]. (*Precision is defined as the accuracy of a model’s positive predictions or the proportion of correct positive identifications out of all the cases that the model labeled as positive: Precision = True Positives divided by True Positives + False Positives)
Goyanes, et al. [30] was not chosen for just a granular review here of AI applications to retinal imaging, but, rather, because it represented a modern exhibit of precise AI retinal 3D OCT image analysis linked to careful fluid measurement in CSCR patients to offer accurate AI predictions of fluid treatment responses from PDT in individual patients.
Conclusion
From its inception into clinical medicine in 2002, retinal OCT imaging, or in the words of its original visionary, Michel Duguay, “photographing light pulses in flight… to see inside of biological tissue” has achieved a lofty trajectory. Not only has OCT imaging co-opted the optical telemetric sophistication of space exploration, but it has also piggybacked the powerful mark-up rights of data science, machine learning, and deep learning. This unique pathway has gifted OCT with the special ability to examine structure and function, mapping ocular disease pathways on the highway of visual science. This achievement rivals any modality known to man. From an in vivo image, OCT travels to the subcellular level, and using AI, it has staggering potential. With the adoption of quantum mechanics in the not too distant rear view mirror, it is not inconceivable that more sophisticated light engineering adaptations will be added to the retinal OCT image and with AI we will be better able to understand phenotypic and genotypic ophthalmic elements and their roles in aging and disease.
Acknowledgments
None.
Conflict of Interest
None.
References
- Fujimoto J, Swanson E (2016) The Development, Commercialization, and Impact of Optical Coherence Tomography. Invest Ophthalmol Vis Sci 57(9): OCT 1-13.
- Duguay MA (1971) Light photographed in flight. American Scientist 59: 551-556.
- Duguay MA, Mattick AT (1971) Ultrahigh speed photography of picosecond light pulses and echoes. Appl Opt 10: 2162-2170.
- Duguay MA, Mattick AT (1971) Ultrahigh speed photography of picosecond light pulses and echoes. Appl Opt 10: 2162-2170. © Optical Society of America.
- Fork RL, Greene BI, Shank CV (1981) Generation of optical pulses shorter than 0.1 psec by colliding pulse mode locking. Appl Phys Lett 38: 671-673.
- Birngruber R, Puliafito CA, Gawande A, Lin WZ, Schoenlein RW, et al. (1987) Femtosecond laser-tissue interactions: retinal injury studies. IEEE J Quantum Electron 23: 1836-1184.
- Fujimoto JG, De Silvestri S, Ippen EP, Puliafito CA, Margolis R, (1986) Femtosecond optical ranging in biological systems. Opt Lett 11: 150-153.
- Fujimoto JG, Brezinski ME, Tearney GJ, et al. (1995) Optical biopsy and imaging using optical coherence tomography. Nat Med 1: 970-972.
- Fujimoto JG, Brezinski ME, Tearney GJ, et al. (1995) Optical biopsy and imaging using optical coherence tomography. Nat Med 1: 970-972.
- Huang D, Swanson EA, Lin CP, et al. (1991) Optical coherence tomography. Science 254: 1178-1181.
- Swanson EA, Izatt JA, Hee MR, et al. (1993) In vivo retinal imaging by optical coherence tomography. Opt Lett 18: 1864-1866.
- Fercher AF, Hitzenberger CK, Drexler W, Kamp G, Sattmann H (1993) In vivo optical coherence tomography. Am J Ophthalmol. 116: 113-114.
- Schuman J, Hee M, Arya A, et al. (1995) Optical coherence tomography: a new tool for glaucoma diagnosis. Curr Opin Ophthalmol 6: 89-95.
- Puliafito C, Hee M, Lin C, et al. (1995) Imaging of macular diseases with optical coherence tomography. Ophthalmology 102: 217-229.
- Cense B, Chen T, Nassif N, Pierce M, Yun S Ultra-high speed and ultra-high resolution spectral-domain optical coherence tomography and optical Doppler tomography in ophthalmology. Bull Soc Belge Ophtalmol.
- Ting D, Cheung G, Laurence L, Yeo I (2015) Comparison of swept source optical coherence tomography and spectral domain optical coherence tomography in polypoidal choroidal vasculopathy. Clin Exp Ophthalmol 43(9): 815-819.
- Stanojević M, Draskovic D, Nikolic B (2023) Retinal disease classification based on optical coherence tomography images using convolutional neural networks, Journal of Electronic Imaging. 2023 spiedigitallibrary.org.
- Gai Y, Xiong F, Xiong J, Chen Z, Lin Y, et al. (2024) Recent advances in the application of artificial intelligence in age-related macular degeneration. BMJ Open Ophthalmology 9: 1.
- Deo RC (2015) Machine Learning in Medicine. Circulation 132: 1920-1930.
- LeCun Y, Bengio Y, Hinton G, et al. (2015) Deep learning. Nature New Biol 521: 436-444.
- Gulshan V, Peng L, Coram M, et al. (2016) Development and Validation of a Deep Learning Algorithm for Detection of Diabetic Retinopathy in Retinal Fundus Photographs. JAMA 316: 2402-2410.
- Nagasato D, Tabuchi H, Ohsugi H, et al. (2018) Deep Neural Network-Based Method for Detecting Central Retinal Vein Occlusion Using Ultrawide-Field Fundus Ophthalmoscopy. J Ophthalmol.
- Taylor S, Brown JM, Gupta K, et al. (2019) Monitoring Disease Progression with a Quantitative Severity Scale for Retinopathy of Prematurity Using Deep Learning. JAMA Ophthalmol 137:1022-1028.
- Wu Z, De Zanet S, Blair J, Guymer R (2025) Loss of OCT Outer Retinal Bands as Potential Clinical Trial Endpoints in Intermediate Age-Related Macular Degeneration. Ophthalmol Sci 5(4): 100769.
- Apostolopoulos S, De Zanet S, Ciller C, et al. (2017) Springer; Quebec City, QC, Canada: 2017. Medical Image Computing and Computer Assisted Intervention− MICCAI 2017: 20th International Conference, Proceedings, Part III 20. Pathological OCT retinal layer segmentation using branch residual U-shape networks.
- De Fauw J, Ledsam J, Romera Paredes, Nikolov S, Ttomasev N (2018) Clinically applicable deep learning for diagnosis and referral in retinal disease. Nature Medicine.
- Ronneberger O, Fischer P, Brox T (2015) U-Net: convolutional networks for biomedical image segmentation. in Navab N., Hornegger J., Wells W., Frangi A. (eds.) Medical Image Computing and Computer-Assisted Intervention – MICCAI 2015. MICCAI 2015. Lecture Notes in Computer Science, vol. 9351: Springer, Cham, Switzerland.
- Çiçek Ö Abdulkadir, A Lienkamp, SS Brox T, Ronneberger O (2016) 3D U-Net: learning dense volumetric segmentation from sparse annotation. in Ourselin, S., Joskowicz, L., Sabuncu, M., Unal, G., Wells, W. (EDS) Medical Image Computing and Computer-Assisted Intervention – MICCAI 2016. MICCAI 2016. Lecture Notes in Computer Science, vol. 9901 (Springer, Cham, Switzerland; 2016).
- Frank S, Reiter G, Leingang O, Fuchs P, Coulibaly L et al. (2024) advances in photoreceptor and retinal pigment epithelium quantifications in intermediate age-related macular degeneration: High-Res Versus Standard SPECTRALIS Optical Coherence Tomography. Retina 44(8): 1351-1359.
- Goyanes E, de Moura J, Fernandez Vigo, Garcia Feijoo J, Novo J (2024) 3D Features Fusion for Automated Segmentation of Fluid Regions in CSCR Patients: An OCT-based Photodynamic Therapy Response Analysis. J Imaging Inform Med 38(1): 476-495.
- Lim J, Glassman A, Aiello L, Chakravarthy U, Flaxel C, et al. (2014) Collaborative retrospective macula society study of photodynamic therapy for chronic central serous chorioretinopathy. Ophthalmology 121(5): 1073-1078.
- Chan W, Lai T, Lai R, Liu D, Lam D (2008) Half-dose verteporfin photodynamic therapy for acute central serous chorioretinopathy: one-year results of a randomized controlled trial. Ophthalmology 115(10): 1756-1765.
- Van Dijk E, Fauser S, Breukink M, Blanco Garavito M, Groenewoud J, et al. (2018) Half-dose photodynamic therapy versus high-density subthreshold micropulse laser treatment in patients with chronic central serous chorioretinopathy: the place trial. Ophthalmology 125(10): 1547-1555.
- Isensee F, Jaeger P, Kohl S, Petersen J, Maier Hein K (2021) nnu-net: a self-configuring method for deep learning-based biomedical image segmentation. Nature methods 18(2): 203-211.
- M Brett, CJ Markiewicz, M Hanke, MA Côté, B Cipollini, et al. (2022) freec84. nipy/nibabel: (4.0.0).
- MONAI Consortium (2023) Monai: Medical open network for ai.
- Mishra N, Kaur G, Saxena S External Limiting Membrane, Photoreceptor Ellipsoid Zone Disruption, and Retinal Pigment Epithelium Alterations in Diabetic Retinopathy. Annals of the National Academy of Medical Sciences (India), 58(2): 119-124.
- Kim B, K Irwin D, Song D, Ebenezer D, Leveque J (2017) Optical coherence tomography identifies outer retina thinning in frontotemporal degeneration. Neurology 89(15): 1604-1611.
- Ko F, Foster P, Strouthidis N, Shweikh Y, Yang Q (2017) Associations with Retinal Pigment Epithelium Thickness Measures in a Large Cohort: Results from the UK Biobank. Ophthalmology 124(1): 105-117.
- Wu Z, De Zanet S, Blair J, Guymer R (2025) Loss of OCT Outer Retinal Bands as Potential Clinical Trial Endpoints in Intermediate Age-Related Macular Degeneration. Ophthalmol Sci 5(4): 100769.
-

This work is licensed under a Creative Commons Attribution-NonCommercial 4.0 International License.