 Research Article
An Invitro Approach in The Treatment of Acanthosis Nigricans: The Role of a Novel Skin Care Formulation
Aishwarya Gangwar1*, Rohit Sharma1, Vipin Sharma2
1,2Fixderma India Pvt Ltd, Sector 54, Gurgaon, Haryana
Aishwarya Gangwar, Fixderma India Pvt Ltd, Sector 54, Gurgaon, Haryana, India.
Received Date: December 10, 2024; Published Date: December 17, 2024
Abstract
Background: Acanthosis nigricans is the main concern behind the darkening of the skin which occurs with the activation of various signaling pathways and factors that regulates the proliferation and differentiation processes of keratinocytes and dermal fibroblasts.
Objective: The aim of the study was to investigate the effect of novel patented skin care formulation’s potential on the IGF-1 factor and on RAR-γ receptors. It is also studied for its role as an antagonist to the AP-1 protein, which contributes to the collagen breakdown.
Methods: Two formulations with different concentrations were tested, and evaluation was conducted using IC50 via MTT assays. Gene and protein expression was examined through western blotting, and PCR analysis was performed using the delta delta Ct method.
Results: The formulation was found to be effective as it downregulates the retinoic acid receptor gamma (RAR gamma) protein in both keratinocyte and dermal fibroblast cell lines. Also, suppresses mRNA transcript levels of AP1 transcription factors (c-jun, c-fos, ATF3) better than old formulation with different concentration.
Conclusion: The findings suggest that the patented formulation effectively suppresses the expression of certain proteins and potentially is a promising approach for treating acanthosis nigricans.
Keywords: Acanthosis Nigricans, Keratinocytes, Dermal fibroblasts, RAR receptors, in-vitro study
Introduction
Acanthosis nigricans (AN) is a symmetrical cutaneous skin disorder characterised by hyperpigmented, hyperkeratotic dark, rough patches or plaques, typically in the intertriginous areas, flexures, neck, elbows, knees or on the dorsal joints of hands/fingers (knuckles). Lesions may develop over the areolae, umbilicus, lips, and rarely on the conjunctiva, affecting both children and adults [1,2]. The skin lesions begin with brown in fair-skinned people or grey pigmentation in dark-skinned people [3]. AN involves the stimulation of epidermal keratinocytes and dermal fibroblast pro liferation, which is triggered by the binding of insulin to the insulin like growth factor receptor (IGF-1). Other proposed mediators include fibroblast growth factor receptor (FGFR) and tyrosine kinase receptors like epidermal growth factor receptor (EGFR) that are present on keratinocytes and dermal fibroblasts. Fibroblasts also produce extracellular matrix (ECM) and type-1 collagen, which play a vital role in tissue scaffolding and serve as a major medium for cell proliferation [4,5]. In case of hyperinsulinemia, direct activation of IGF-1 receptors on skin cells leads to an increase in the blood levels of IGF-1, thus lowering the amounts of IGF- binding proteins 1 and 2 within the circulation, which raises the amount of free IGF-1 in tissues, causing acromegaly. This activity of IGF-1 is regulated by insulin- like growth binding proteins (IGFBPs) [6,7]. Apart from this, RAR- γ (retinoic acid receptor gamma) also regulates the differentiation and proliferation of epidermal keratinocytes as they are expressed on human epidermis. RARs mediates both the primary and secondary effects of the topical retinoids [8,9]. Along with this tyrosinase that involves amino acid tyrosine, which on hydroxylation converts into L-3,4-DOPA that forms DOPA-quinine (dihydroxyphenylalanine -quinine) by oxidation and is further oxidized by a free radical-coupling pathway leading to polymerization of melanin, the main reason for blackening of skin in acanthosis nigricans [10]. In recent times, it has been observed that the transcription factor AP-1 also plays a crucial role in controlling gene activation by interacting with the RARE site that regulates keratinocytes cells differentiation [11]. In this study, we studied the in vitro effect of our novel patented skin care formulation Nigrifix® on the insulin-like growth factor receptors 1 (IGF-1) in the keratinocytes and dermal fibroblasts and its keratinolytic effects on the (retinoic acid receptor gamma) RAR- γ receptor that regulate the differentiation and proliferation of epidermal keratinocytes and also to prove the concept that the formulation acts as an antagonist to activating protein-1 (AP-1). For this, Nigrifix®, two formulations with varying concentration were used and the results obtained were evaluated for the accurate combination of the defined concentration of the ingredients. Evaluation was done through IC50 via MTT assays and gene & protein expression via western blotting. PCR technique was further analysed by the delta delta Ct method.
Materials and Methods
The cell lines, keratinocytes (HaCaT cell line) and dermal fibroblasts (L929 cell line), were purchased from the National Centre for Cell Science (NCCS), Pune, India. The patented Nigrifix® formulation product sample was obtained from Fixderma Pvt. Ltd. (Haryana), India. Trizol reagent and RPMI-1640 medium was purchased from Sigma Aldrich. All other chemicals used were of the analytical grade. The two different concentrations of the sample product were formulated and named as old and new formulations, and the effect of both was studied on keratinocytes and dermal fibroblasts.
Research Design
Cell Culture
Keratinocyte cell line (HaCaT cell line) and dermal fibroblast cell line (L929 cell line) were cultured in tissue grade T25 flask with media (RPMI-1640+10% fetal bovine serum FBS) and incubated at 37°C, maintaining in CO2 incubator for 72 hrs. After attaining 80% confluency, the cells were seeded into 96- well plates at a density of 5000 cells per well for the MTT assay and 2x10⁵ cells into a 6-well plate for western blotting studies and real-time PCR analysis and incubated at 37°C in a CO2 incubator.
Drug treatment
Formulation with varying concentration was dissolved in dimethyl sulfoxide (DMSO) at a stock concentration of 500 mM. Further, the cells were treated at varying concentrations of formulation and were analysed as per assay requirements.
Methods of Evaluation
Analysis by Assays
IC50 Evaluation through MTT assay
For the assessment of data, IC50 evaluation through MTT assay was carried out as per the standard procedure. The half maximal inhibitory concentration (IC50) is a measure of the dose of a drug that causes 50% inhibition in a tested population after a specified test duration. Therefore, it is frequently used as a general indicator of an ingredient’s effectiveness [12]. The IC50 values were studied for both the old and new formulations. Firstly, for keratinocytes, and secondly for dermal fibroblasts, the IC50 value was studied. For the MTT assay, reagent preparation was done under the aseptic and sterile conditions. 1mg/mL MTT solution was prepared and was sterilized. Cell culture media was prepared by adding 10% FBS and antibiotic solution (100 IU/ml penicillin and 100 μg/ml streptomycin) to Minimum Essential Medium (MEM) and Dulbecco’s Modified Eagle Medium (DMEM) media buffered with sodium bicarbonate. Cell suspension was then prepared by enzymatic digestion (using 0.25 % trypsin EDTA). Cells were resuspended in culture medium and the cell density was adjusted to 1x10⁵ cells/ml. Culture media (100 μl) containing cell suspension of 1x10⁵ cells/ml (=1x10⁴ cells/well) was dispensed into wells of a 96-well Petri dish. Cells were then incubated for 24 hr under standard conditions (5% CO2 concentration, 37°C) inside the incubator. The addition of 100 μl of treatment media per well containing an appropriate concentration of sample extract, or a negative control (NC) or a positive control (PC) or nothing but blank was done [13]. After 24hr of treatment, each plate was examined under phase contrast microscope to identify the systematic cell seeding errors and growth characteristics of control and treated cells. Further, absorbance values were recorded for each well at a wavelength of 570 nm with a reference wavelength of 630 nm, and cell viability/proliferation was calculated using suitable formulas or software [14].
Data analysis was done using:
% cell viability = 100 x (OD 570test / OD 570untreated blank)
OD 570 test = Mean value of 100% extract of test sample
OD 570 test= Mean value of untreated blank
Relative protein expression evaluation
Evaluation of relative protein expression through western blotting was performed as per the standard procedure. For the extraction of proteins from adherent cells by gel electrophoresis, the medium in culture dishes with cells was discarded, and cells were washed using ice-cold phosphate buffered saline (PBS). After this, PBS was discarded, and ice-cold lysis buffer was added. Cells were scrapped using a cold plastic cell scraper. After that, cells were collected in microcentrifuge tubes and were agitated for 30 min at 4°C. Centrifugation was done at 16,000 x g for 20 min at 4 °C. Supernatant (or protein mix) was transferred to a fresh tube and stored on ice or frozen at -20°C or -80°C. After separating the protein mixture, it is then transferred to a membrane. The transfer is done using an electric field-oriented perpendicular to the surface of the gel. The western blot was originally intended to provide a yes/no answer about the presence of the target protein in a protein sample. This qualitative method confirms the presence of target bands by the simple visual assessment [15,16].
Relative mRNA expression evaluation
Relative mRNA expression evaluation using real-time PCR was done. Quantitative real-time polymerase chain reaction (qPCR) has been extensively used to quantify the gene expression levels. The 2-ΔΔCT method is the method of relative quantification that is most frequently found in popular software packages for qPCR experiments. The threshold cycle (CT) is the cycle at which the fluorescence level reaches a certain amount (the threshold). This method directly uses the CT information generated from a qPCR system to calculate relative gene expression in target and reference samples, using a reference gene as the normalizer [17]. From the cells, RNA was isolated post-drug treatment, and qPCR data was analysed. Assays were done in triplicates, and standard deviations were calculated (shown as error bars on graphical presentation of data) throughout the study. RNA was isolated as per Trizol reagent. qPCR data was analysed using the (delta delta Ct method) using Applied Biosystems - Real Time PCR.
Results and Discussion
IC-50 evaluation in keratinocytes (HaCaT line) by MTT assay
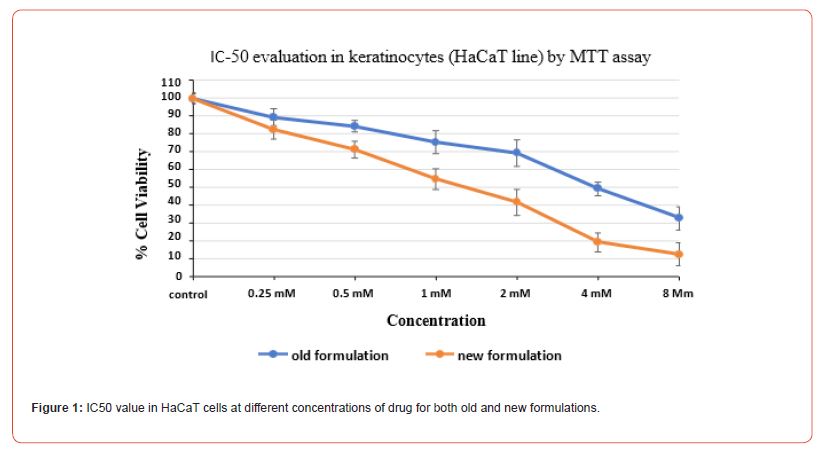
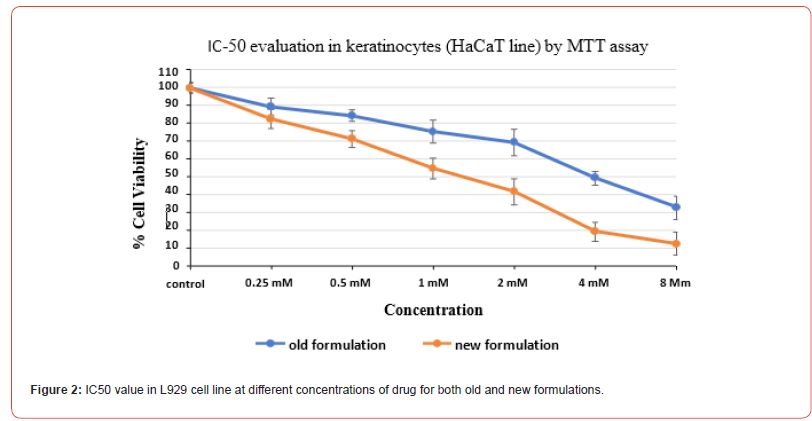
The IC50 evaluation through MTT assay was done post 48 hr of drug treatment for both old and new formulations with the varying concentrations for both keratinocytes (HaCat cell line) and dermal fibroblasts (L929 cell line), and the values were obtained. These values depict the measure of a formulation effectiveness. The old formulation showed IC50 value at 2.5 mM while the new formulation showed IC50 value at 1.4 mM concentration in HaCat cell line (Figure 1). While in L929 cell line, old formulation showed IC50 value at 6.8 mM while the new formulation with the different concentration showed IC50 value at 2.8 mM concentration (Figure 2).
Evaluation of relative protein expression
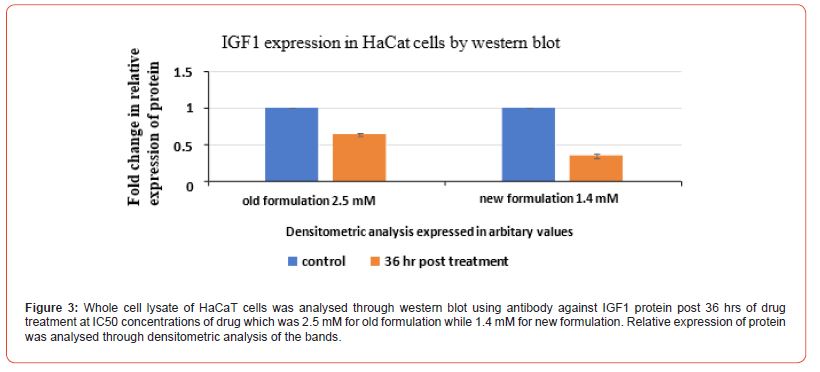
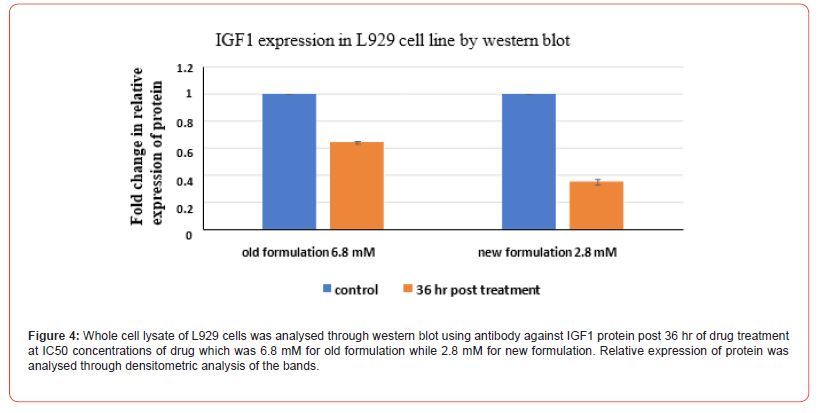
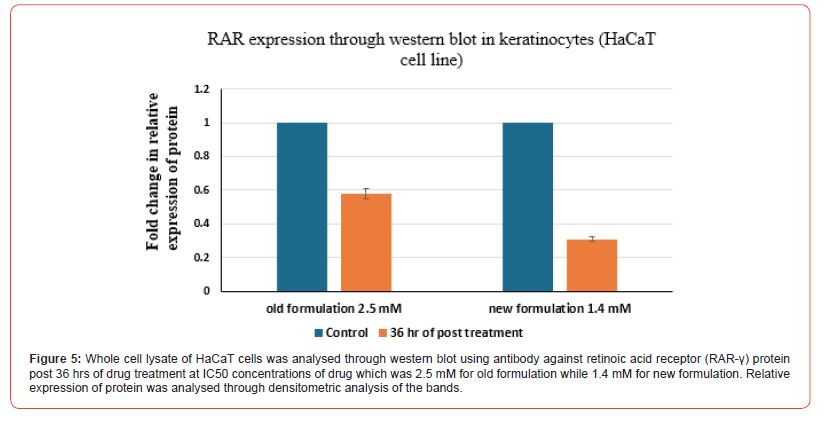
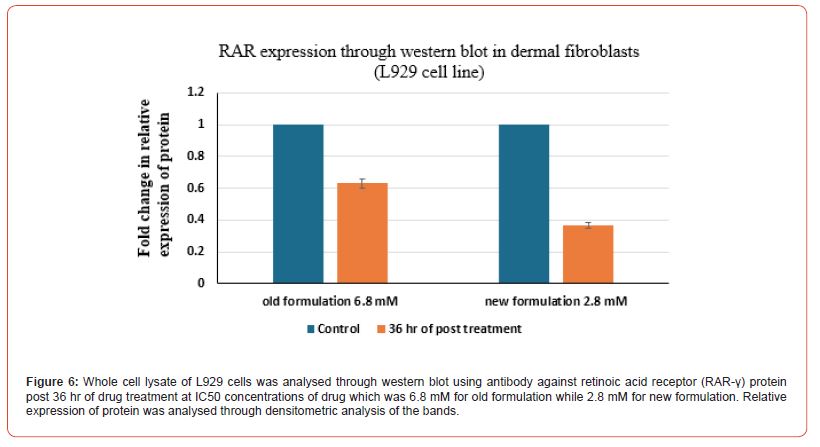
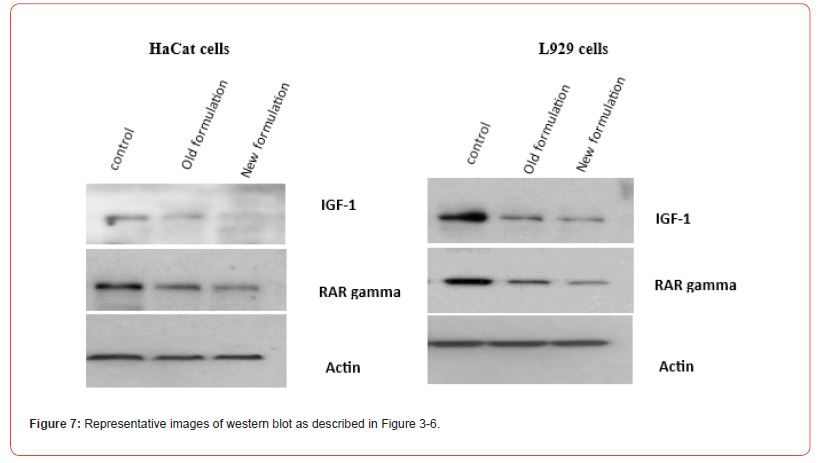
Evaluation of relative expression of protein i.e. of IGF 1 and RAR-γ was performed. Whole cell lysate of HaCaT cells and L929 cells was analysed through western blot technique using against IGF1 protein. Firstly, for HaCat cells, the values were taken for both the control group and post 36 hrs of drug treatment group at the IC50 value concentrations of both old and new formulations which was 2.5 mM for old formulation while 1.4 mM for new formulation in the case of HaCat cell line (Figure 3) and 6.8 mM for old formulation while 2.8 mM for new formulation in the case of L929 cell line (Figure 4). Relative expression of protein was analysed through densitometric analysis of the bands. Secondly, for RAR expression evaluation, whole cell lysate of HaCaT cells and L929 cells was analysed through western blot technique using antibody against retinoic acid receptor gamma (RAR-γ) protein. Firstly, for HaCat cells, the values were taken for both the control group and post 36 hrs of drug treatment group at IC50 value concentrations of both old and new formulations (Figure 5) and same as for L929 cell lines (Figure 6) for both the formulations. After 36 hrs of treatment, the fold change in relative expression of protein was seen both in the case of keratinocytes and dermal fibroblasts and the value was significantly reduced in both the case of new formulation confirming the decline in IGF1 expression. Thus, reducing the proliferation process and the acanthosis nigricans condition. Also, for RAR-γ protein expression, after 36 hrs of treatment, the fold change in relative expression of protein was seen both in the case of keratinocytes and dermal fibroblasts and the value was significantly reduced in both the case of new formulation confirming the decline in RAR-γ protein expression. (Figure 7) represents the full-length images obtained for the control group, old formulation and new formulation for both HaCat cells and L929 cells showing the results obtained in each lane when the treatment was done using each antibody on the formulation. The thickness of the band obtained is proportional to the relative amount of that only protein in that sample [18].
Evaluation of relative mRNA expression
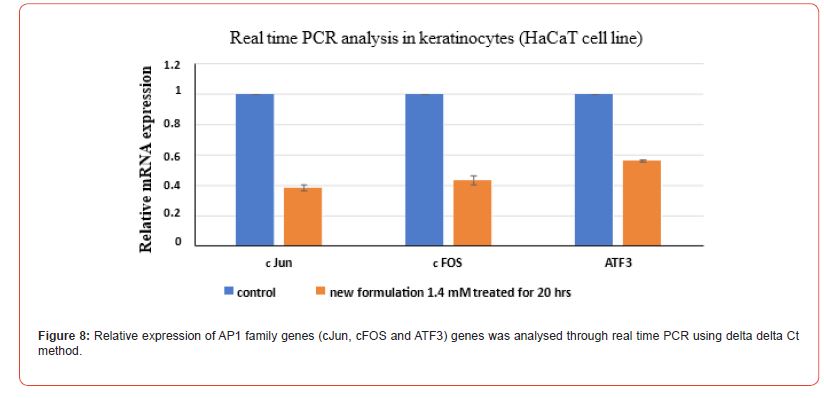
Relative mRNA expression evaluation using real-time PCR was done using delta delta Ct method. RNA was isolated from HaCaT cells post 20 hr of drug treatment at IC50 concentration of new formulation which was 1.4 mM. (Figure 8) depicts the real time PCR analysis in keratinocytes (HaCaT cell line). Relative expression of AP1 family genes (cJun, cFOS and ATF3) genes was analysed. The results obtained for new formulation lower down the AP1 genes expression confirming that the novel formulation acts as an antagonist on AP-1 protein that regulates the keratinocytes differentiation pathway.
Conclusion
Acanthosis nigricans is an epidermal hyperkeratosis condition caused by the factors that stimulate the epidermal keratinocytes and dermal fibroblasts proliferation. Insulin like growth factor receptors (IGF-1) are another major contributing factor triggering proliferation of keratinocytes and fibroblasts. Therefore, the present study results indicate that treatment with the patented formulation Nigrifix® (with novel combination) has a better suppressive effect on IGF-1 protein expression on both keratinocytes and dermal fibroblasts cell lines. Also, it indicates more profound downregulation of retinoic acid receptor gamma (RAR-γ) protein in keratinocyte and dermal fibroblast cell lines and suppresses mRNA transcript levels of AP1 transcription factors (c-jun, c-fos, ATF3 etc) better confirming that it acts as an antagonist on the AP-1 protein. AP1 transcription factors are key regulators of epidermal keratinocyte survival and differentiation as they regulate competing pathways (i.e., proliferation, apoptosis, and differentiation), the synthesis of metalloproteinase, which is responsible for collagen breakdown.
Funding
The authors received no financial support for the publication of this article.
Conflict of Interest
The Authors Declare No Conflicts of Interest.
References
- Schwartz RA (1994) Acanthosis nigricans. J Am Acad Dermatol pp: 1–19.
- Phiske M (2014) An approach to acanthosis nigricans. Indian Dermatol Online J PP: 239-249.
- Judge MR, Mc Lean WHI, Munro CS (2010) Disorders of Keratinization. In Rook’s Textbook of Dermatology, Wiley PP: 1–122.
- Torley D, Bellus GA, Munro CS (2002) Genes, growth factors and acanthosis nigricans. British Journal of Dermatology 147(6): 1096–1101.
- Hermanns Le T, Scheen A, Pierard GE (2004) Acanthosis Nigricans Associated with Insulin Resistance. Am J Clin Dermatol 5(3): 199-203.
- Fu J, Zhao Y, Wang T, Zhang Q, Xiao X (2019) Acanthosis nigricans in a Chinese girl with FGFR3 K650 T mutation: a case report and literature review. BMC Med Genet 20(1): 8.
- Guenot LM, Aubert H, Isidor B, Toutain A, Mazereeuw-Hautier J, et al. (2019) Acanthosis nigricans, hypochondroplasia, and FGFR 3 mutations: Findings with five new patients, and a review of the literature. Pediatr Dermatol 36(2): 242–246.
- Kuroki R, Sadamato Y, Imamura M, Abe Y, Higuchi K, et al. (1999) Acanthosis nigricans with Severe Obesity, Insulin Resistance and Hypothyroidism: Improvement by Diet Control. Dermatology 198(2): 164–166.
- Tsuji M, Shudo K, Kagechika H (2017) Identifying the receptor subtype selectivity of retinoid X and retinoic acid receptors via quantum mechanics. FEBS Open Bio 7(3): 391–396.
- Rathee P, Kumar S, Kumar D, Kumari B, Yadav S (2021) Skin hyperpigmentation and its treatment with herbs: an alternative method. Futur J Pharm Sci PP: 132.
- Dong H, Zhu G, Tamada K, Chen L (1999) B7-H1, a third member of the B7 family, co-stimulates T-cell proliferation and interleukin-10 secretion. Comparative Study 5(12): 1365–1369.
- He Y, Zhu Q, Chen M, Huang Q, Wang W, et al. (2016) The changing 50% inhibitory concentration (IC 50) of cisplatin: a pilot study on the artifacts of the MTT assay and the precise measurement of density-dependent chemoresistance in ovarian cancer. Oncotarget 7(43): 70803-70821.
- Hussein HA, Kassim MNI, Maulidiani M, Abas F, Abdullah MA (2022) Cytotoxicity and 1H NMR metabolomics analyses of microalgal extracts for synergistic application with Tamoxifen on breast cancer cells with reduced toxicity against Vero cells. Heliyon 8(3): e09192.
- Goodwin AM (2007) In vitro assays of angiogenesis for assessment of angiogenic and anti-angiogenic agents. Microvasc Res 74(2-3): 172–183.
- Pillai-Kastoori L, Schutz-Geschwender AR, Harford JA (2020) A systematic approach to quantitative Western blot analysis. Anal Biochem 593: 113608.
- Yang PC, Mahmood T (2012) Western blot: Technique, theory, and trouble shooting. N Am J Med Sci 4(9): 429-434.
- Rao X, Huang X, Zhou Z, Lin X (2013) An improvement of the 2ˆ (-delta delta CT) method for quantitative real-time polymerase chain reaction data analysis. Biostat Bioinforma Biomath 3(3): 71-85.
- Shen J, Person MD, Zhu J, Abbruzzese JL, Li D (2004) Protein Expression Profiles in Pancreatic Adenocarcinoma Compared with Normal Pancreatic Tissue and Tissue Affected by Pancreatitis as Detected by Two-Dimensional Gel Electrophoresis and Mass Spectrometry. Cancer Res 64(24): 9018–9026.
-
Aishwarya Gangwar*, Rohit Sharma, Vipin Sharma. An Invitro Approach in The Treatment of Acanthosis Nigricans: The Role of a Novel Skin Care Formulation. World Journal of Dermatology & Cosmetics. 1(4): 2024. WJDC.MS.ID.000516.
-
Acanthosis nigricans, Dermal Fibroblasts, hyperinsulinemia, Keratinocytes, Dark-skinned, Pigmentation, Skin cells, Hyperinsulinemia
-

This work is licensed under a Creative Commons Attribution-NonCommercial 4.0 International License.


