 Research Article
Prediction of Aulacaspis Tubercularis Newstead (Hemiptera: Diaspididae) Populations Using RCP Scenarios in Luxor Governorate, Egypt
Bikila Tesfa Kebeda*1, Temesgen Olani Abdis1 and Abera Jaleta Berkessa2
1Plant Protection Department, Faculty of Agriculture and Natural Resources, Aswan University, Egypt
2Scale insects and Mealybugs Research Department, Plant Protection Research Institute, Egypt
Moustafa MS Bakry, Scale insects and Mealybugs Research Department, Plant Protection Research Institute, A.R.C Dokii, Giza, Egypt.
Received Date: July 08, 2019; Published Date: July 16, 2019
Abstract
The present work was carried out to study the effect of some climatic factors on the population density of the white mango scale insect, Aulacaspis Tubercularis on mango trees during three time series (2011-2040, 2041-2070 and 2071-2100) under four Representative Concentration Pathway (RCP) scenarios (2.6, 4.5, 6.0 and 8.5) as compared with the current population of the pest (average of population density for two years of 2017 and 2018) at Esna district, Luxor Governorate, Egypt. Monthly estimations of total A. tubercularis population indicated the presence of four peaks of insect abundance per year. The means of solar radiation were entirely above the optimum range for activities of nymphs, adult females and total population of A. tubercularis and solar radiation was the most effective variables in population changes by 39.31, 39.38 and 43.50% for nymphs, adult females and total population of A. tubercularis during the base year data, respectively. The percentages of explained variance (E.V.%) indicated that the combined effect of these climatic factors viz., maximum temperature, minimum temperature and solar radiation were responsible for 82.37, 77.14 and 85.59 % of the population changes of nymphs, adult females and total population of this scale insect, respectively.
The obtained results revealed the all expected values for numbers of nymphs, adult females and total population of insect during the all different time series under all different RCPs scenarios were smaller in comparison to the current population of insect. Expected total population of insect will be smaller at time series of (2071-2100) as compared with the two-time series of (2011-2040) and (2041-2070) under the scenarios of RCPs (2.6, 4.5, 6 and 8.5). Also, the time series of (2071-2100) exhibited higher percentages of decreasing of the number of nymphs, adult females and total population with averages of (70.37, 48.38 and 60.33%, respectively) as compared to the time series of 2041-2070 (63.01, 47.10 and 55.74%) and the time series of 2011-2040 (56.04, 44.58 and 50.81%, respectively). Furthermore, the RCP 2.6 scenario exhibited the highest population density of nymphs, adult females and total population A. tubercularis and the lowest decreasing percentage for population density of different stages of A. tubercularis as compared with the other RCPs during all different time series.
Keywords: RCPs, Aulacaspis Tubercularis; Seasonal activity; Climate change scenarios; Mango
Introduction
Mango trees are subjected to infestation by different pests. Among these pests, the white mango scale insect, Aulacaspis tubercularis Newstead (Heimptera: Diaspididae) is considered one of the most destructive pests of mango trees [1]. This hard scale insect is now widespread in many mango-growing countries. This pest injures the shoots, twigs, leaves, branches and fruits and sucks the plant sap with its mouth parts, causing thereafter deformations, defoliation, drying up of young twigs, dieback, poor blossoming, death of twigs by the action of the toxic saliva and so affecting the commercial value of fruits and their validity for exportation potential especially to late cultivars where it causes conspicuous pink blemishes around the feeding sites of the scales [2,3]. The subsequent damage leads to considerable quality and quantity yield losses and also decrease the marketing value of the fruits. A characteristic symptom of infestation by A. tubercularis is the appearance and accumulation of its scales on attacked mango tree parts [4].
To develop an effective control against A. tubercularis, it is necessary to know its bio-ecology including population dynamics and climatic factors influencing its life span and the densities of different phonological stages. Temperature has a direct influence on insect activity and rate of development. According to Zalom and Wilson [5] the rate of development is based on the accumulation of heat measured in physiological rather than chronological time. Dent [6] stated that the seasonal phenology of insect numbers, the number of generations, and the level of insect abundance at any location are influenced by the environmental factors at that location.
Climatic changes have become one of the major challenges for mankind and the natural environment. Rise upraises in temperature and increased incidence of extreme weather events can directly influence insects by affecting their rate of development, reproduction, distribution, migration and adaptation. In addition, indirect effects can occur through the influence of climate on the insect’s host plants, natural enemies and interspecific interactions with other insects [7-10].
Climatic changes scenario development is a rapidly evolving field, but those are less significant than the fundamental change in climate change modeling (including socioeconomic) brought about by the shift from using IPCC SRES scenarios to representative concentration pathways (RCPs) that “will provide a framework for modelling in the next stages of scenario-based research” [11]. AR5 uses four Representative Concentration Pathway (RCP) scenarios with widely differing emission pathways, reflecting different levels of ambition in tackling climate change. The lowest, RCP 2.6 is a very strong mitigation scenario, with CO2 levels peaking by 2050 at ~443 ppmv. RCP 4.5 has a continuing rise in CO2 concentrations to the end of the century, when they reach ~538 ppmv. RCP6.0, increase CO2 concentrations to reach ~670 ppmv by 2100. RCP 8.5 increase CO2 concentration reaching 936 ppmv by 2100 [12]. The RCP 8.5 was developed using the MESSAGE model and the IIASA Integrated Assessment Framework by the International Institute for Applied Systems Analysis (IIASA), Austria. This RCP is characterized by increasing greenhouse gas emissions over time, representative of scenarios in the literature that lead to high greenhouse gas concentration levels [13]. Whereas, RCP 6.0 was developed by the AIM modeling team at the National Institute for Environmental Studies (NIES) in Japan. It is a stabilization scenario in which total radiative forcing is stabilized shortly after 2100, without overshoot, by the application of a range of technologies and strategies for reducing greenhouse gas emissions [14,15]. While, RCP 4.5 was developed by the GCAM modeling team at the Pacific Northwest National Laboratory’s Joint Global Change Research Institute (JGCRI) in the United States. It is a stabilization scenario in which total radiative forcing is stabilized shortly after 2100, without overshooting the long-run radiative forcing target level [16,17]. Furthermore, RCP 2.6 was developed by the IMAGE modeling Assessment Agency. The emission pathway is representative of scenarios in the literature that lead to very low greenhouse gas concentration levels. It is a “peak-and-decline” scenario; its radiative forcing level first reaches a value of around 3.1 W/m2 by mid-century and returns to 2.6 W/m2 by 2100. In order to reach such radiative forcing levels, greenhouse gas emissions (and indirectly emissions of air pollutants) are reduced substantially, over time [18].
In addition, such changes in climatic conditions could profoundly affect the population dynamics and the status of insect pests of crops [19]. These effects could either be direct, through the influence that weather may have on the insect’s physiology and behavior [8,20], or may be mediated by host plants, competitors or natural enemies [7].
The objective of this study is to predict the populations of A. tubercularis under four Representative Concentration Pathway (RCP) scenarios (RCP 2.6 – RCP 4.5 – RCP 6.0 and RCP 8.5) during three time series (2011-2040, 2041-2070 and 2071-2100 years) as compared with the current population of pest (average of population density for two years 2017 and 2018). As well as, the effect of meteorological data viz., maximum temperature, minimum temperature and solar radiation on the current pest population of A. tubercularis.
Material and Methods
The population fluctuations of white mango scale insect, A. tubercularis on mango trees were carried out at half-monthly intervals at Esna district, Luxor Governorate during two successive years from January 2017 to December 2018. An orchard of about a feddan was selected for sampling during the studied period. Four mango trees being almost similar and as uniform as possible in size, age (10 years), height, vegetative growth and received the same horticultural practices, were selected and labeled. These mango trees were not exposed for any chemical control measures before and during the period of investigation.
Regular half-monthly random samples of leaves were picked from different directions and heights of tree with rate of 60 leaves per tree. The total number of picked leaves was from 11520 (4 trees x 4 directions x 3 levels x 5 leaves x 48 dates) over the two-years period was taken from the terminal shoots of the tree. Collected leaves were put in polyethylene bags and transferred to laboratory for inspection using a stereomicroscope. Numbers of alive insects on upper and lower surfaces of mango leaves were individually sorted into immature stages (nymphs) and mature stages (adult females) and then were counted and recorded together in each date of inspection.
Monthly mean numbers of A. tubercularis per leaf were calculated during the two years of study to express the current population size of pest. The half-monthly counts of maximum and minimum air temperatures and solar radiation at Luxor governorate during 2017 and 2018 years were obtained from the Central Laboratory for Agricultural Climate, Agriculture Research Center, Ministry of Agriculture at Giza. The altitude, latitude and longitude of this weather region of Luxor were 99 m, 25.67 °N and 32.71 °E, respectively.
Representative Concentration Pathway (RCP) scenarios
Clima Scope is a data visualization engine providing maps and data on projected climate changes for a range of global greenhouse gas emission scenarios. Outputs are stamped with metadata on which GCM was used, which carbon cycle was used, which emission scenario was used, and the source of data in order to provide traceability (Table 1). Data came from peer-reviewed models linked together within the Community Integrated Assessment System (CIAS) developed at the Tyndall Centre for climate change’s research within the School of Environmental Sciences at the University of East Anglia [21-23]. Data of maximum and minimum air temperatures and solar radiation during three time series (2011-2040, 2041-2070 and 2071-2100) under different RCPs scenarios (2.6, 4.5, 6.0 and 8.5) were obtained from the Clima Scope internet website ( http://climascope.tyndall.ac.uk/).
Table 1:Description of IPCC representative concentration pathway (RCP) up to year 2100.

Statistical analysis of data was carried out with Computer system using [24] and SPSS [25]. The data obtained were statistically analyzed by using different models of correlation and regression to find out the relationships between different stages of A. tubercularis population (dependent variable) and climatic factors (independent variable). As well as, the percentage of explained variance (%E.V.) was calculated to study the combined effect of these climatic factors on population density of different stages of A. tubercularis. Also, the t-test was used to establish whether a significant difference exists between the current insect population (average of both years of 2017 and 2018) and the expected populations during three time series (2011-2040, 2041-2070 and 2071–2100 years) under different RCPs scenarios (RCP 2.6, RCP 4.5, RCP 6.0 and RCP 8.5) at P ≤ 0.05 were estimated.
The percentage of decrease in numbers of insect was calculated as formula:
% Decrease = ((A-B)/A) x 100
Where, A = Current population and B = Expected population
Averages of different stages of insect population and climatic factors were calculated by using Excel sheets and shown graphically.
Results and Discussion
\Trend of current and future climatic conditions in Luxor region: Maximum air temperature
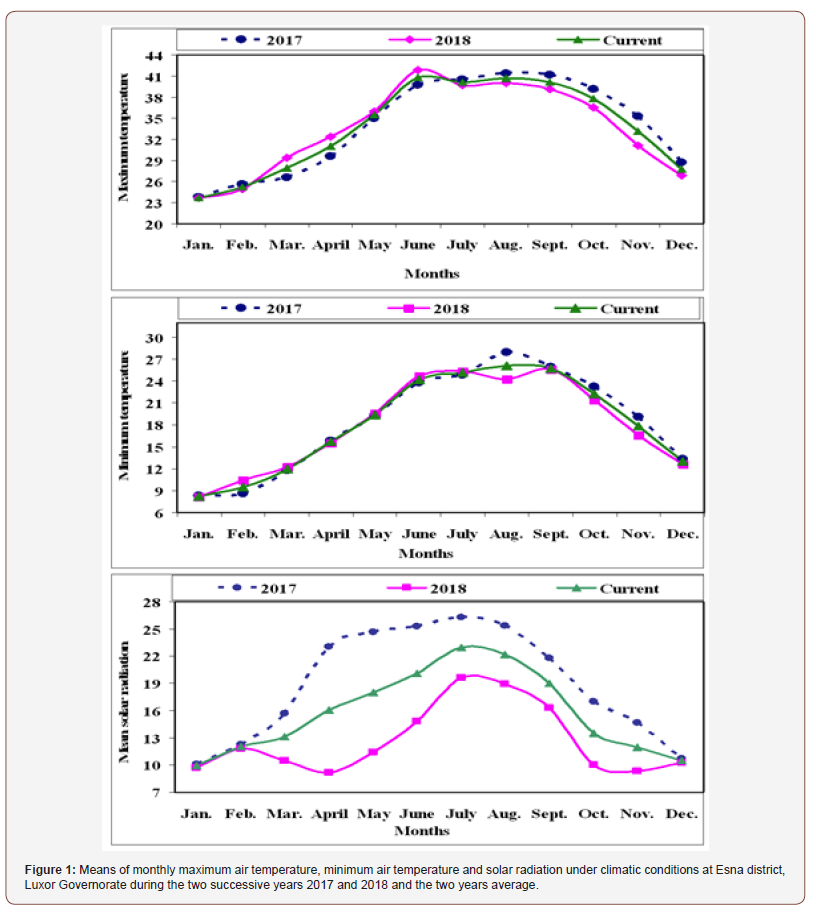
The means of the monthly maximum temperature were recorded from January 2017 till December 2018 (Figure 1). The highest monthly mean maximum temperature values were recorded from June to September months ranged from (39.74 to 41.36 °C and 39.17 to 41.91°C) during the two studied years, respectively. While, it was the lowest (23.79 - 25.59 °C and 23.65 - 24.93 °C) during January and February months for both the two years, respectively (Figure 1).
Figure 2 shows the average annual trend of the mean maximum air temperature under current climate (average of 2017 and 2018) and future periods (2011-2040, 2041-2070 and 2071-2100 years). Data showed that the annual maximum temperature increased for all RCPs scenarios under all-time series (2011-2040, 2041-2070 and 2071-2100 years) as compared with current annual maximum temperature. The highest annual maximum air temperature values were found under RCP 8.5 scenario during all-time series (2011- 2040, 2041-2070 and 2071-2100 years). While, the lowest annual maximum air temperature values were found under the RCP 2.6 scenario when the comparison was between different scenarios during three time series. The results indicated also that the range of annual maximum air temperature values ranged from 35.88 °C under RCP 2.6 at 2011-2040 to 39.07 °C under RCP 8.5 at (2071- 2100). Also, the difference between RCPs scenarios was less than 1.06 °C during the short-term time series (2011-2040), while the differences increased during the long-term time series (2071- 2100) about 1.99 °C (difference between RCP 2.6 and RCP 8.5 at 2071-2100). This result was agreeable with IPCC (2007) which reported that the global surface air temperature increased from 1850 to 2005 by 0.76 °C and the linear warming trend over the last 50 years is determined by 0.13 °C per decade.
Minimum air temperature: Figure 1 showed that the lowest monthly mean minimum temperature values were recorded during the winter months (January and February) in all studied years. While, the highest values were recorded from July to September months.
Figure 2 shows the average annual trend of minimum air temperature under current (average of the two years) and the future conditions (2011-2040, 2041-2070 and 2071-2100) for Luxor Governorate, Egypt. The lowest average annual minimum temperature was found during the current conditions as compared with the future periods. The projected annual minimum air temperature values ranged between 19.47 °C under RCP 2.6 at 2011-2040 and 20.96 °C under RCP 8.5 at 2071-2100. The highest annual minimum air temperature values were found under RCP 8.5 scenario during all-time series (2011-2040, 2041-2070 and 2071- 2100). While, the lowest annual minimum air temperature values were found under the RCP 2.6 scenario. Also, the difference between RCPs scenarios was higher than 0.49 °C during the short-term time series (2011-2040), while the differences increased during the long-term time series (2071-2100) being about 0.99 °C (difference between RCP 2.6 and RCP 8.5 at 2071-2100). These results are in line with the report of [26] which mentioned that the temperature will increase by uneven values in different climatic regions under climate change. Abdrabbo et al. [27] reported that Upper Egypt had the highest average annual minimum air temperature, under current (1971-2000) and future (2011-2040, 2041-2070 and 2071-2100) conditions.
Solar radiation: Figure 1 indicated that the highest monthly mean solar radiation values were recorded during the summer months (from June to August) during the two years of study. While, the winter months (December - February) had the lowest values of solar radiation. Figure 2 illustrated the average monthly trend of mean solar radiation under current climate (average of solar radiation during the two years 2017 and 2018) and future conditions (2011-2040, 2041-2070 and 2071-2100). The annual solar radiation increased for all RCPs scenarios under all-time series (2011-2040, 2041-2070 and 2071-2100 years) as compared with current annual solar radiation. Also, the highest annual solar radiation value was found under RCP 8.5 scenario for all-time series (2011-2040, 2041-2070 and 2071-2100 years). While, the lowest value was found under the RCP 2.6 scenario.
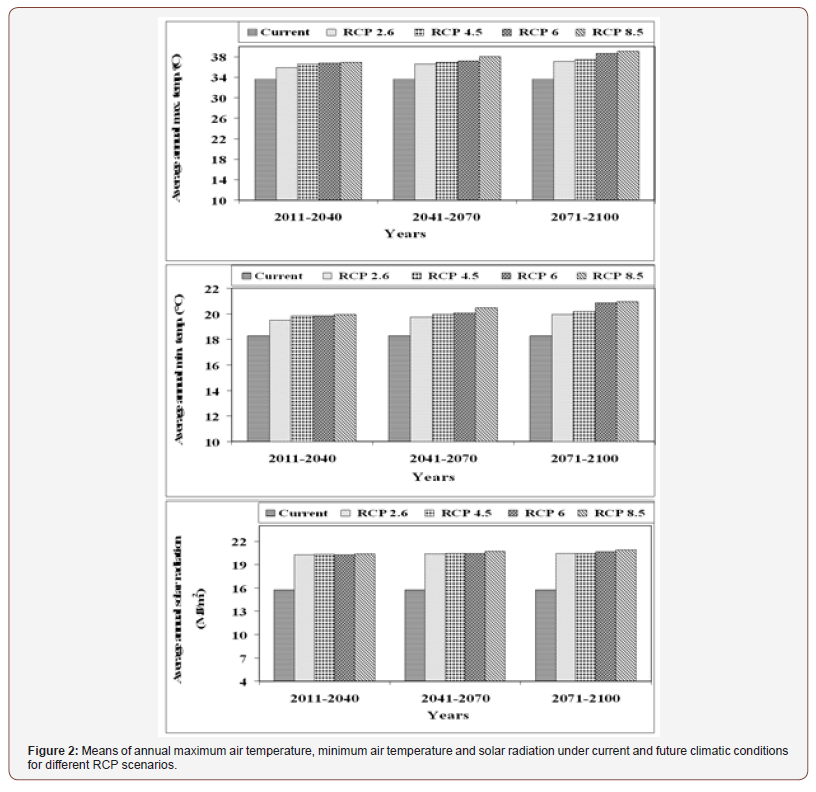
The results also indicated that the annual solar radiation values ranged between 20.31 MJ/m2 under RCP 2.6 at 2011-2040 and 20.90 MJ/m2 under RCP 8.5 at (2071-2100). Also, the difference between RCPs scenarios was less than 0.08 MJ/m2 during the shortterm time series (2011-2040), while the differences increased lightly during the long-term time series (2071-2100) to reach about 0.49 MJ/m2 (difference between RCP 2.6 and RCP 8.5 during 2071-2100).
Seasonal fluctuations in population of A. tubercularis
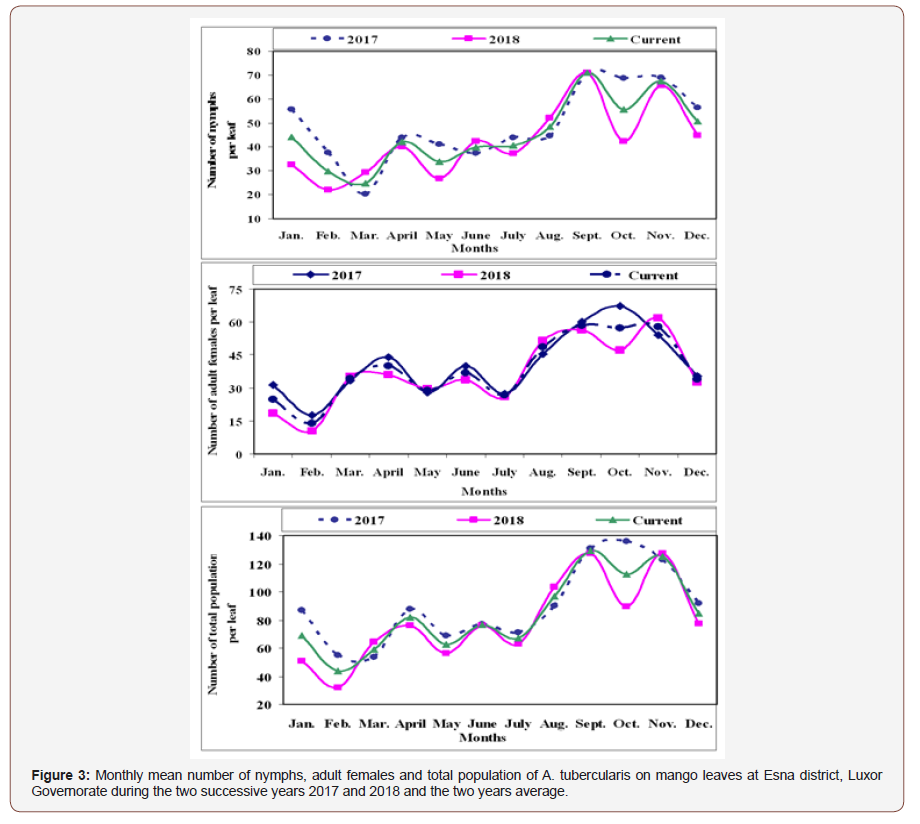
Nymphal population: The monthly mean numbers of A. tubercularis nymphs on mango leaves at Esna district, Luxor Governorate during the period from January 2017 to December 2018 years and current population (average the two years) are graphically illustrated in Figure 3. The seasonal activity of nymphal population indicated four peaks per year, in April, July, September and November 2017 year. While, those were recorded in April, June, September and November in 2018 year.
Adult females’ population: According to data of adult females of insect, three peaks were recorded in April, June, and October during year 2017, while in year 2018 and current population it had four peaks per year recorded in April, June, September and November (Figure 3).
Total population (nymphs and adult females) of A. tubercularis: A similar trend in the seasonal fluctuation of total population of A. tubercularis was observed as that of nymphs, with different values. The total population had four peaks those were recorded in April, June, September and November in the two studied years and current population (Figure 3).
Most authors indicated three or four peaks per year for A. tubercularis. In this respect, Radwan [28] in Egypt, reported that A. tubercularis had three generations on mango trees. Kawiz [29] in Qualubia, Egypt, reported that, this insect had three peaks on mango which occurred during March, June and November through the year. Also, A. tubercularis had four overlapping annual generations per year. Nabil (2010) in Sharkia, Egypt, reported that three overlapping generations of this insect pest on mango trees. Hamdy [30] in Shoubra EL-Kheima, Egypt, reported that the insect had 3-4 generations per year. Also, Sanad [31] in Qalyubiya, Egypt, reported that A. tubercularis had four generations per year.
Impact of the main current climatic factors on the current population density of different stages of A. tubercularis:
Nymphal population:
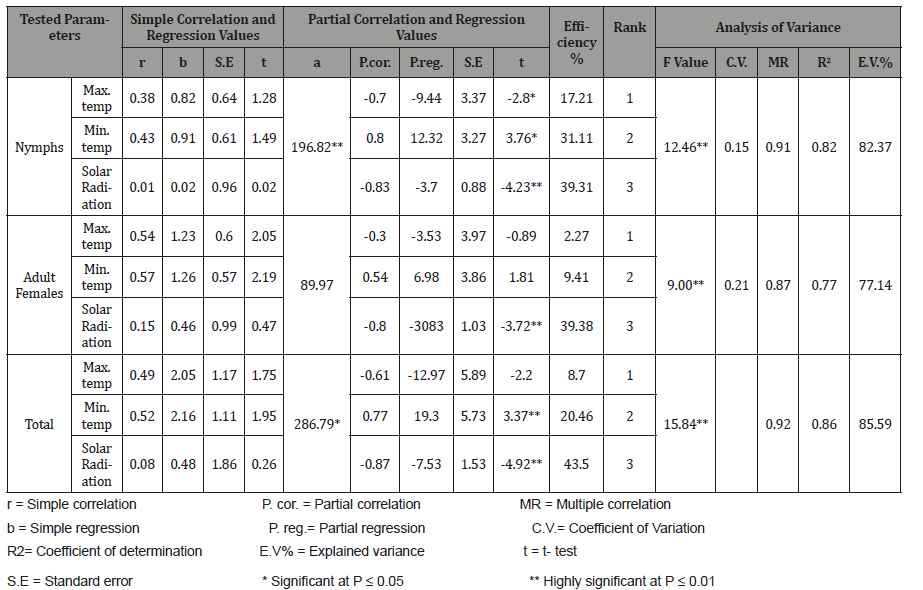
a. Effect of mean maximum temperature: The results of statistical analysis of simple correlation (Table 2) showed positive insignificant correlation between the mean maximum temperature and nymphal population of A. tubercularis, r value was (+0.38). The unit effect regression coefficient (b) indicates that an increase of 1 °C in the mean maximum temperature, would increase the population by 0.82 individuals per leaf for the current year.
Concerning, the partial regression value, data represented in Table 2, emphasized a significant negative relation (-9.44) and (t) value was (-2.80) for the current year, as well as the partial correlation was significantly negative (-0.70). The obtained results revealed that, mean maximum temperature above the optimum range of nymphal population of A. tubercularis activity was responsible for certain changes in the insect population by 17.21% during the current year.
b. Effect of mean minimum temperature: The effect of mean minimum temperature on nymphal activity was insignificantly positive (r = +0.43) for the current year (Table 2). The calculated regression coefficient for the unit effect of this factor indicated that for every 1°C increase in the mean minimum temperature, the population density would increase by 0.91 individuals per leaf for the current year. The precise effect of the mean minimum temperature on the nymphal population showed that, it was highly significantly positive (P. reg. value was +12.32) and (t) value was (+3.76) (Table 2). Also, the partial correlation was highly significant positive (+0.80). The obtained results revealed that, mean minimum temperature was entirely under the optimum range of nymphal population and was responsible for most of changes in the insect population by 31.11% during the current year.
c. Effect of mean solar radiation: Data in Table 2 showed that the simple correlation (r) between the mean solar radiation and the nymphal activity was insignificantly positive (+0.01). The calculated regression coefficient (b) for the effect of this factor indicated that every 1 MJ/m2 increase in the mean solar radiation, would increase the population by 0.02 individuals per leaf for the current year. The exact relationship between this climatic factor and the nymphal activity was determined by the partial regression value (Table 2), which emphasized highly significant negative relation between solar radiation and the nymphal activity (P. reg. was -3.70) and (t-test) value was (-4.23). Also, the partial correlation was highly significantly negative (-0.83). The obtained results revealed that, mean solar radiation entirely above the optimum range of nymphal population and this climate factor was the most effective variable in population changes of nymphs by 39.31% during the current year (Table 2).
d. The combined effect of the tested climatic factors on the nymphal activity: The combined effect of these climatic factors on the nymph’s population was highly significant where the «F» value, was 12.46 during the current year in Table 2. The influence of these combined climatic factors was expressed as percentage of explained variance which was 82.37% for the current year. The remaining unexplained variances are assumed to be due to the influences of other unconsidered and undetermined factors that were not included in this study in addition to the experimental error.
Table 2:Description of IPCC representative concentration pathway (RCP) up to year 2100.
Adult females’ population
a. Effect of mean maximum temperature: Data presented in Table 2 showed that the simple correlation (r) between the mean maximum temperature and the population density of adult females was insignificantly positive (+0.54) for the current year. As well as, the calculated regression coefficient (b) for the effect of this factor indicated that every 1°C increase in the mean maximum temperature, would increase the population by 1.23 individuals per leaf for the current year. The precise effect of this factor on the adult female’s population (Table 2) showed that it was insignificantly negative (P. reg. was -3.53) and t value was (-0.89) for the current year. Also, the partial correlation was insignificantly negative (-0.30). The obtained results revealed that, mean maximum temperature around the optimum range of adult females’ activity was the least effective variable in population changes of the adult females by 2.27 % during the current year.
b. Effect of the mean minimum temperature: An insignificant positive correlation between this climatic factor and the adult female’s population was detected (r value was +0.57) for the current year. In the same time, the regression coefficient indicates that an increase of 1°C in the mean minimum temperature, would increase the population by 1.26 individuals per leaf, for the current year. The real effect of this factor appeared from the partial regression value that, referred to the insignificant positive effect (+6.98) and (t) value was (+1.81) during the current year (Table 2). As well, the partial correlation was insignificantly positive (+0.54). Also, the obtained results revealed that the mean minimum temperature was within the optimum range of adult females’ activity, being responsible for certain changes in the population of adult females by 9.41 % during the current year.
c. Effect of mean solar radiation: As shown in Table 2, the effect of mean solar radiation on adult females’ activity was insignificantly positive correlation for current year (r was +0.15). Also, the simple regression coefficient (b) for the effect of this factor indicated that for every 1 MJ/m2 increase in the mean solar radiation, the population density of this insect would increase by 0.46 individual per leaf for the current year. The partial regression coefficient for the effect of mean solar radiation on the adult females’ population are presented in Table 2 and revealed that it was highly significantly negative for the current year (P. reg. value was -3.83) and (t) value was (-3.72). Also, the partial correlation was highly significantly negative (-0.80). The obtained results indicated that the mean solar radiation entirely above the optimum range of adult females’ activity and was responsible for most of changes in the insect population by 39.38 % during the current year.
The combined effect of the tested climatic factors on the adult females: The results showed that the combined effect of these tested factors on the insect population of adult females during the current year was highly significant (F value was 9.00) (Table 2). The percentage of variability which could be attributed to the combined effect of these tested factors on the insect population was 77.14% for the current year. The remaining unexplained variances are assumed to be due to the influence of other unconsidered factors which were not included in the present study in addition to the experimental error.
Total population of A. tubercularis
a. Effect of mean maximum temperature: The correlation coefficient (r) between the mean maximum temperature and total population in the current year, was insignificantly positive (+0.49) (Table 2). The unit effect regression coefficient (b) indicated that an increase of 1°C in the mean maximum temperature, would increase the population by 2.05 individuals per leaf for the current year. The partial regression values emphasized insignificantly negative relation that was (-12.97) and ‘’t value’’ was (-2.2) for the current year. Also, the partial correlation was insignificantly negative (-0.61). The obtained results revealed that, mean maximum temperature around the optimum range of total population activity and was the least effective variable in population changes of the adult females by 8.70 % during the current year (Table 2).
b. Effect of mean minimum temperature: The correlation coefficient (r) between mean minimum temperature and total population of A. tubercularis was insignificantly positive (r = +0.52) for the current year (Table 2). The calculated regression coefficient (b) for the effect of this factor indicated that for every 1°C increase, would increase the population by 2.16 individuals per leaf. The real effect of this factor on total population of A. tubercularis was highly significantly positive for the partial regression (P. reg. = +19.30) and (t) value was (+3.37). Also, the partial correlation was highly significantly positive (+0.77). The obtained results revealed that the mean minimum temperature was entirely under the optimum range of total population activity, being responsible for certain changes in total population of insect by 20.46 % during the current year (Table 2).
c. Effect of mean solar radiation: Data in Table 2 showed that, the effect of mean solar radiation on total population activity was insignificantly positive for the current year (r was +0.08). As well, the unit effect (regression coefficient) indicated that every 1 MJ/m2 increase in the mean solar radiation would increase the total population density of A. tubercularis by 0.48 individual per leaf. Partial regression coefficient for the effect of mean solar radiation on the total population of this species revealed that it was highly significantly negative (P. reg. value was -7.53) and t value was (-4.92). Also, the partial correlation was highly significantly negative (-0.87). The obtained results revealed that, mean solar radiation was entirely above the optimum range of total population activity, being responsible for most of the changes in total population of insect by 43.50 % during the current year (Table 2).
d. The combined effect of the tested climatic factors on the total population of A. tubercularis: The combined effect of these tested factors on the total population of A. tubercularis during the current year was highly significant (F value was 15.84, Table 2). The amount of variability that could be attributed to the combined effect of these tested factors on the total population of insect was 85.59% for the current year.
Many investigators studied the effect of weather factors on the population of A. tubercularis. Bakr et al. [1] mentioned that there was negative correlation between the fluctuations of A.tubercularis population and temperature degrees. El-Metwally et al. [32] reported that the variables of temperature and R.H.% had slight effect on A.tubercularis and did not reach the significant level except the effect of maximum R.H % in Damietta was highly significant and that of minimum R.H % was significant. Nabil et al. [2] stated that the combined effect of means of air temperature, relative humidity and light intensity on the total number of alive stages by 77.66 and 39.44 during the first and second years, consecutively.
e. Prediction of different A. tubercularis alive stages population density: The most effective climatic factors, which could be used to predict different alive stages, were maximum air temperature, minimum air temperature and solar radiation. Prediction equation for nymphs, adult females and total population of A. tubercularis were concluded according to the mentioned statistical analysis in Table 3 and presented as follow:
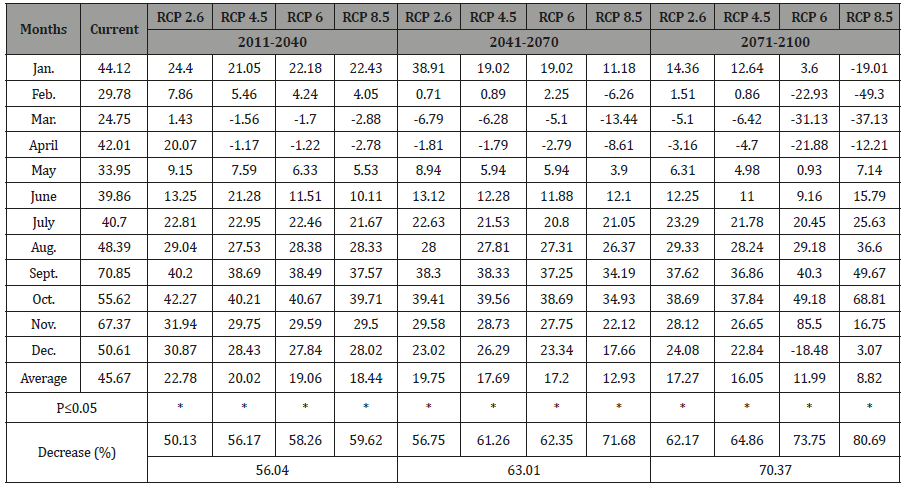
Table 3:Monthly mean numbers of A. tubercularis (Newstead) nymphs under current and future conditions under different RCP scenarios at Esna district, Luxor Governorate, Egypt.
For nymphs’ population:
Y = 196.82 ** – 9.44 x1* + 12.32 x2**- 3.70 x3** E.V. = 82.37%
For adult females’ population:
Y = 89.97 – 3.53 x11 + 6.98 x2 – 3.83 x3** E.V. = 77.14%
For total population of pest:
Y = 286.79 * – 12.97 x1 + 19.30 x2** - 7.53 x3** E.V. = 85.59%
Where, Y= Prediction value, E.V.% = Explained variance, X1= Maximum air temperature, X2= Minimum air temperature, X3= Solar radiation, *Significant at P ≤ 0.05 and **Highly significant at P ≤ 0.01.
Estimated Population Densities of Different Stages of Prediction of Aulacaspis Tubercularis Newstead (Hemiptera: Diaspididae) Populations Using RCP Scenarios in Luxor Governorate, Egypt Under Different Scenarios of (Rcps) During Three Time Series (2011-2040, 2041-2070 And 2071-2100) Compared with the Current Population
Numbers of nymphs: According to prediction equation for nymphs’ population and averages of monthly climatic factors under different RCPs scenarios during three time series, A. tubercularis nymph numbers can be estimated. Data in Table 3 and illustrated in Figure 4, indicated that the expected values for nymphs’ population during the different time series (2011-2040, 2041-2070 and 2071- 2100) under different RCPs scenarios (RCP 2.6, RCP 4.5, RCP 6.0 and RCP 8.5) were smaller than that for the current population of nymphs. The decreasing percentage of nymph’s population under time series 2071-2100 had the highest percentage of decreasing with an average of (70.37%) as compared to 2040-2071 (63.01%) and 2011-2040 (56.04%).
The maximum decreasing percentage of nymph’s population was expected under RCP 8.5 climate scenario with averages of 59.62, 71.68 and 80.69%; while it the minimum was prospective under RCP 2.6 scenario with averages of 50.13, 56.75 and 62.17% during the time series 2011-2040, 2041-2070 and 2071-2100, respectively. Results indicated also that, all numbers of nymphs’ population under climate change scenarios was decreased significantly as compared with the current conditions.
Generally, the RCP 2.6 climate scenario is expected to be correlated with the highest population density of nymphs during all different time series, followed by RCP 4.5 and then RCP 6.0; while the lowest population density of nymphs was found under RCP 8.5 scenario.
Numbers of adult females
Based on the prediction equation for adult female’s population and averages of monthly climatic factors under different RCPs scenarios during three time series, A. tubercularis adult female numbers could be expected. Data in Table 4 and illustrated in Figure 4, showed that the expected population densities for adult females during the different time series (2011-2040, 2041-2070 and 2071-2100) under different RCPs scenarios (RCP 2.6, RCP 4.5, RCP 6.0 and RCP 8.5) were fewer than that for the current females’ population. The decreasing percentage of adult females’ population under 2011-2040 had the least percentage of decreasing with an average of 44.58% while, the highest percentage of decreasing was recorded under 2071-2100 time series with an average of 48.38%. The highest decreasing percentages of adult females’ population were expected under RCP 8.5 with averages of 45.44, 49.74 and 51.87%; while the lowest prospective populations were under RCP 2.6 with decreasing averages of 43.75, 45.50 and 46.64% during the time series 2011-2040, 2041-2070 and 2071-2100, respectively. Results indicated also that, all numbers of adult females’ population under climate change scenarios will be decreased significantly as compared with the current conditions.
Table 4:Monthly mean numbers of A. tubercularis (Newstead) adult females under current and future conditions under different RCP scenarios at Esna district, Luxor Governorate, Egypt.
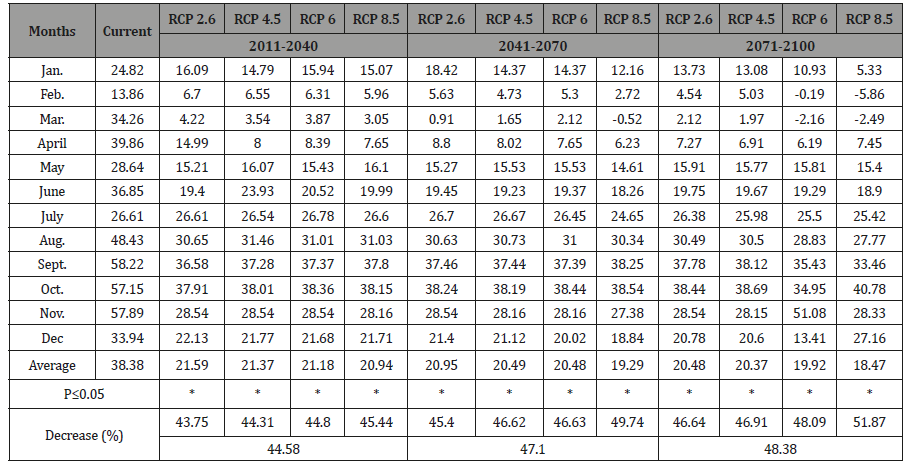
Generally, the RCP 2.6 scenario is expected to be correlated with the highest population density of adult females during different time series, followed by RCP 4.5 and then RCP 6.0. While, the lowest population density of adult females will be found under RCP 8.5 scenario.
Numbers of total population of A. tubercularis
According to prediction equation for total population numbers of A. tubercularis and means of monthly climatic factors under different RCP scenarios during three time series, the total population numbers for A. tubercularis could be estimated. Data in Table 5 and illustrated in Figure 4, revealed that the all prospective values for total populations of this scale insect during the different time series (2011-2040, 2041-2070 and 2071-2100) under different RCP scenarios (RCP 2.6, RCP 4.5, RCP 6.0 and RCP 8.5) were smaller than that for the current total population of same species.
Conclusion and Summary
There are still about 800 million undernourished and 1 billion malnourished people in the world. At the same time, more than 1.4 billion adults are overweight and 1/3 of all food produced is wasted. Before 2050, the global population is expected to swell to more than 9.7 billion people and it is estimated we will require 60% more food production by 2050 (World Agriculture towards 2030/2050). Agriculture is uniquely placed to propel people out of poverty [50-54]. Agricultural growth is often the most effective and equitable strategy for both reducing poverty and increasing food security. The FAO defines climate-smart agriculture (CSA) as “agriculture that sustainably increases agricultural productivity, enhances resilience (adaptation) [of agricultural and food security systems to climate change at multiple levels], reduces/removes greenhouse gas/GHGs (mitigation) where possible, and enhances achievement of national food security and development goals.
Climate change alters agricultural production and food systems, and thus the approach to transforming agricultural systems to support global food security and poverty reduction. Climate change introduces greater uncertainty and risk among farmers and policymakers but need not lead to analysis paralysis. An integrated, evidence-based and transformative approach to addressing food and climate security at all levels requires coordinated actions from the global to local levels, from research to policies and investments, and across private, public and civil society sectors to achieve the scale and rate of change required. With the right practices, policies and investments, the agriculture sector can move onto CSA pathways, resulting in decreased food insecurity and poverty in the short term while contributing to reducing climate change as a threat to food security over the longer term. Even if the principal goal of CSA is food security and sustainable agriculture development, the adoption of this approach can be constrained by the lack of information, Finance and insurance, lack of enough agricultural inputs and shortages of credit facility in Developing country specially SSA [51-59]. In general, on the basis of paper we can conclude that agriculture practices should be smart and environment friendly. So that farmers should have ability to adapt climate change. Agriculture is considered to be “climate-smart” when it contributes to increasing food security, adaptation and mitigation in a sustainable way.
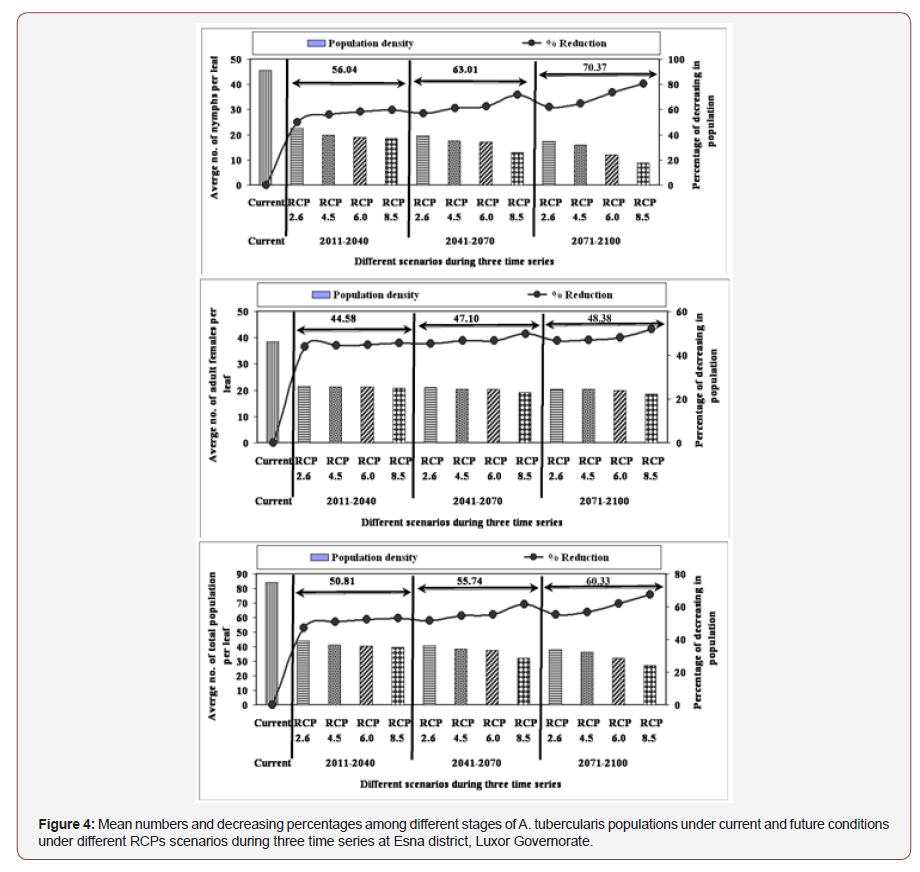
The decreasing percentage of A. tubercularis total population under 2071-2100 had the highest percentage of decrease with an average of 60.33% as compared with 2040-2071 (55.74%) and 2011-2040 (50.81%). The highest decreasing percentage of total population was expected under RCP 8.5 with averages of 53.15, 61.66 and 67.53%; while, the lowest were expected under RCP 2.6 with averages of 47.22, 51.57 and 55.08% during the time series (2011-2040, 2041-2070 and 2071-2100, respectively). Results indicated also that, all values of total population under climate change scenarios were decreased significantly as compared with the current population.
Generally, the RCP 2.6 scenario is correlated with the highest population density of total population of A. tubercularis during all different time series, followed by RCP 4.5 and then RCP 6.0. While, RCP 8.5 scenario gave the lowest population density of total population of pest.
From the previously mentioned results, it could be concluded that the monthly observations of total population of A. tubercularis had four peaks of seasonal activity per year [33,34]. The mean solar radiation was entirely above the optimum range for activities of nymphs, adult females and total population of A. tubercularis and this climatic factor was the most effective variable in population changes by 39.31, 39.38 and 43.50% for nymphs, adult females and total population during the base year data, respectively. According to the obtained results, the percentages of explained variance (E.V.%) indicated that the combined effect of these climatic factors viz., maximum temperature, minimum temperature and solar radiation were responsible for 82.37, 77.14 and 85.59 % of the population changes of nymphs, adult females and total population of insect, respectively.
The obtained results revealed that, all expected values for numbers of nymphs, adult females and total population of insect during the different time series under all different RCP scenarios were smaller in comparison to the current population of insect. Expected total population of insect will be smaller at time series of 2071-2100 as compared with the two-time series of (2041-2070) and (2011-2040) under the scenarios of (RCPs 4.5, 6 and 8.5). Also, the time series of (2071-2100) exhibited the highest percentage of decrease of the numbers of nymphs, adult females and total population with averages of (70.37, 48.38 and 60.33%) as compared to the time series of 2041-2070 (63.01, 47.10 and 55.74%) and the time series of 2011-2040 (56.04, 44.58 and 50.81%), respectively.
Furthermore, the RCP 2.6 scenario exhibit the highest population densities of nymphs, adult females and total population of A. tubercularis and the lowest decreasing percentage for population densities of different stages of A. tubercularis as compared with the other RCPs during all different time series.
Conclusion
The aforementioned results revealed that the mean solar radiation was the highest effective variable in A. tubercularis population changes by 39.31, 39.38 and 43.50% for nymphs, adult females and total population compared to during the base year data, respectively. Also, the expected climate changes in Luxor Governorate, Egypt according to the RCP scenarios during three time series will cause a decrease in the population density of A. tubercularis. The decreasing percentages in the total population of A. tubercularis well be between 47.22% to 67.53%, up to the 2011-2100 time series as compared to the current population. The reduction in population density of A. tubercularis is depending on climate region and climate change scenarios.
Acknowledgement
None.
Conflict of Interest
No conflict of interest.
References
- Bakr RFA, RM Badawy, SFM Mousa, LS Hamooda, SA Atteia, et al. (2009) Ecological and taxonomic studies on the scale insects that infest mango trees at governorate Egypt. Acad J biolog Sci 2 (2): 69-89.
- Nabil HA, AA Shahin, KAA Hammad, AS Hassan (2012) Ecological studies of Aulacaspia tubercularis (Diaspididae: Hemiptera) and its natural enemies infesting mango trees in Sharkia Governorate, Egypt. Acad J Biolog Sci 5(3): 9-17.
- Sayed AMM (2012) Influence of certain bio-agents and climatic changes on the population density of the white mango scale insect, Aulacaspis tubercularis (Newstead). Egypt J Agric Res 90 (2): 607-624.
- Abo-Shanab ASH (2012) Suppression of white mango scale, Aulacaspis tubercularis (Hemiptera: Diaspididae) on mango trees in El-Beheira Governorate, Egypt. Acad J Biolog Sci 5: 43-50.
- Zalom F, Wilson T (1982) Degree days in relation to an integrated pest management program. Division of Agricultural Sciences, University of California, Davis, CA, USA. Pp. 2.
- Dent D (1991) Insect Pest Management. C.A.B. International.
- Jeffery S Bale, Gregory J Masters. Ian D Hodkinson, Caroline Awmack, T Martijn Bezemer, et al. (2002) Herbivory in global climate change research: direct effects of rising temperature on insect herbivores. Global Change Biol 8: 1-16.
- Merrill RM, Gutiérrez D, Lewis OT, Gutiérrez J, Díez SB, et al. (2008) Combined effects of climate and biotic interactions on the elevational range of a phytophagous insect. J Anim Ecol 77: 145-155.
- Samways M (2005) Insect Diversity Conservation. Cambridge University Press, Cambridge.
- Walther GR, Post E, Convey P, Menzel A, Parmesan C, et al. (2002) Ecological responses to recent climate change. Nature 416: 389-395.
- Moss RH, JA Edmonds, KA Hibbard, MR Manning, SK Rose, et al. (2010) The next generation of scenarios for climate change research and assessment. Nature 463: 747-756.
- Intergovernmental Panel on Climate Change (2013) Impacts, Adaptation and Vulnerability. The physical science basis. Contribution of Working Group ITWELFTH SESSION- To the Fifth Assessment Report of the Intergovernmental Panel on Climate Change (IPCC): 15-29.
- Riahi K, Gruebler A, Nakicenovic N (2007) Scenarios of long-term socioeconomic and environmental development under climate stabilization. Greenhouse Gases –Integrated Assessment. Special Issue of Technological Forecasting and Social Change 74(7): 887-935.
- Junichi Fujino, Rajesh Nair, Mikiko Kainuma, Toshihiko Masui, Yuzuru Matsuoka, et al. (2006) Multigas mitigation analysis on stabilization scenarios using AIM global model. Multigas Mitigation and Climate Policy. The Energy Journal Special Issue 343-354.
- Hijioka Y, Y Matsuoka, H Nishimoto, M Masui, M Kainuma, et al. (2008) Global GHG emissions scenarios under GHG concentration stabilization targets. Journal of Global Environmental Engineering 13: 97-108.
- Clarke L, J Edmonds, H Jacoby, H Pitcher, J Reilly, et al. (2007) Scenarios of greenhouse gas emissions and atmospheric concentrations. Sub-report 2.1A of Synthesis and Assessment Product 2.1 by the U.S. Climate Change Science Program and the Subcommittee on Global Change Research. Department of Energy, Office of Biological & Environmental Research, Washington, DC: 154.
- Smith SJ, TML Wigley (2006) Multi-gas forcing stabilization with the MiniCAM. Multigas Mitigation and Climate Policy. The Energy Journal Special Issue 2006.
- Van Vuuren P, MGJ Den Elzen, PL Lucas, B Eickhout, BJ Strengers, et al. (2007) Stabilizing greenhouse gas concentrations at low levels: An assessment of reduction strategies and costs. Climatic Change 81: 119-159.
- Woiwod I (1997) Detecting the effects of climate change on Lepidoptera. J Insect Conserv 1: 149-158.
- Parmesan C (2007) Influences of species, latitudes and methodologies on estimates of phenological response to global warming. Glob Chang Biol 13: 1860-1872.
- Mitchell TD, PD Jones (2005) An improved method of constructing a database of monthly climate observations and associated high-resolution grids. International Journal of Climatology 25: 693-712.
- Osborn TJ (2009) A user guide for Clim Gen: A flexible tool for generating monthly climate data sets and scenarios. Climatic Research Unit, University of East Anglia, Norwich. 17.
- Warren R, S Dela Nava Santos, R Ford, TJ Osborn, S Raper, et al. (2008) Development of the Community Integrated Assessment System (CIAS), a multi-institutional modular integrated assessment approach for modelling climate change, and of SoftIAM, its supporting software. Environmental Modelling and Software 23(5): 592-610.
- MSTATC (1980) A Microcomputer Program of the Design Management and Analysis of Agronomic Research Experiments. Michigan State Univ, USA.
- SPSS (1999) SPSS base 9.0 user's guide. SPSS, Chicago, IL.
- Eggleston HS, L Buendia, K Miwa, T Ngara, K Tanabe, et al. (2006) Intergovernmental Panel on Climate Change (IPCC): IPCC Guidelines for National Greenhouse Gas Inventories programme. The institute for Global Environmental Strategies (IGES), Hayama.
- Abdrabbo MA, AA Farag, WMS El-Desokey (2015) Implementing of RCPs Scenarios for the Prediction of Evapotranspiration in Egypt. International Journal of Plant & Soil Science 6(1): 50-63.
- Radwan SG (2003) Toxicological studies on some scale insects infesting mango and guava trees. Cairo Univ Egypt Pp. 210.
- Kawiz FA (2009) Ecological studies on the mango scale insect, Aulacaspis tubercularis Newstead (Homptera: Diaspididae) infesting mango trees under field conditions at Qualubia governorate. Egypt J Agric Res 87(1): 71-83.
- Hamdy NM (2016) Some ecological aspects on mango white scale, Aulacaspis tubercularis and associated natural enemies infesting mango trees in Qalyubiya Governorate (Hemiptera: Sternorrhyncha: diaspididae). J Plant Prot and Path Mansoura Univ 7(6): 377-383.
- Sanad ME (2017) Improving an integrated programme for management scale insects and mealybugs on mango trees in Egypt. Shams Univ Pp. 227.
- El-Metwally MM, SFM Moussa, NM Ghanim (2011) Studies on the population fluctuations and distribution of the white mango scale insect, Aulacaspis tubercularis Newstead within the canopy of the mango trees in eastern of Delta region at the north of Egypt. Acad J biolog Sci 4 (1): 123-130.
- In Parry, M.L., Canziani, O.F., Palutikof, J.P., Van Der Linden, P.J. & Hanson, C.E., eds. Climate Change (2007) Impacts, Adaptation and Vulnerability. Intergovernmental Panel on Climate Change (IPCC): Summary for Policymakers. Contribution of Working Group II to the Fourth Assessment Report of the Intergovernmental Panel on Climate Change, pp. 7-22. Cambridge University Press, Cambridge, UK; 2007.
- Nabil HA (2010) Ecological studies on some species of scale insects and mealybugs and their associated parasitoids infesting mango trees in Sharkia Governorate, Ph.D. Thesis, Fac. Agric., Zagazig Univ.
-
Islam RM El Zoghby, Moustafa MS Bakry. Prediction of Aulacaspis Tubercularis Newstead (Hemiptera: Diaspididae) Populations Using RCP Scenarios in Luxor Governorate, Egypt. World J Agri & Soil Sci. 2(5): 2019. WJASS.MS.ID.000549.
-
RCPs, Aulacaspis Tubercularis, Seasonal activity, Climate change scenarios, Mango
-

This work is licensed under a Creative Commons Attribution-NonCommercial 4.0 International License.
- Abstract
- Introduction
- Material and Methods
- Results and Discussion
- Estimated Population Densities of Different Stages of A. Tubercularis Under Different Scenarios of (Rcps) During Three Time Series (2011-2040, 2041-2070 And 2071-2100) Compared with the Current Population
- Conclusion
- Acknowledgement
- Conflict of Interest
- References


