 Research Article
Morphological Properties and Nutrient Status of Different Waste Derived Slow Pyrolyzed Biochars
Golam Rabbani1, Md Faruque Hossain2* and Zakia Parveen1
1Department of Soil, Water & Environment, University of Dhaka, Dhaka 1000, Bangladesh
2American International University-Bangladesh, Kuril, Dhaka 1229, Bangladesh
Md Faruque Hossain, American International University-Bangladesh, Ka-66/1 Kuratoli Rd, Kuril, Dhaka 1229, Bangladesh.
Received Date: October 23, 2020; Published Date: November 20, 2020
Abstract
Slow pyrolyzed (500±50 °C) ten different waste derived biochar viz. animal bone, corn stover, wood chips, sewage sludge, sugarcane bagasse, green coconut palms, nutshells, potato peels, water hyacinth and organic waste were analyzed to know their physicochemical properties and nutrient contents. Results provided the fact that water hyacinth biochar had the best nutrient status along with excellent physical properties like water holding capacity (509%) and CEC (300 cmolc kg-1) whilst potato peel biochar was the second best among all categories. The average particle size of wood chips biochar 0.82 μm2 was the largest along with the maximum pore depth. However, the region of this biochar occupied by remarkably small particles, which was 47.42%. The corn stover biochar, on the other hand, had the smallest average particle size (0.18 μm2) and the lowest particle area (9.19%). Biochar wood chips (51.3%) and biochar potato peels (49.4%) had the highest organic C value, while biochar nutshell had the lowest (15.31%), respectively. Nutrient content varies depending on the variation in the feedstock mostly N, P, K, and S in total content. Animal bone biochar (3.89%) and biochar nutshells (3.32%) exhibited the highest total N content. Total N biochar content derived from potato peel, water hyacinth, and organic matter had around 3 ppm, which was much higher than the remaining biochar content. In the analysis, high phosphorus concentrations resulted in biochar derived from animal bone feedstock (8.44%), whereas other biochars such as potato peel, water hyacinth, and organic waste were less than 1%. The biochar potato peel and the biochar water hyacinth had higher total K content than other biochars. All the biochars exhibited equal total S concentration. Biochar derived from animal bone (2.34%) and potato peel (2.72%) had a higher percentage of total K compared with other biochar. Biochar related wastes showed a very low concentration of heavy metals such as Cr, Pb, Cd, and Ni. The highest chromium content resulted in biochar sewage sludge (0.746 ppm). The concentration of total chromium was similar to that of both sugarcane bagasse biochar and nutshell biochar. The overall amount of lead and cadmium in all of the biochar was below the detection mark. In comparison, the biochar sewage sludge contained a high amount of nickel (1.06 ppm) relative to other biochars. This is perhaps due to the high amount of pollutants present in the sewage sludge feedstock.
Keywords: Characteristics; Nutrient content; Waste; Slow pyrolyzed; Biochars
Introduction
The challenge of satisfying the increasing need for food in this twenty-first century has put enormous pressure on soil health. People are forcing soil to yield beyond its capacity with the help of inorganic fertilizers and other agrochemicals; which, in turn deteriorating her quality to sustain the production for the future. Extensive industrialization and natural resource exploitation have resulted in environmental degradation and pollution with the rising economy. Large quantities of waste were dispersed in thousands of contaminated sites spread all over the globe. The use of these wastes, as well as other by-products as feedstock for bioenergy pyrolysis represents a significant environmental management and economic achievement. Waste can be reused as biochar, a solid product rich in carbon as 65 to 95 percent [1-4].
Biochar is a solid carbonaceous material that is produced from heating biomass at or above 250 °C in the absence of limited air. It was originally intended for use in sequestration of carbon (C) and soil health improvement, but has now expanded toward environmental management [4-6]. In soil application, biochar has a long history, is associated with the discovery of “Terra Preta di Indio” (also called Amazonian Dark Earths) in Amazonia, where the dark earth soils (accounting for * 10 percent of Amazonia) were created using the slash-and-char technique by the deliberate addition of biochar [7]. For hundreds to thousands of years the dark earth soils maintained high fertilities [8]. This discovery motivated scientists to intentionally create biochar using modern artificial techniques to recreate the ancient agricultural miracle in Amazonia. Biochar feedstock includes diverse biomasses, especially waste and lowvalue biomass such as agricultural straw, livestock manure, wood chips, and sawdust [2-4,9]. Thus, the development of biochar will achieve the resource utilization goal of this biomass waste, a valueadded process. Besides, during biochar processing, by-products such as bio-oil and syngas can be collected and used as bioenergy [10]. Biochar, similar to activated C (AC), has a large specific surface area, a porous structure with an abundance of usable surface groups and can be used as a sorbent or passivator to extract or immobilize inorganic and organic contaminants from water or soil [2,11-14]. Because of these advantages, such as improving soil health, reducing climate change, mitigating greenhouse gas (GHG) emissions (e.g. CO2, CH4, and N2O), remediating water and soil pollution, managing and using waste biomass, and generating bioenergy (e.g. bio-oil, syngas), biochar technology has attracted public interest in the past decade [15,16]. Recently, increasing studies have recommended biochar beyond soil health improvement and sequestration as a management tool to connect environmental protection and bioenergy development [4,12,13,17]. However, the new concept of biochar application in the field is still new, with only a few research activities being conducted here in Bangladesh, and is focused on the biochar made from various waste materials such as bovine bone, maze things, wood chips, sewage bagasse, green cocoon palm, nutshell, potato peel and water hyacinths, as well as organic waste. This research work, therefore, carried out to use waste as a feedstock for the production of biochars and compare its characteristics with each other.
Materials and Methods
Feedstock selection
Ten different types of wastes were collected to produce different types of biochar from the capital of Bangladesh. All the feedstock selected are potentially waste materials and collected from different sources. Animal bones (Fish, Chicken, Cow, and Goat) collected from the meat market in Malibagh Bazar, home leftover, and leftover after the Eid festival (Eid-ul-Azhar). Corn Stovers were collected from Sher-e-Bangla Agriculture University. Wood chips were collected from sawmill (Rahim Timber and Sawmill) from Abul Hotel, Chowdhury Para, Dhaka. Sewage sludge was collected from Pagla Sewage Treatment Plant. Sugarcane bagasse was collected from the roadside sugarcane juice shop. Green coconut palm collected from the coconut market near Malibagh Bazar. Nutshells were collected from the peanut shop near Wari Bazar. Potato peels were arranged from the small agro-food processing industry in Puran Dhaka. Water hyacinths were collected from a pond, located in Keraniganj, Dhaka. Organic wastes were collected from kitchen leftover vegetables and other municipal wastes. After collection, the materials were packed in polythene bags, and the bags were tied with strings to prevent any air-exchange between the atmosphere and the sample itself.
Processing and production of biochars
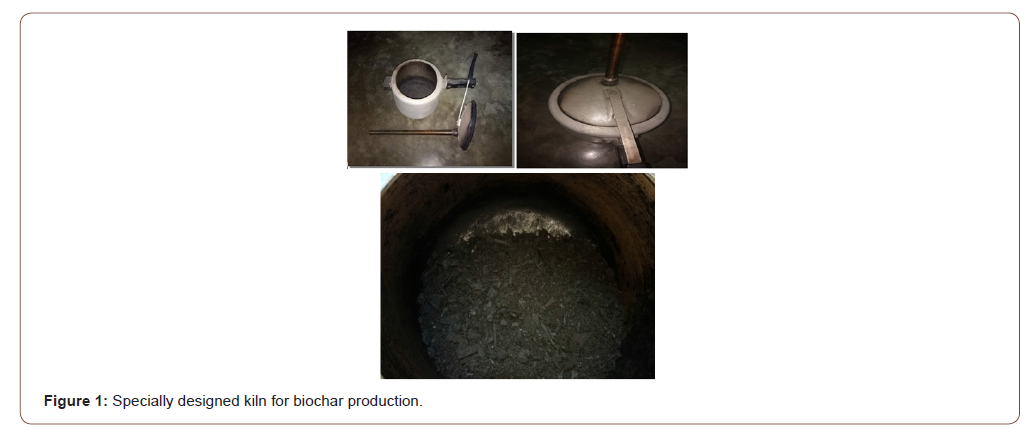

Before production of biochar, all the waste derived feedstocks were well dried for few days under the sunlight. After properly drying all the feedstocks, one by one were processed and pyrolysis was done in a specially designed kiln. A wasted pressure cooker was collected from a recycle shop in Old Dhaka then, it was fixed, and a stainless-steel pipe is attached in the upper part of the cooker. The whole pressure cooker was air tightened by using heat resistance rubber in the head of the cooker. The pipe was used to remove syngas that produce in the cooker (Figures 1&2).
Individual feedstock was placed in the bally of the cooker and then the head of the cooker is locked that no oxygen can enter inside the cooker. The cooker was then placed on the gas Stover for burning. Approximate temperature 450 to 550 °C was maintained after one hour. The feedstock was burnt for 3 hours maintain the above-mentioned temperature. After the completion of the process, the cooker was removed from the gas stover and it was kept on the floor to cool down. The head of the cooker was not opened because it can readily oxidize in contact with atmospheric air. After the biochar cooled down, the lid of pot opened and screened through a 0.25mm stainless sieve and then kept in plastic jars with paper tags indicating source, manufacturing date etc., (Table 1).
Table 1: Types of waste used to produce biochar and symbols.

Laboratory analysis and analytical procedure
To determine the water holding capacity by mass ASTM (2010) method was followed. The morphological properties of biochars were analyzed by Scanning Electron Microscopic (SEM) imaging. A range of SEM images (Magnification: 2000× to 10,000×) were captured with a JEOL JSM-6490 operating at 20KV at the Center for Advanced Research in Sciences (CARS), University of Dhaka. Image analysis was done with ImageJ version 2.0 with appropriate threshold and size range values.
The pH, electrical conductivity (1:10 ratio) and cation exchange capacity (CEC) of biochar samples were measured as described in Rayment and Higginson (1992). Organic carbon of the feedstock and biochar were determined by wet oxidation method of Walkley and Black [18]. Total N of the samples was determined by Kjeldahl steam distillation method (Jackson 1962). The concentration of P, K and S in feedstocks and biochars were analyzed after digestion with nitric-perchloric acid (Jackson 1962). Total P was measured calorimetrically using a spectrophotometer by developing yellow color with vanadomolybdate, total K by flame photometer and total S by turbidimetric method using spectrophotometer (Jackson, 1962). Statistical analyses were done by using Microsoft Excel 2016 and Minitab 2019.
Results and Discussion
Physical and morphological characteristics of biochars
The sugarcane bagasse biochar possessed the highest water retention of 574% that is nearly ten times more than that of sewage sludge biochar, which may be due to increased porosity of sugarcane bagasse (Table 2). Both corn stover and water hyacinth biochar also have high percentage of water holding capacity. Corn stover biochar demonstrated the second highest water retention of 525% followed by the water hyacinth biochar (509%). On the other hand, animal bone biochar (67%) and sewage sludge biochar (55%) have very low water holding capacity than other biochars. Biochar could be a competent amendment to light soils especially for newly developed lands with high sand deposited, as provides high water holding capacity. Improving biochar performance, feedstock selection and manufacturing conditions demand a comprehensive understanding of structure and particle distribution. Biochars are typically comprised of abundant minerals and organic structures. The surface morphology of all the biochar materials was highly diverse in structural composition.
After analyzing the images with ImageJ software (Table 2 and Figure 3) wood chips biochar’s average particle size 0.82 μm2 was the biggest along with its highest pore volume (Figure 3). However, this biochar’s area occupied by particles in surprisingly high which is 47.42%. In contrast, corn stover biochar possessed the smallest average particle size is 0.18 μm2 and lowest area occupied by particles (9.19 %). The highly spongy and honeycomb like porosity of these biochars may grant high surface area which are likely to increase soil aeration, water holding capacity, and nutrient retention when incorporated in soil.
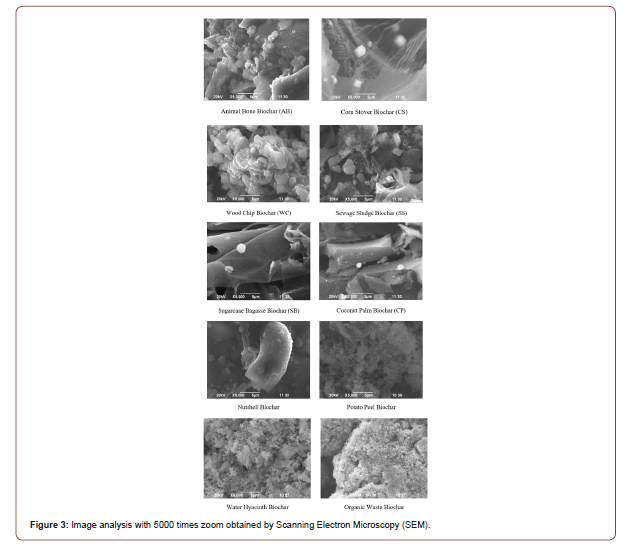
Table 2: Water holding capacity, particle size and area occupied by particles in different waste derived biochars.

Chemical characteristics of biochars
Most of the biochar found to be alkaline in nature (pH 6.4 to 10.02) may be high dissolution of base cations (Table 3). Due to the production methods and high temperature increases the pH value of biochars probably in consequence of the relative concentration of non-pyrolyzed inorganic elements that are already present in the original feedstocks [19].
Biochar’s alkaline property can be described to four broad categories: surface organic functional groups, carbonates, soluble organic compounds and other inorganic alkalis including oxide, hydroxides, sulfates, sulfides and orthophosphates [20]. Increased pH of biochar amended acid soils may help to reduce Al-toxicity and increase P availability. Electrical conductivity was very high for biochars produced from potato peels and organic waste and in animal bone, corn stover and young coconut palm EC value is moderate (Table 3). Other biochars had relatively lower EC; however, high EC results may be due to high soluble salt concentrations. Biochars produced from potato peels and domestic organic waste demonstrated higher EC (9.77 and 9.9 mS/cm, respectively) that may be due to their high K content (Table 5).
Table 3:Chemical properties of biochars such as, pH, EC (mS/cm) and CEC (Cmolc/kg).

Table 4: Total Organic Carbon (OC) in Biochars.

Table 5: Total nutrient concentrations (%) of different biochars.

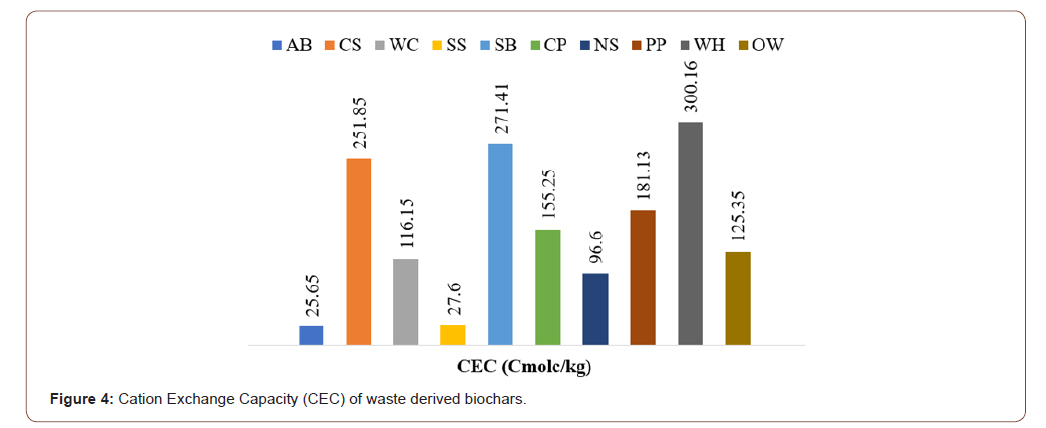
Cation exchange capacity indicates the ability of biochar to hold cationic nutrients. Soils with high CEC values are able to retain cationic fertilizers (K+ and NH4+) in the root zone and prevent nutrient leaching. The WH biochar showed highest CEC (300.16 Cmolc/kg) (Figure 4) which is almost four times of the most mineral soils (≤15 Cmolc/kg) indicated this biochar could be an interesting soil amendment for sandy soils [21]. Animal bone biochar had the lowest CEC that is 25.65 Cmolc/kg followed by sewage sludge biochar (27.6 Cmolc/kg) (Figure 4) and predicted that K, Ca, Mg, Na and P in the biomass promote the formation of O-containing groups on biochar surface during pyrolysis, resulting in higher CEC [22]. Biochars with higher CEC. Biochars with high CEC can also be an environmental management option for remediating soil or water contaminated with heavy metals [22].
Carbon content and nutrient status of biochar
Results indicated that wood chips biochar (51.3%) and potato peels biochar (49.4%) possessed the highest organic C content, respectively whereas nutshell biochar holds the lowest (15.31%) (Table 4). This stable form of organic C would extensively affect physicochemical properties of soil. High-temperature biochar exhibits a high degree of aromatic C structures that are resistant to degradation, as they do not provide labile fraction of C to soil microbes [19]. Biochar is generally regarded as relatively inert when compared to their feedstocks. The carbon of biochars tends to be present in the soils for hundreds to thousands of years, depending on the feedstock and type of pyrolysis [23].
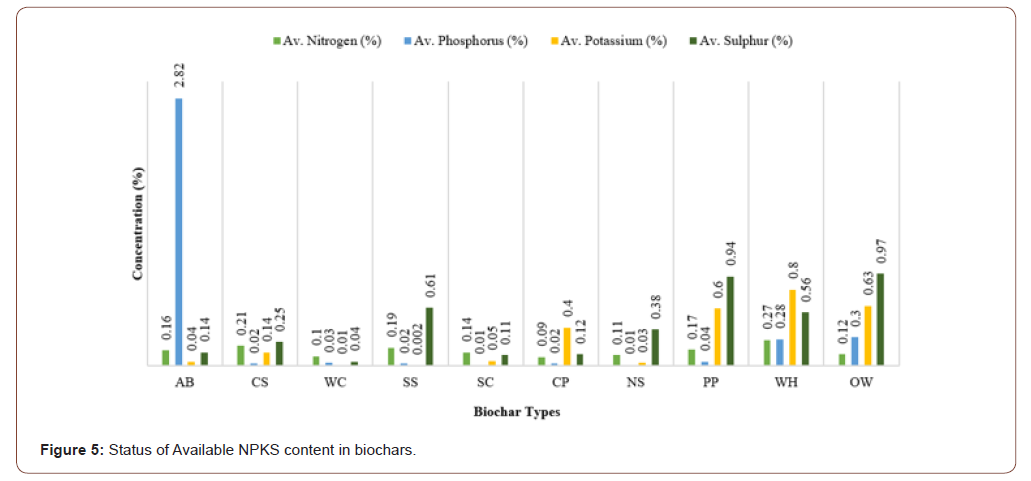
The increase in soil C and nutrient status is due to thermal humiliation which means loss of volatile compounds (H and O mainly) of the original material and comparatively small losses of alkali nutrients by volatilization [24]. Pyrolysis alters the nutrient content in the resulting biochar, which therefore affects nutrient availability to plants. Nutrient content mostly N, P, K and S in total content can vary according to the variation in feedstock. Animal bone biochar (3.89%) and nutshells biochar (3.32%) had the highest content of total N (Table 5). Total N contents of biochar, produced from potato peel, water hyacinth and organic matter had around 3 ppm that was much higher than remaining biochar. Mainly the influence of feedstock is particularly evident in the case of total P. In the study, high concentration of phosphorus resulted in biochar produced from feedstock of animal bone (8.44%) whereas other biochars like potato peel, water hyacinth and, organic waste showed lower than 1%. Potato peel biochar and water hyacinth biochar had higher total K content than other biochars. All the biochars showed similar concentration of total S. Biochar produced from animal bone (2.34%) and potato peel (2.72%) had the higher percentage of total K than other biochar. Biochars are variable materials in terms of total nutrient content and nutrient availability can vary in response to plant and soil. For plant growth, available nutrient content is an important factor. The available N, P, K and S in the biochars varied according to the feedstock. Available N content found even in most of the biochars (Figure 5). In general, biochars are very low in mineral forms of Nnamely, Nitrate-N and Ammonium-N. The effects of feedstock type and its conversion processes on the speciation of availability of P and K from biochars is not well understood yet. Pyrolysis process of biochar production also plays an important role in this case. Due to pyrolysis procedure, generally loss a smaller amount of P than C or N as it transforms to less soluble minerals resulting in reduction of available P in biochars [25]. Available sulphur content in biochar vary depending on biochar production processes like pyrolysis or gasification (>700 °C). Pyrolyzed waste showed result of available sulfur content below 1% (Figure 5). Macro and micronutrient concentrations of different biochars (Table 5).
The total sodium content of most of the biochar were low in concentration (Table 6). Animal bone biochar had the maximum Na content (0.62%), which was almost triple than that of corn stover biochar (0.04%).
Soluble Na attributed for the higher EC in soil. The high EC of the analyzed biochar might be the reason of huge Na content. Same as Na content, animal bone biochar had highest amount of Ca content (0.33%), as animal bone feedstock contain mostly calcium. Water hyacinth biochar had the second highest Ca content. In contrast, Mg contents found low in all the biochars. High production temperature resulted biochar depleting decomposable substances, volatile compounds and elements like O, H, N, S and as a consequence concentration of their nutrients increase, including K, Ca, and Mg [26]. Total Fe content of sewage sludge biochar was high (19.5%) while with 2.17% animal bone biochar had the lowest amount of iron. Biochar demonstrated a slight variation in total Zn content ranged from 0.43 to 13.5 mg kg-1. The highest amount of Zn found in sewage sludge biochar (13.5 mg kg-1) but it was lower (1350 to 2175 mg kg-1) than the previous studies reports [27]. Most of the biochar resulted in low amount of copper content. Nutshell biochar and Water hyacinth had below detection limit in terms of total copper content.
Heavy metals status of biochars
Total chloride content of the biochar was ranging from 30 to 4900 ppm (Table 7). Corn stover biochar (4900 ppm) and animal bone biochar (3900 ppm) had high amount of chloride content; in contrast, nutshell biochar had the lowest (30 ppm) chloride content. Biochars have heavy metals inherent within their structure, derived from their source material, which maybe accumulated and concentrated in ash fractions during pyrolysis [6]. Waste derived biochar demonstrated very low concentration of heavy metals like Cr, Pb, Cd and Ni (Table 7). Highest amount of chromium resulted in sewage sludge biochar (0.746 ppm). Both sugarcane bagasse biochar and nutshell biochar had similar concentration of total chromium. Total lead content and cadmium content in all the biochar were below detection limit. In contrast, sewage sludge biochar was containing high amount of nickel (1.06 ppm) than other biochars. This is maybe due to high amount of pollutant present in the feedstock of sewage sludge biochar [28].
Table 6: Macro and micronutrient status of biochars.

Table 7: Heavy metal status (ppm) of biochars.

Conclusion
Waste derived biochars displayed varying physicochemical properties and nutrient content. The water hyacinth biochar exhibited high surface area, water keeping, and cation exchangeability while the biochar of domestic organic waste had increased the critical nutrient contents. Consequently, feedstocks for biochar production must be carefully chosen to meet the needs of a specific combination of soil crops. The biochars used in this study are readily available and some have high potential in the agricultural system to be adopted. Cost-benefit ratio, production cycle, production temperature effect, and socioeconomic factors should, however, be considered before implementation on the ground. The properties of biochar and the heavy metal content themselves differ considerably depending on their material sources and manufacturing conditions. They have different effects on heavy metals and can give many benefits, either alone or in conjunction with other amendments. There is no question that certain biochars are an efficient solution-sorbent for heavy metals, but this is not an indication of their efficacy in handling heavy metals in the environment as a wide range of confusing ecological, biological, and physical ecosystem interactions must also be considered.
Acknowledgement
None.
Conflict of Interest
No conflict of interest.
References
- Mukome FN, Parikh SJ (2015) Chemical, physical, and surface characterization of biochar. CRC Press, Boca Raton, FL, pp. 67-98.
- Piash MI, Hossain MF, Parveen Z (2016) Physico-chemical properties and nutrient content of some slow pyrolysis Biochars produced from different feedstocks. Bangladesh Journal of Scientific Research 29(2): 111-122.
- Piash MI, Hossain MF, Shamim Al, Parveen Z (2018) Effect of biochar amendment on soil carbon fluxes in different cultivation system. American Journal of Climate Change 6(1): 40-53.
- Piash MI, Hossain MF, Parveen Z (2019) Effect of Biochar and Fertilizer Application on the Growth and Nutrient Accumulation of Rice and Vegetable in Two Contrast Soils. Acta Scientific Agriculture 3(3): 74-83.
- International Biochar Initiative (2012) International Biochar Initiative (IBI) Standardized Product Definition and Testing Guidelines for Biochar that Is Used in Soil. IBI, pp .47.
- Lehmann J, Joseph S, eds., (2015) Biochar for environmental management: science, technology and implementation. Routledge.
- Laird DA, Brown RC, Amonette JE, Lehmann J (2009) Review of the pyrolysis platform for coproducing bio‐oil and biochar. Biofuels, Bioproducts and Biorefining 3(5): 547-562.
- Wiedner K, Schneeweiß J, Dippold MA, Glaser B (2015) Anthropogenic dark earth in northern Germany-The nordic analogue to terra preta de indio in Amazonia. Catena 132: 114-125.
- Shaheen SM, Niazi NK, Hassan NE, Bibi I, Wang H, et al. (2019) Wood-based biochar for the removal of potentially toxic elements in water and wastewater: a critical review. International Materials Reviews 64(4): 216-247.
- Liu W, Huo R, Xu J, Liang S, Li J, et al. (2017) Effects of biochar on nitrogen transformation and heavy metals in sludge composting. Bioresource Technology 235: 43-49.
- Liu Q, Zhang Y, Liu B, Amonette JE, Lin Z, et al. (2018) How does biochar influence soil N cycle? A meta-analysis. Plant and Soil 426(1-2): 211-225.
- O Connor D, Peng T, Zhang J, Tsang DC, Alessi DS, et al. (2018) Biochar application for the remediation of heavy metal polluted land: a review of in situ field trials. Science of the Total Environment 619: 815-826.
- Yuan P, Wang J, Pan Y, Shen B, Wu C (2019) Review of biochar for the management of contaminated soil: Preparation, application and prospect. Science of the Total Environment 659: 473-490.
- Zheng Y, Wang B, Wester AE, Chen J, He F, et al. (2019) Reclaiming phosphorus from secondary treated municipal wastewater with engineered biochar. Chemical Engineering Journal 362: 460-468.
- Abiven S, Hund A, Martinsen V, Cornelissen G (2015) Biochar amendment increases maize root surface areas and branching: a shovelomics study in Zambia. Plant and Soil 395(1-2): 45-55.
- Shen Z, Jin F, Wang F, McMillan O, Al-Tabbaa A (2015) Sorption of lead by Salisbury biochar produced from British broadleaf hardwood. Bioresource technology 193: 553-556.
- Xiao X, Chen B, Chen Z, Zhu L, Schnoor JL (2018) Insight into multiple and multilevel structures of biochars and their potential environmental applications: a critical review. Environmental Science & Technology 52(9): 5027-5047.
- Walkley A, IA Black (1934) An examination of Degtjareff method for determining soil organic matter and a proposed modification of the chromic acid titration method. Soil Sci 37: 29-37.
- Novak JM, IM Lima, B Xing, JW Gaskin, C Steiner, et al. (2009) Characterization of designer biochar produced at different temperatures and their effects on a loamy sand. Ann Environ Sci 3: 195-206.
- Cheah S, SC Malone, CJ Feik (2014) Speciation of sulfur in biochar produced from pyrolysis and gasification of oak and corn stover. Environ Sci Technol 48: 8474-8480.
- Sposito G (1989) The Chemistry of Soils. Oxford University Press, New York, pp. 344.
- Meszaros E, E Jakab, G Varhegyi, J Bourke, M ManleyHarris, et al. (2007) Do all carbonized charcoals have the same chemical structure? Implications of thermogravimetry mass spectrometry measurements. Ind Eng Chem Res 46: 5943–5953.
- Thies JE, MC Rillig, ER Graber (2015) Biochar effects on the abundance, activity and diversity of the soil biota. In: J. Lehmann and S. Joseph (Eds.). Biochar for environmental management: science, technology and implementation 2: 327-389.
- Chan KY, Z Xu (2009) Biochar: nutrient properties and their enhancement. In: Lehmann J & Joseph S (Eds.), Biochar for Environmental Management- Science and Technology. Earthscan, U.S.A. pp. 67-84.
- Zheng H, Z Wang, X Deng, J Zhao, Y Luo, et al. (2013) Characteristics and nutrient values of biochars produced from giant reed at different temperatures. Bioresour. Technol 130: 463-471.
- Kim KH, J Kim, T Cho, JW Choi (2012) Influence of pyrolysis temperature on physicochemical properties of biochar obtained from the fast pyrolysis of pitch pine (Pinusrigida). Bioresour Technol 118: 158–162.
- Hossain MK, V Strezov, KY Chan, A Ziolkowski, PF Nelson (2011) Influence of pyrolysis temperature on production and nutrient properties of wastewater sludge biochar. J Environ Manage 92: 223-228.
- Jackson ML (1973) Soil chemical analysis. 1st ed. Prentice-Hall Icn. Englewood Cliffs. NJ.
-
Golam Rabbani, Md Faruque Hossain, Zakia Parveen. Morphological Properties and Nutrient Status of Different Waste Derived Slow Pyrolyzed Biochars. World J Agri & Soil Sci. 6(1): 2020. WJASS.MS.ID.000628.
-
Characteristics, Nutrient content, Waste, Slow pyrolyzed, Biochars
-

This work is licensed under a Creative Commons Attribution-NonCommercial 4.0 International License.


