 Research Article
Mechanical Behavior of an Ultisol Under Different Sugarcane Management Systems in Brazil
Wagner Luís da Silva Souza1, José Ramon Barros Cantalice2*, Brivaldo Gomes de Almeida2, Romero Falcão Bezerra Vasconcelos2 and Apolino José Nogueira da Silva3
1Federal Institute of Pernambuco and researcher of the PNPD Program (CNPq/FACEPE) join to Rural Federal of Pernambuco University, Brazil
2Soil Conservation Engineering Laboratory, Rural Federal of Pernambuco University (UFRPE), Brazil
3Federal of Rio Grande do Norte University, BRAZIL (UFRN)
José Ramon Barros Cantalice, Soil Conservation Engineering Laboratory, Rural Federal of Pernambuco University (UFRPE), Brazil.
Received Date:June 04, 2020; Published Date: July 31, 2020
Abstract
Compressibility and shear strength in agricultural soils are associated with pressures exerted on the soil surface by the intensive use of machines. This study aimed to evaluate the mechanical behavior of an Ultisol cultivated with sugarcane under the application of sugarcane residues (vinasse and filter cake) and compare it with an Atlantic Forest soil. Uniaxial compression tests were performed through the application of increasing with pressures from 12.50 to 1,600 kPa, at three water contents in undisturbed samples from the layers of 0-0.20 and 0.20-0.40 m, and for shear direct test were collected in the layers of 0-0.20 m and, subjected to three water content levels and four levels of normal tensions of direct shear. The higher content of total organic carbon in the soil under native forest (2.42 g kg-1) allowed higher pre-compression stresses (101.21-143.55 kPa) due to an increase in soil cohesion from 22.58 to 61.23 kPa, with the reduction in the volumetric water content. Thus, this natural condition was significantly different from the management systems, with respect to the mean values of cohesion, by Tukey test (p<0.05). The application of filter cake and vinasse for 25 years significantly favored the dissipation of pre-compression stress in the soil, compared with the soil under native forest. The system with filter cake application showed higher shear strength from the tension of 100 kPa on, with values from 120 to 190 kPa, in comparison to the system with vinasse application.
Keywords:Compressibility; Shear; Dissipation; Vinasse; Organic fibers
Introduction
The different management systems in the various agricultural soils, combined with the pressures exerted on the soil surface by the intensive use of agricultural machines and implements, are capable of causing variations in soil physical-chemical properties, which have great influence on its mechanical behavior [1-3].
The compressibility of agricultural soils in the literature is presented with various definitions, but all of them explain that the process is characterized by a variation in soil volume and increase of its density in response to a pressure applied on its surface [4,5]. According to Braida et al. [6], plant residues applied on soil sur face absorb part of the compaction energy produced by the traffic of machines and animals. Therefore, during the compression, plant residues deform and dissipate the energy, thus not transferring this energy completely to the soil. Thus, the total transfer of this energy will only occur when the residue is no longer efficient at absorbing all the compressive energy, when its total deformation occurs.
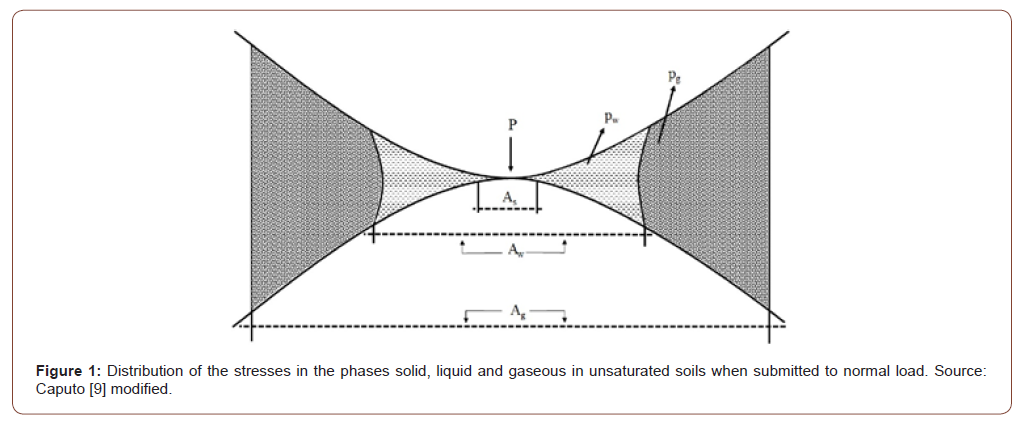
Considering a soil mass, unsaturated, being subjected to external load (P), inside it will develop pressures in the phase solid (ps), liquid (pw) and gaseous (pg). The distribution of pressures is shown schematically in Figure 1.
Considering two solid particles in contact with a surface area As and the total force (load) normal to the plane of contact, in equilibrium condition, have:

then, assuming that P is the total resulting force normal to the plane of contact between two soil particles, from the indications in Figure 1 it may be deduced that:

where: P = normal total force at the point of contact; ps = force acting on the solid phase; pw = force acting on the liquid phase pg = force acting on the gaseous phase; A = total area; Aw = area of the liquid phase; As = area of the solid phase; Ag = area of the gaseous phase.
Assuming that the relation P / A = σ, As / A = ‘a’ and, Aw / A = X, may rewrite equation (3) as:

Considering that ‘a’ is little, so (1-a) → 1; and that, on the contrary, ps is high, so by making a.ps = σ› (effective pressure), may rewrite equation (4), obtaining:

where: σ’= effective pressure at the point of contact; σ = normal pressure in the contact plane; pg = pressure acting on the air and X = coefficient of resistance proportional to the degree of saturation of the soil, being equal to one for the saturated soil and equal to zero for the dry soil and pw = working pressure in the meniscus of water.
Equation (5) represents the principle of effective pressures, proposed by Terzaghi [7] and generalized, for unsaturated soils by Bishop [8]. For unsaturated soils, Tower & Childs [9] and Tower [10] demonstrated that the effective stress or pressure (σ›) may be determined by expression (6):

where: Ψm is the soil matrix suction, and “X” is the resistance parameter.
Mosaddeghi et al. [11], using equation (6), concluded that the increase in soil resistance, defined by the pre-compression voltage and, due to soil matrix suction, can be explained in terms of effective stress (σ›). Caputo [12] emphasizes that all measurable effects of variations in soils, such as compression, distortion and shear strength are due to variations in the effective stresses. According to Braida [13], when the effective stress resulting from the application of normal load on the soil surface exceeds the shear strength at the points of contact between the particles, the compression and deformation processes become eminent.
Shear strength is the resistance (𝜏) that the soil can offer to shear stresses in its matrix or structure, and it is directly related to the cohesion forces between soil particles and to cohesion parameters and the angle of internal friction. Other intrinsic properties of the soil, such as clay content and organic matter are also directly related to soil resistance to shear [14,15].
The effects of soil organic matter on shear parameters are somehow controversial. Some studies [16,17] reported a decrease in shear tension with the increase of soil organic matter due to its capacity to decrease soil density, leading to a reduction in shear strength. On the other hand, soil organic matter increases the cohesion forces between soil particles, which is directly related to soil shear strength [18]. Other studies [13-21] reported increase in soil shear strength with the increase of organic matter in cultivated soils.
Soil mechanical behavior tends to show different values according to the variability of the properties of cultivated soils under different management systems. In Brazil, the types of soil cultivated with sugarcane range from Entisols Quatzipsamments to Oxisols, the latter of which, along with Ultisols, are the most representative soils in the Northeast region [22]. In the state of Pernambuco, the soils of most areas cultivated with sugarcane are Ultisols, Oxisols and, in lower proportion, Gleysols and Spodosols.
Given the above, this study aimed to evaluate the mechanical behavior of an Ultisol cultivated with sugarcane and subjected to the application of vinasse and filter cake for more than 25 years.
Material and Methods
Study area
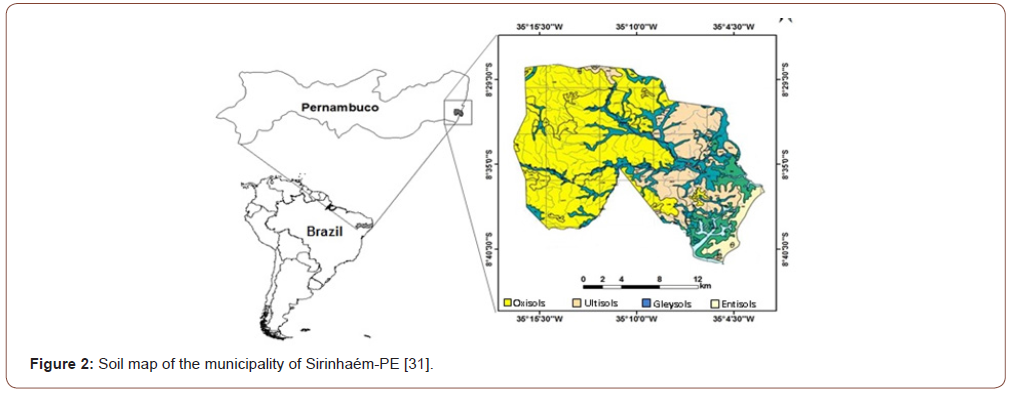
The study was conducted in a sugar and ethanol unit, located in the municipality of Sirinhaém, 80 km away from Recife-PE, Brazil. Two sugarcane cultivation areas were selected from thereabout 17 hectares each, both with Ultisol, one of the three most predominant soils in the region (Figure 2). The two management systems were the applications of filter cake and vinasse. These systems were compared with an area of native forest, which were located on the slope of the terrain.
History and management of the sugarcane cultivation areas
The areas have been cultivated for more than 50 years. Vinasse and filter cake have been applied in the areas of the sugar and ethanol unit for approximately 25 years. In the management system with vinasse application, irrigation is performed for 0.5-2 h in each sprinkler, with water depths ranging from 40 to 45 mm in the ratoon from the second cut on. In the management system with filter cake application (industrial organic residues from sugar production), approximately 40 t ha-1 of filter cake are applied in the total area during the planting.
Chemical fertilization with N-P-K in the areas under vinasse application is performed only in the ratoon, using 500 kg ha-1 of the 21-00-00 formulation, exclusively composed of ammonium sulfate. For areas under filter cake application, 500 kg ha-1 of natural phosphate are applied inside the furrows during the planting and, after 60 days, 500 kg ha-1 of the 15-00-26 formulation, which is exclusively composed of urea and potassium chloride, are applied as topdressing.
Determination of pressures of the machines on the soil
The vehicles considered in this study were used in the sugarcane cultivation areas for planting and periodical soil preparation. In these two operations, the characteristics of the vehicles were recorded: five BH-180 tractors, with mean weight of 10 t. The front axle consisted of two 18.4-26 Goodyear tires with inflation pressure of 179 kPa and the rear axle consisted of two 24.5-32 Goodyear tires with inflation pressure of 165 kPa, both ballasted with 75% of water. These data were plotted in SoilFlex, where the vertical distribution of contact stresses has all been simulated with a contact area as a super ellipse, according to Keller et. al [23].
The model proposed by Keller et al. [11], using analytical equations for vertical propagation of stresses developed by Boussinesq [24] and Frohlich [25], and uses the approach Soane’s [26] to calculate the normal stress. The procedure used by Soane [26] for calculate the load applied by the wheels is to divide the contact area of small elements (i) where each element will have an area (Ai) in which an axial force is exerted (σi) therefore, the point charges σiAi = Pi. Therefore, the vertical stress at a given depth z is calculated by Soane’s approch [42] by equation (7):

where ξ is the concentration factor defined by Frohlich (1934), r is the distance from the load P to the desired point and θ is the angle between the normal vector of the load and position vector of load. The concentrations of factors used for simulations corresponds to the described by Défossez et al. [27].
Soil compressibility test of soils under drained conditions
For the compressibility test, soil samples were collected in each management system using rings with dimensions of ∅i = 0.073 m and h = 0.026 m, with ∅i / h ratio corresponding to 2.80, as recommended by the norm MB 3336/90 of the Brazilian National Standards Organization [28]. The samples were collected in two layers (0-0.20 m and 0.20-0.40 m) in five replicates on a delineament intirely casualized and were evaluated at three water contents (0.42, 0.36 and 0.32 cm3 cm-3), totaling 90 samples for the three management systems.
The test was performed in a loading press with capacity of 1,000kgf consisted in the application of pressures of 12.50, 25.0, 50.0, 100, 200, 400, 800 and 1,600 kPa, established by the norm MB 3336/90 [28]. The readings of vertical deformation were performed using a micro comparator in the beginning of each pressure stage, which lasted for 30 s, and the pressure was increasingly applied on the samples. At the end of the test, the samples were dried in an oven at 105 °C for 24 h.
The data obtained from vertical deformation were inserted in an Excel supplement developed in VBA (Visual Basic for Applications) by Gubiani et al. [29], which makes it possible to calculate the pre-compression pressure and the compression index by Casagrande [30], mathematically operationalized by the Van Genuchten equation [31] (8).

Where θ = is soil water content (cm3cm-3); θr = is soil residual water content, corresponding to permanent wilting point (cm3cm-3); θs = is soil saturated water content (cm3cm-3); α = is a scale parameter inversely proportional to mean pore diameter (cm- 1); Ψ = is soil water potential (kPa) and, n and m are shape parameters of soil water retention curve, m = 1−1/n, 0< m<1, according to van Genuchten [31].
Direct shear test of soils under drained conditions
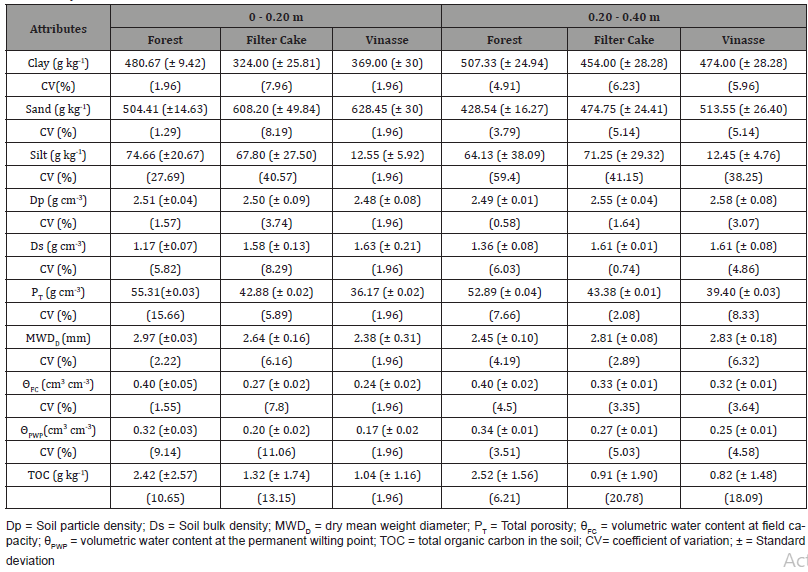
Table 1: Physical characterization of the Ultisol in the studied area.
Samples were collected in the layer of 0-0.20 m in all management systems using a stainless steel box, with dimensions of 0.06 (w) x 0.06 (l) x 0.043 (h) m. Three repetition were collected in each management system on a delineament intirely casualized, which were used in each normal tension (50, 100, 150 and 200 kPa) for the established water contents (0.42, 0.36 and 0.32 cm3cm-3), totaling 108 samples. In the laboratory, the excess of soil was removed and saturated for 48h. Then, the tension table and/or Richards’ chamber were used according to the tensions applied in the samples, which were removed after the drainage stopped, thus establishing the potential equilibrium according with metod’s Richard et al. [32] (Table 1).
The direct shear test was performed according to the norm D-3080/98 of the American Society for Testing and Materials [33], conducted in a direct shear device with shear velocity of 0.125 mm min-1, four stages of normal tensions and the three water contents previously mentioned.
At the end of the test, the data required in Equations (9) and (10) were obtained.

where: σ = normal stress (kgf.cm2, kPa); N = normal force applied on the test body (kgf, N); a = area of the transversal section of the sample (cm2);

where: 𝜏= shear stress (kgf.cm2, kPa); T= force applied on the test body (kgf, N); a = area of the transversal section of the sample (cm2);
Soil cohesion was determined using the value of direct shear stress in each normal stress at the end of the test, by plotting a graph with the relation shear stress x normal stress. Cohesion values were obtained by the intercept of the equation.
Sample collection for soil physical tests
The collection of soil samples for the determinations of soil bulk density, total porosity and soil water retention curve was performed in the layers of 0-0.20 m and 0.20-0.40 m, with five repetition on delineament intirely casualized in each management system, totaling 30 samples for all the management systems. The collection of undisturbed soil samples was performed using an Uhland soil sampler and volumetric rings with height (h) of 0.05 m and internal diameter (∅i) of 0.05 m. In addition, the same number of disturbed soil samples was also collected for the tests of granulometry was carried out by the methodology proposed by Gee et al.[34], particle density and bulk soil by methodology of proposed by Black & Hartge [35] the mean diameter of soil aggregates [36].
Statistical analysis
It was used a delineament intirely casualized. The data were subjected to verification of normal distribution, homoscedasticity and the assumptions of the analysis of variance. Then, the analysis of variance (ANOVA) was performed and means were compared by Tukey test at 5% of probability, using the statistical program SAS, version student 2.0.
Results
Soil water retention curve of the management systems
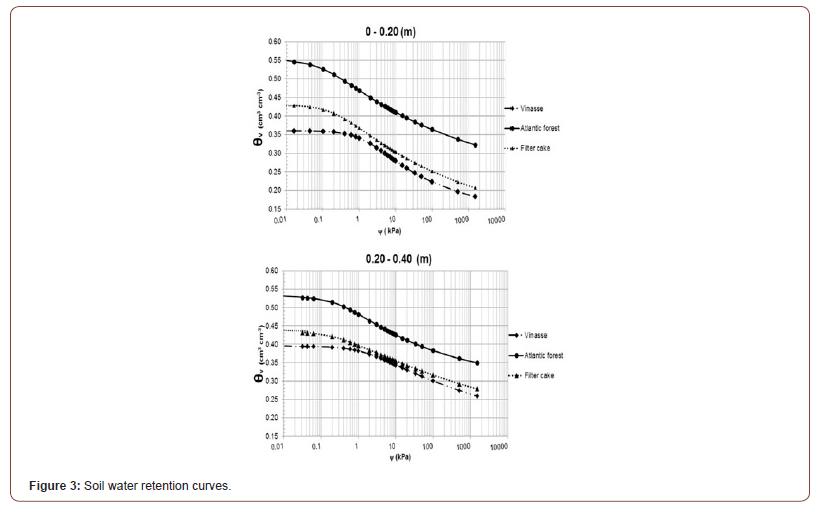
According to the inflection point (α=1/Ψ) of the soil water retention curve (Figure 3), which corresponds to the tension value at which there is exit of water and consequently the entry of air, in both layers, there was an expressive variation between soils under native forest and sugarcane cultivation. In the native forest system, the inflection point occurred at a more negative matric potential, thus difficulty water drainage with the application of the tensions. The exit of water, and consequent air entry, in the systems under native forest and filter cake application occurred at tensions above 1.0 kPa. The soil under Atlantic forest was observed a very expressive change compared to soil under agricultural cultivation, probably the highest content of total organic carbon (Table 2), may have allowed greater retention of water on high matrixial tensions when compared to the other management systems, once, for all systems are within of the same soil class. medium textured soils according EMBRAPA [37].
It is also observed that the volumetric water content selected in the study (0.32; 0.36 and 0.42 cm3cm-3) are nearby to field capacity (Table 1) in either management systems. Thereby, it was decided to establish the same level of volumetric water content the samples under study in order to “isolate” the effect that the increase in the amount of organic matter (OM) has on the increase in the water content retained in the same voltage [25] in both soils under study. Thus, it was possible to equalize the samples in the same volumetric water content in the different levels of tension.
Pre-compression stress (σp) and prediction parameters determined under drained conditions
In the layer of 0-0.20 m, the soil under native forest showed higher values of pre-compression stress (σp), from 101.21 to 143.55 kPa (Table 2), in comparison to the soils cultivated with sugarcane under vinasse and filter cake application. In addition, it showed a reduction in σp, from 143.55 to 101.21 kPa, with the increase in the volumetric water content from 0.32 to 0.42 cm3cm-3. The values of σp with the reduction in water contents are within the range considered from high to high, according to the classification of Horn & Fleige [14]. A more stable organic matter (humus) probably contributed to the increase in soil resistance to compression in the native forest soil, compared with the systems with filter cake and vinasse application. These systems showed contents of total organic carbon (TOC) in the soil of 1.32 and 1.04 gkg-1, respectively, thus differing significantly (p<0.05) from the highest TOC content (2.42 gkg-1), observed in the native forest system.
Table 2: Pre-compression stress of an Ultisol under Atlantic forest and sugarcane cultivation with the application of filter cake and vinasse.
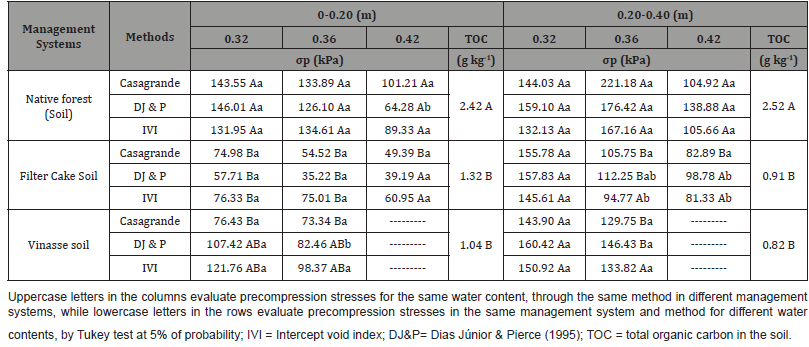
In the system with filter cake application, under the same conditions of volumetric water content, there was a significant reduction (p<0.05) in pre-compression stress compared with the native forest. However, the increase in volumetric water content in this system did not show significant differences (p<0.05) for the means of pre-compression stress and values from 49.39 to 74.98 kPa can be observed, which are considered as low to medium according to Horn & Fleige [14].
In the vinasse application system, it was not possible to obtain σp values at the water content of 0.42 cm3 cm-3, because it was higher than the saturation water content, according to the soil water retention curve (Figure 3). For the layer of 0-0.20 m, this system showed significant difference in relation to the native forest soil, with stress values between 73.34 and 76.43 kPa, not differing statistically from the system with filter cake application. Still for this layer, in all situations, the pre-compression stress tended to de crease in systems with sugarcane cultivation compared with the native forest soil.
For the layer of 0.20-0.40 m in the soils under native forest and residues of the sugarcane application, the factor water content was not significant for the pre-compression stresses, as well as for the different management systems at the water content of 0.32 cm3cm-3. However, for the water contents of 0.36 and 0.42 cm3cm-3, there were significant differences (p<0.05) between the native forest soil and the soils cultivated with sugarcane under filter cake and vinasse application. For the water area of 0.36 cm3cm-3, there was a significant reduction of the pre-compressive pressure of the native forest (221.18 kPa) in relation to the soils cultivated with sugarcane under vinasse and filter cake, which presented respectively σp of 129.75 and 105.75kPa
The mean values of pre-compression stress (σp) dissipated in the cultivated systems (Table 2), in both layers, are close to the values reported by Oliveira et al. [38], in two depths of a Ultisol cultivated with sugarcane. The lowest values for this soil class were reported by Pacheco & Cantalice [39], studying soils with sugarcane cultivation of 4-14 years, where σp values from 34 to 48kPa were observed at the lowest water contents.
Shear strength of soil under drained conditions
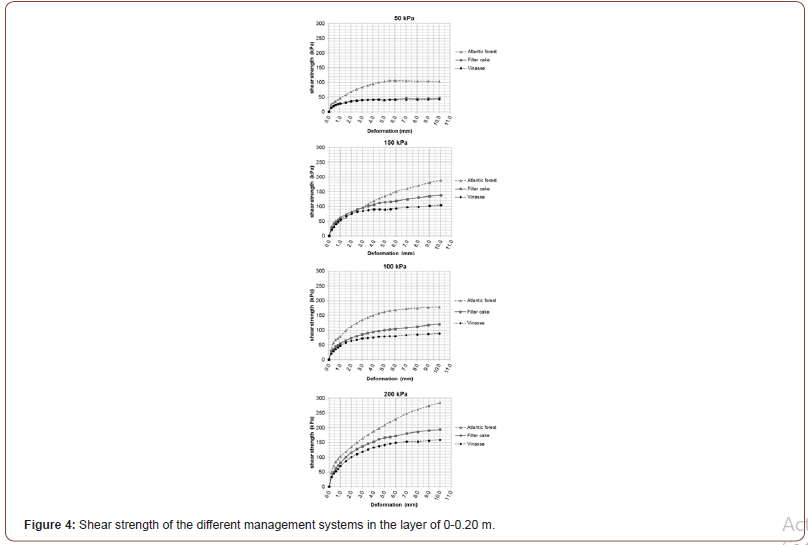
Table 3: Cohesion, internal friction angle of an Ultisol under Atlantic forest and sugarcane cultivation with the application of filter cake and vinasse, in the layer of 0-0.20 m.

The cohesion values of the management systems ranged from 61.23 to 2.06 kPa (Table 3), with significant differences between the native forest and the other systems cultivated with sugarcane, which did not differ significantly at the same water content. With the decrease in volumetric water content, there was a significant increase in cohesion values (Table 3) for the native forest soil, from 22.50 to 61.23 kPa. The higher TOC content in the soil under native forest promoted higher cohesion, which allowed the highest shear strength values (Figure 4) compared with the other systems at the same volumetric water content (0.32 cm3cm-3), as well as in all normal tensions (50,100, 150 and 200 kPa), with shear strength values from 105.0 to 280.0 kPa. Still in Figure 3, the shear strength for the soil cultivated with sugarcane under filter cake application showed higher values from the tension of 100 kPa on (from 120 to 190 kPa), in relation to the management system with vinasse application, which showed values between 90 and 160 kPa.
Simulations of the vertical stress of the agricultural machines in the soil and comparisons with the precompression stress
The highest pressure on the soil surface (Figure 5A) was generated by the tractor’s front tires (229 kPa) compared with the rear tires (215 kPa). The smaller width and size of the front tires, combined with their higher inflation pressure, compared with the rear ones, led to a decrease in the contact area and, consequently, an increase in the contact pressure on the soil surface.
The tractor used for planting and periodical soil preparation in the selected areas under sugarcane cultivation shows a mean weight of about 49 kN per axle and inflation pressures of approximately 179 kPa and 165 kPa in front and rear tires, respectively. Thus, if the dissipation process promoted by sugarcane residues did not exist, the pressure exerted by the tires would cause an additional compaction to the soil, under the tested conditions, since the pressures of front and rear tires are higher than the pre-compression stress and, consequently, these pressures would occur in the plastic region of the soil. Thus, the soil would suffer an irreversible deformation for water contents above 0.32 cm3cm-3 in the layer of 0-0.20 (m) when the machines entered the area.
In Figure 5B, at the depth of 0.25 m, the pressures from rear and front tires were respectively 115 and 95kPa. Thus, the relation between the load applied on soil surface and the evaluated layer corresponds to 2.4:1 for the front tires and 1.8:1 for the rear tires. Therefore, the pressure dissipated until the depth of 0.25 m corresponded to 58% for the front tires and 48% for the rear tires.
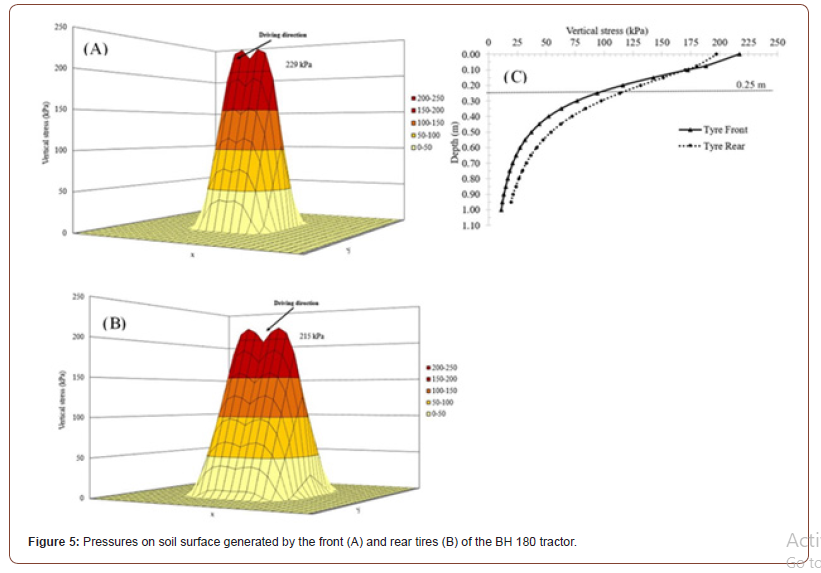
In the layer of 0-0.20 m, the values of pre-compression stress in the system with filter cake application are lower than the pressure exerted by machines on the soil surface. However, in the layer of 0.20-0.40m, most of the pre-compression stresses at all water contents are higher than the pressure exerted by the machines.
Discussion
Pre-compression stress (σp) and prediction relations
The native forest system, where the lowest soil density was observed (Table 1), was expected to show the lowest pre-compression stresses for the studied soil class, as reported by Pacheco & Cantalice [39], Vasconcelos & Cantalice [2] and Oliveira et al. [38], since the external pressure from the agricultural machines are higher than the pre-compression stress in the cultivated areas of this study (Figure 5). In addition, under high moisture conditions, these two factors cause a more dense packing of soil mineral particles, which reduces the amount of pores (macropores) and consequently promote a higher number of contact points between the particles, because, according to Gupta et al. [40], this can result in a new state of resistance to external pressures. However, in the native forest soil, the organic matter caused an increase in soil resistance to compression due to the predominance of the effect of increase in shear strength parameters (cohesion), increase of capillary tension with the increase of the apparent cohesion.
According as observed in the Table 1, all these are grouped as medium texture soils according to EMBRAPA [37]. Soils of cultivated areas have different contents of clay in depth of 0-0.20m However, in all situations, the silt + clay values of the filter cake system (391.80gkg-1) and vinasse (381.55 gkg-1) are higher than 300 gkg-1, so the mechanical behavior in these systems Is influenced by the finer fractions of the soil. Chik & Villajo [41] report that in soils where silt + clay fractions are greater than 300 g kg-1 the finer fractions govern mechanical processes, and Monkul & Ozden [42] concluded that the interval between 190-340 gkg-1 in the contents of silt + clay correspond to the ideal transition range of the mechanical behavior of sandy soils to clayey soils. Thus, in comparison to soil under Atlantic forest (480.67 gkg-1 of clay) it may be affirm wich the systems present same mechanical behavior as to influence of the granulometric fractions on soil mechanic in study.
Thereby, is evident which the lowest values of pre-compression stress in the management systems with filter cake and vinasse application (Table 2) showed the effect of the application of these residues on the process of dissipation of pressures applied to the soil. As reported by Braida [6], the application of plant residues on the soil surface absorbs part of the compaction energy generated using agricultural machines, because the transfer of compaction energy does not occur during residue deformation. Thus, the lowest values of pre-compression stress in the management systems with filter cake and vinasse application showed that sugarcane fibers in these residues, applied for a period of 25 years, were able to dissipate the compaction energy through their deformation, and that the dissipation of compaction energy can be effective for long periods, or at least for 25 years.
Reactions of direct shear strength of the Ultisols under different sugarcane managements in the superficial layer
The higher TOC content in the soil under native forest resulted in an increase of soil cohesion in the layer of 0-0.20m (Table 3). The higher OM content in the native forest, compared with the cultivated soils, possibly promoted an increase in the forces of bonds and/or the establishment of new bonds between soil particles, whether through physical and chemical characteristics of organic molecules or through particle aggregation produced by organic filaments, like fungal hyphae and roots, as mentioned by Soane [43]. Given the above, the increase in soil cohesion not only reflected in the increase in shear strength of this soil (Figure 4), but also in the increase of pre-compression stress in relation to the cultivated soils under vinasse and filter cake application (Table 2), since the increase in soil resistance due to OM will depend on the balance between its joint effects on soil density, shear parameters, capillary tension and the degree of saturation by water [44].
The system with filter cake application showed higher shear strength compared with the system with vinasse application (Figure 4). This can be related to the presence of cellulosic fibers from the filter cake, since according to Gao & Zhao [45], the shear strength of a soil with the presence of fibers is due to two factors: one inherent to soil properties and the other inherent to the fiber itself, for its tensile resistance. Given the nature of the fiber-soil interaction, the response to shearing in the system with filter cake application was strongly influenced by the incorporation of longer fibers in the soil matrix, compared with the system with vinasse application. Therefore, according to Cristelo et al. [46], soil particles transfer normal and shearing stresses to the surface of the fiber, which is stretched until its rupture resistance; only after this, soil particles are totally mobilized, and the fiber contributes to the increase in shear strength. This increase in resistance occurs because organic fibers have higher degree of elasticity. According to Horn [47], these materials, under compression forces, show higher degrees of elasticity compared to soil mineral particles.
The results for shear strength in the filter cake system, when compared with the vinasse system, agree with others in the literature on incorporation of organic fibers for the improvement of soil shear strength, as observed in Prabakar & Sridhar [48]. These authors obtained good results in the increase of soil resistance with the incorporation of up to 0.75% of sisal fibers in the soil matrix [49-52].
Conclusion
The pressures applied on soil surface by the tires of agricultural machines were higher than the pre-compression stress of the studied management systems. However, the application of sugarcane organic residues in the form of vinasse and filter cake allowed good results in the process of pressure dissipation in the areas cultivated with sugarcane, which showed the lowest pressures compared with Atlantic forest soil at all water contents evaluated.
The highest content of soil organic carbon in the soil under Atlantic forest favored the increase in soil cohesion and consequently the increase in soil shear strength, making it less susceptible to deformations. On the other hand, in the soils under cultivation, the presence of organic fibers from filter cake favored an increase in shear strength compared with the soil under vinasse application.
Acknowledgement
None.
Conflict of Interest
No conflict of interest.
References
- Oseji JO, Asokhia MB, Okolie EC (2006) Determination of groundwater potential in Obiaruku and environs using surface geoelectric sounding. Environmentalist 26: 301-308.
- Batayneh AT (2009) A hydrogeophysical model of the relationship between geoelectric and hydraulic parameters, Central Jordan, Journal of Water Resources Protection 1(6): 400-407.
- Batayneh AT, Elawadi EA, Al-Arifi NS (2010) Use of geoelectrical technique for detecting subsurface fresh and saline water: A case study of the eastern Gulf of Aqaba coastal aquifer, Jordan Journal of Coastal Resources 26(6): 1079-1084.
- Ezeh CC, Ugwu GZ (2010) Geoelectrical Sounding for Estimating Groundwater Potential in Nsukka L.G.A. Enugu State, Nigeria, International Journal of Physical Science 5(5): 415-420.
- Iserhien Emekeme RE, Atakpo EA, Emekeme OL, Anomohanran O (2004) Geoelectric Survey for ground water in Agbede, Etsako West LGA, Edo State.
- Nwankwo LO (2011) 2D Resistivity Survey for Groundwater exploration in a Hard Rock Terrain: A Case Study of MAGDAS Observatory, UNILORIN, Nigeria, Asian Journal of Earth Science (In Press).
- Okolie EC, Osemeikhian JEA, Asokhia MB (2005) Estimate of groundwater in parts of Niger Delta Area of Nigeria using Geoelectric method, Journal of Applied Sciences and Environmental Management 9(1): 31-37.
- Olowofela JA, Jolaosho VO, Badmus BS (2005) Measuring the electrical resistivity of the earth using a fabricated resistivity meter, European Journal of Physics 26(3): 501-515.
- Omosuyi GO, Adeyemo A, Adegoke AO (2007) Investigation of groundwater prospect using electromagnetic and geoelectric sounding at Afunbiowo, near Akure, South Western Nigeria, Pacific Journal of Science Technology 8: 172-182.
- Oseji JO, Atakpo EA, Okolie EC (2005) Geoelectric Investigation of the Aquifer Characteristics and Groundwater Potential in Kwale, Delta State Nigeria, Journal of Applied Sciences and Environmental Management 9: 157-160.
- Tammaneni KR, Hanuman DS, Malisethy JG (2006) Site investigations for the identification of a groundwater source for Sullurupeta, Andrha Pradesh, India, IAEG Publication, p. 36.
- Obiadi II, Onwuemesi AG, Anike OL, Obiadi CM, Ajaegwu NE, et al. (2012) Modeling crystalline rock permeability and porosity from geological and geophysical field studies: the Igarra example. International Journal of Electron and Engineering Resources 1(1): 5-15.
- Obiadi II, Onwuemesi AG, Anike OL, Obiadi CM, Ajaegwu NE, et al. (2013) Determining subsurface fracture characteristics from Azimuthal square array resistivity survey at Igarra, Nigeria. Pure Applied Geophysics 170(5): 907-916.
- Okolo CM, Akudinobi BEB, Obiadi II, Okoyeh EI (2017) Assessment of pollution status of lower Niger drainage area, south-Eastern Nigeria using heavy metals. Journal of Basic Physics Resources 3(2): 59-67.
- Okolo CM, Akudinobi BEB, Obiadi II, Onuigbo EN, Obasi PN (2018) Hydrochemical Evaluation of Lower Niger Drainage Area, Southeastern Nigeria. Applied Water Science 8(201): 1-9.
- Ozoemenam JC, Akudinobi BEB, Nnodu VC, Obiadi II (2018) Water quality assessment of shallow and deep boreholes in Ekpan Community, Effurun, Delta State, Nigeria. Environmental Earth Science 77(5): 170-188.
- Foster SSD (1987) Fundamental concepts in aquifer vulnerability. Pollution Risk and Protection Strategy 38: 69-86.
- Fritch TG, McKnight CL, Yelderman JC, Arnold JG (2000) An aquifer vulnerability assessment of the paluxy aquifer, central Texas, USA, using GIS and a modified DRASTIC approach. Journal of Environmental Management 25: 337-345.
- Mohammadi K, Niknam R, Majd V (2009) Aquifer vulnerability assessment using GIS and fuzzy system: a case study in Tehran-Karaj aquifer, Iran. Journal of Environmental Geography 58: 437-446.
- Mundel JA, Lother L, Oliver EM, Allen-long S (2003) Aquifer Vulnerability Analysis for Water Resource Production. Indian Department of Environmental Management, p. 25.
- Foster SSD (1984) African groundwater development-the challenges for hydrogeological science. In: Challenges in African Hydrology and Water Resources, Proceedings of the Harare Symposium 144: 3-12.
- Odoh IB, Utom AU, Nwaze SO (2012) Groundwater prospecting in fractured shale aquifer using an integrated suite of geophysical methods: a case history from Presbyterian Church, Kpiri Kpiri, Ebonyi state, SE Nigeria. Geosciences 2(4): 60-65.
- Udosen ED (1998) Level of Trace Metals in Sediment from Qua Iboe River and it Tributary Journal of Science and Engineering Technology 5(8): 982-994.
- Federal Environmental Protection Agency (FEPA) (1991) National Guidelines and Standards for Industrial Effluents, Gaseous Emission and Hazardous Waste Management in Nigeria, Federal Environmental Protection Agency, Lagos, Nigeria.
- Waziri M, Ogungbuaja VO, Dumari GA (2009) Heavy Metal Concentration in Surface and Groundwater Samples from Gashua and Nguru Areas of the Yobe State, Nigeria. Integrated Journal of Science and Engineering 8(1): 58-63.
- Wells RG (1977) Water Quality Standard and Criteria. Water Pollution and Control 7725, pp. 30.
- World Health Organization (WHO) (2006) Guidelines for Drinking Water Quality, Recommendation WHO, Geneva 1-3: 569-571.
- World Health Organization (WHO) (2011) Guidelines for Drinking-Water Quality. World Health Organization, Geneva.
- Kola BG, Baba S (2004) Analysis of some water samples from Hong Local Government Area of Adamawa State, Nigeria: Borno Journal of Geology 3(4-5): 54-59.
- Kearey P, Brooks M, Hill I (2002) An Introduction to Geophysical Exploration, third ed. Blackwell publishing, pp. 183-207.
- Alile OM, Amadasun CVO, Evbuohuwan AI (2008) Application of Vertical Electrical Soundaing Method to Decipher the Existing Subsurface Stratification and Groundwater Occurrences Status in a Location in Edo North of Nigeria. International Journal of Physical Sciences 3(10): 245-249.
- Dobrin MB, CH King (1976) Introduction to Geophysical Prospecting. 4th Edition McGraw Hill Book Com, New York.
- Orellana E, Mooney HM (1966) Master Tables and Curves for Vertical Electrical Sounding over Layered Structures. Interciencia, Madrid, Spain pp.159.
- Zohdy AAR (1969) The use of Schlumberger and Equatorial soundings in ground water Investigations near El Paso, Texas. Geophysics 34: 713-722.
- Vander BPA (2004) Win Resist Version 1.0 M. Sc Research Project ITC, Deft, Netherlands.
- Vander Berg J (2008) Exploring Shallow Groundwater Irrigation. Current status and future application. A case study in the Atankwidi catchment, Ghana; M.Sc. Thesis, Delft University of Technology, Delft, Netherlands, pp. 1-35.
- Oladapo ML, MZ Mohammed, OO Adeoye, BA Adetola (2004) Geo-electrical investigation at Ondo state housing corporation Estate, Ijapo, Akure, Southwestern Nigeria. Journal of Mining Geology 40(1): 41-48.
- Oladunjoye MA, Akanji AO, Akingbesote OT (2013) Groundwater exploration in Alakuta-Awotan area of Ibadan, southwestern Nigeria. Journal of Geology and Geoscience 2: 124.
- Oladunjoye MA, Olayinka AI, Adegun AA (2014) Hydro-geophysical evaluation of groundwater potential of the University of Ibadan campus, Southwestern Nigeria. Water Resource 24(1&2): 88-118.
- Oseji JO, Egbai JC, Etebefa CE (2018) Investigation of the Aquifer Protective Capacity and Groundwater Quality around Some Open Dumpsites in Sapele Delta State, Nigeria. Applied Sciences and Environmental Management, pp. 67-92.
-
Wagner Luís da Silva Souza, José Ramon Barros Cantalice, Brivaldo Gomes de Almeida. Mechanical Behavior of an Ultisol Under Different Sugarcane Management Systems in Brazil. World J Agri & Soil Sci. 5(3): 2020. WJASS.MS.ID.000613.
-
Oghara, Aquifer, Vulnerability, Layers, Dumpsites, Contamination
-

This work is licensed under a Creative Commons Attribution-NonCommercial 4.0 International License.


