


 Research Article
Infiltration and Swelling Under Capillary Flow
Received Date: September 28, 2019; Published Date: October 04, 2019
Abstract
The theory of water movement in swelling soils has experienced significant change since Haines, in 1923, first explored the relationships of expansion and subsidence. The present work deals with the swelling associated with the upward movement of water into an initially air-dry clay soil. The movement of the wetting front, cumulative imbibition, and change in sample height are shown to be linear functions of the square root of time. A linear piecewise model is used to estimate the change in the volume fraction of the solid resulting from an increase in the moisture content: relationships between θ and z, and ϑ and m result.
Introduction
Most experimentation into the physical responses of swelling systems, under the influence of an increase or decrease in moisture content, has been confined to saturated clays and/or infiltration vertically downward under ponded conditions. The flux of water, vertically downward or upward, has similar mathematical formulations. The direction of flow primarily affects the boundary and initial conditions statement and the consideration of gravity components on the system.
The experiments performed by Smiles [1-3] were for infiltration into a saturated swelling system (1973, 1974) or drainage of a saturated swelling system (1968). Smiles chose, as an initial condition, a saturated initial condition because the use of a saturated condition results in a simplification of the mathematics without affecting the physical phenomenon. Smiles’ experiments began by permitting air-dry clay to saturate with distilled water by capillary rise. The clay was laterally restrained and supported a 10 kg/m2 load. Here, it is intended to explore the initial wetting and swelling associated with the capillary rise in a swelling clay system with no load imposed on the surface
The governing equation for one-dimensional capillary rise into a layer of uniform soil is a combination of Darcy’s Law and the continuity requirement which yield [4-6]:
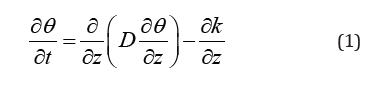
Subject to the boundary and initial conditions:
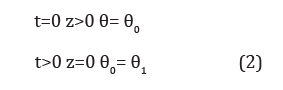
where 0 θ is the initial volumetric moisture content of the airdried soil, θ1 is the final volumetric moisture content of the soil, and z is positive upwards. When the effect of gravity can be neglected (‘horizontal’ and ‘small-time’ unsteady vertical systems [7]), (1) takes the form of the diffusion equation:
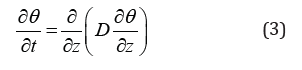
where solutions evolve from the use of the Boltzmann transformation, which reduces (3) to an ordinary differential equation.
In a swelling system, the water and the solid move, relative to an external observer; therefore, descriptions in physical space are inherently difficult. A transformation from a physical coordinate system to a fixed reference coordinate system (material coordinate system) simplifies the relationships of the water balance in a swelling soil profile. Raats and Klute [8] first formulated a material coordinate based on the continuum theory of mixtures, arguing that soil can be regarded as a mixture of phases. A more detailed discussion of material coordinate characteristics and their use in soil deformation problems is presented in Baveye et al [9], and anelegant thermodynamic description of swelling in air-clay-water systems is presented by Sposito [10].
If the volume change in a swelling soil may be treated as a 1-dimensional problem, the movement of water is based on material balance equations for the solid and the water coupled with an equation describing the flow of water in response to a force [11]. The volume fraction of the solid and the water are given by:
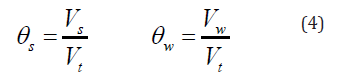
where Vs is the volume of the solid, Vw is the volume of water, and Vt volume.
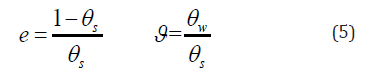
The swelling of the soil with changing moisture content depends on how the void ratio, e, varies with the moisture ratio, ϑ ; where e and ϑ are defined as:
The material balance equation for the water and the solid are given by:
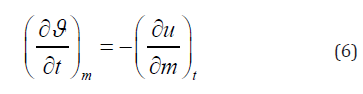
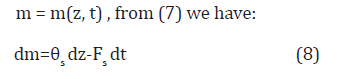
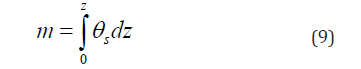
where u is the flux of water relative to the solid, and m is a material coordinate, such that:
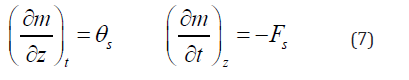
Where Fs is the volume flux density of the solid relative to an external observer. Since
If the integration of (8) is based on a surface, z = 0, where Fs =0 (i.e., a point where the material is fixed), then:
Smiles [1-3], inspired by the “illustrative examples” of Philip [12-14], derived a material coordinate that refers to a state of zero porosity. Smiles reported that the change in sample height in swelling clay was proportional to the square root of time and that infiltration into saturated clays may be regarded as a sorption process, since the effect of gravity is reduced for extended periods of time.
The objective of this work was to examine the response of an unsaturated swelling soil undergoing upward flow
Material and Methods
Soil from the 0-30 cm depth of a Sharkey clay (Vertic Haplaquept), from the Hester farm in Bolivar County, MS (Grid 87, 1958 USDA Soil Survey, MSEA site), was brought to the USDA-ARS National Sedimentation Laboratory in Oxford, MS, air-dried, and crushed to pass through a 2-mm sieve. Soil texture was determined to be 67% clay, 28% silt, and 5% sand. An x-ray analysis of a random sample established smectite as the dominant clay mineral.
The soil was uniformly packed in a plexiglass column, with an inside diameter of 260 mm, above a fine sand filter (35mm depth) to a depth of 118mm in 12 incremental layers, containing approximately 0.8 kg of soil per layer. The bottom of the cylinder was attached to a reservoir, and a constant water table was maintained 35 mm from the bottom column and reservoir, along with the Mariotte bottle, were placed on balances to determine the mass of water entering the soil. The wetting front was visually monitored using 3 translucent rulers mounted vertically, 120° apart. The movement of water within the soil profile was recorded with 200mm Time Domain Reflectometry (TDR) volumetric moisture probes. The TDR probes were installed horizontally in the soil column during the packing process at 25 mm intervals. At each probe location additional coaxial cable was loosely spiraled around the probe prior to routing the cable to the data collector, allowing free movement of the probe with the soil. The surface heave was calculated from multiple point surface elevation maps produced from an automated infrared laser [15,16]. The surface elevation maps were 75mm x 225mm, the x-direction spacing between points was 0.45 mm and the y-direction spacing was 1.5mm. The surface heave was calculated by averaging three surface maps from measurements taken at 60° intervals, then computing the change in volume from the initial volume. Figure 1 is a photograph of the experimental setup.

In the experiments, the sidewalls of the cylinder were not greased to allow visual measurements of the advancing wetting front. We address this issue further in the discussion.
The soil was packed in the cylinder and no surface load was imposed on the sample. At t=0 , distilled water entered the soil, at the clay-sand interface (z=0).
Periodic measurements were made of the water balance, surface heave, and moisture content, initially at hourly intervals decreasing to daily intervals as the experiments progressed. Three experiments were performed under similar laboratory conditions with durations ranging from 4.4 to 13.1 days. The initial bulk density of the soils ranged from 1470 to 1530 kg/m3. The soil column was continuously covered between surface measurements to counteract the evaporative process.
Results and Discussion
The results from the experiments suggest that the movement of the wetting front (Figure 2), cumulative imbibition (Figure 3), and change in sample height (Figure 4) were linear functions of the square root of time for a period of approximately 75hrs. After the initial 75hrs, the wetting front reached the top of the soil column and the slope shown in Figures 2-4 decreased to near 0.


As the TDR probes moved with the soil, each probe was at
constant m but varying z , the TDR measurements were taken with
respect to m ; therefore, the graphic representation of the volumetric
moisture content with respect to the Boltzmann variable, cannot be expressed without knowledge of the physical coordinate
z. In its (Figure 5). We seek a transformation from the material
coordinate,
cannot be expressed without knowledge of the physical coordinate
z. In its (Figure 5). We seek a transformation from the material
coordinate, to the physical coordinate, z, for our data set.
Integration of (8), with 0=Fs=0, gives:
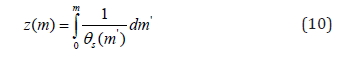
The m values of the TDR probes are found using m =θsi zi , as θsi is known. The TDR probes give us θw(m, t), which we need to convert to θs(m, t) to numerically integrate (10). We do this by assuming a linear piecewise model for the swelling curve:
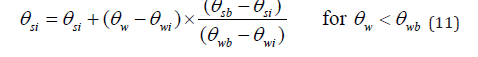
where θsi and θwi are the known initial values, θwi and θwf are the known final values, 149 and θsb and θwb are break point values for the volume fraction of the solid and the water, 150 respectively
The θs realized from (11) were used with the θw
to determine e and ϑ , using (5). The elevation of the surface, zs,
was calculated with respect to time using (10), (11), and θw. θsb and
θwb were parameters which controlled the location of the shrinkage
curve break point (defined as the separation point between the
residual and normal ranges of the soil shrinkage curve (Figure 6),
and were chosen, through an iterative process, to minimize the
variance between the calculated and measured surface elevations
(Figure 7). This procedure gives us the swelling curve shown in
Figure 6, which is similar in feature and magnitude as curves seen
in the work of Bronswijk [17,18] and Garnier et al [19]. Now, we
have the desired information to recast Figure 5 in terms of  ,
look at the calculated surface elevation compared to the measured
surface elevation (Figure 7), and plot the relationship between θw
and
,
look at the calculated surface elevation compared to the measured
surface elevation (Figure 7), and plot the relationship between θw
and  (Figure 8).

Measurements of the type described above require that the soil be free to move along the sidewalls of the cylinder. In practice, greasing the sidewalls of the container may enable the soil to slip along the boundary, but in dry clay soils the grease can obscure measurements of the wetting front, and the soil near the sidewalls of the container will absorb the grease. To test the boundary condition at the sidewall for curvature or large-scale deviations from a uniform surface profile, we must look at the measurements of the surface elevation in time. Plots of the surface elevation for various points in time are presented in Figure 9. The maximum deviation in surface elevation was 1mm, 2.7mm, 4.7mm, and 5mm, respectively, for increasing time. There was an increase in curvature at the boundary with the side wall; however, if we consider the linear portion of the measurements taken at 69.4hrs and assume there was no curvature near either side wall and compute the percent change between the assumed linear surface and the measurements presented in Figure 9, there was a 4.1% decrease in volume from the assumed linear surface and the actual measurements. Similarly, the percent change in volume for time steps 21.4hrs and 41.5hrs were 0.9% and 2.7%, respectively. The decrease in volume due to the curvature at the sidewall boundary was 6.6 x 10⁻⁵ m3 for the 69.4hr time step, 3.5 x 10⁻⁵m3 for the 41.5hr time step, and 8 x 10⁻⁶ m3 for the 21.4hr time step. The impact of the side wall boundary would have been greater had the cylinder been smaller in diameter, but the measurements of the surface were linear over 2/3 the diameter of the cylinder at the 69.4hr time step. Therefore, soil sticking to the sidewalls of the cylinder did not play a significant role in the calculations of the surface heave but did influence the visual measurements for the wetting front.

In Figure 8, we can see that the graph of θw vs z / t does not agree with Figure 2 in the respect that there was a discrepancy with the wetting front arrival time at the TDR probes versus the visual measurements of the wetting front along the cylinder walls. More importantly, if the system was described as a purely diffusive system, the curves for each time would lie on top of each other. However, the measurement volume of the TDR probes affected the arrival time of the wetting front. This discrepancy in the wetting front visual measurements (with the TDR recording the front at higher positions than the visual measurements) continues for all times as can be seen in Figures 2,8&9. The discrepancy between Figures 2& 8 was most likely a combination of two experimental artifacts: edge effect and sampling volume. First, the measurements in Figure 2 are visual measurements of the wetting front along the edge of the cylinder wall. From Figure 9, we see that a visual measurement of the wetting front at 69.4hrs, if the wetting front was at the soil surface at this time, would be 5mm below the actual wetting front. Second, the measurement volume of the TDR probe is elliptical in shape. The diameter of the vertical axis of the ellipse could be 20 mm or more [20-22]. This means that the probe may register the wetting front at least 10 to 20mm before the front reached the physical position of the probe. A consideration of these two experimental artifacts resulted in a correction for the physical position of the wetting front (z–Δz), as related to the location of the TDR probe. The correction to the wetting front position, Δz, was 20mm. This means that in all cases, the TDR probe was detecting the wetting front 20 mm before the front actually reached the probe. Implementing the correction to the data presented in Figure 8, we now see that the data match onto one another (Figure 10). The sharp front at z-Δz = 1.75 (shown as the dashed line in Figure 10), agrees with the expected error derived from the visual measurements along the cylinder wall (Figure 2) and the early detection of the wetting front derived from the measurement volume of the TDR probe.


Conclusion
The investigations of the upward movement of water into an initially air-dry swelling soil were inspired by the work of Smiles [18,20]. Like the problem of infiltration downward into a saturated swelling soil profile, the problem of capillary rise into an unsaturated swelling soil profile, evaluated from a material coordinate reference, provides complimentary results. However, the measurements from the TDR probes were corrected to account for an early wetting front arrival time, due in part to the measurement volume of the probe.
Acknowledgement
None.
Conflict of Interest
No conflict of interest.
References
- Smiles DE, MJ Rosenthal (1968) The movement of water in swelling materials. Aust J Soil Res 6(2): 237-248.
- Smiles DE, AG Harvey (1973) Measurement of moisture diffusivity of wet swelling systems. Soil Sci 116(6): 391-399.
- Smiles DE (1974) Infiltration into a swelling material. Soil Sci 117(3): 140-147.
- Parlange JY, Donald Aylor (1972) Theory of water movement in soils: 9. The dynamics of capillary rise. Soil Science 114(2): 79-81.
- Philip JR (1957b) The theory of infiltration: 1. The infiltration equation and its solution. Soil Science 83: 345-357.
- Philip JR (1966) The dynamics of capillary rise. Unesco Symposium on Water in the Unsaturated Zone 11: 559-564.
- Philip JR (1969c) Hydrostatics and hydrodynamics in swelling soils. Water Resources Res 5(5): 1070-1077.
- Raats PAC, A Klute (1969) One-dimensional, simultaneous motion of the aqueous phase and the solid phase of saturated and partially saturated porous media. Soil Sci 107(5): 329-333.
- Baveye Philippe, Charles W Boast, Juan V Giráldez (1989) Use of referential coordinates in deforming soils. Soil Science Society of America Journal 53(5): 1338-1343.
- Sposito Garrison (1973) Volume changes in swelling clays. Soil Sci 115(4): 315-320.
- Smiles DE (1997) Water balance in swelling materials: some comments. Aust J Soil Res 35(5): 1143-1152.
- Philip JR (1968) Kinetics of sorption and volume change in clay-colloid pastes. Aust J Soil Res 6(2): 249-267.
- Philip JR (1969a) Moisture equilibrium in the vertical in swelling soils. 1. Basic theory. Aust J Soil Res 7(2): 99-120.
- Philip JR 1969b) Moisture equilibrium in the vertical in swelling soils. 2. Applications. Aust J Soil Res 7(2):121-141.
- Römkens MJM, S Singarayar, CJ Gantzer (1986) An automated noncontact surface profile meter. Soil and Tillage Res 6(3): 193-202.
- Römkens MJM, JY Wang, RW Darden (1988) A laser microreliefmeter. Transactions of ASAE 31(2): 408-413.
- Bronswijk JJB (1988) Modeling of water balance, cracking and subsidence of clay soils. Journal of Hydrology 97(3-4): 199-212.
- Bronswijk JJB (1991) Drying, cracking, and subsidence of a clay soil in a lysimeter. Soil Sci 152(2): 92-99.
- Garnier Patricia, Rafael Angulo Jaramillo, David DiCarlo, Tim WJ Bauters, Christophe JG Darnault, et al. (1998) Dual- energy synchrotron X ray measurements of rapid soil density and water content changes in swelling soils during infiltration. Water Resources Res 34(11): 2837-2842.
- Knight JH (1992) Sensitivity of time domain reflectometry measurements to lateral variations in soil water content. Water Resources Research banner 28(9): 2345-2352.
- Haines WB (1923) The volume changes associated with variations of water content in soils. The Journal of Agricultural Science 13(3): 296-310.
- Philip JR, DE Smiles (1969d) Kinetics of sorption and volume change in three- component systems. Aust J Soil Res 7(1): 1-19.
-

This work is licensed under a Creative Commons Attribution-NonCommercial 4.0 International License.


