 Research Article
Critical Analysis of Soil for Better Rice and Sugarcane Farming in Thanjavur Region of India
Muthukumaran Shanmuganathan1 and Annamalai Rajendran2*
1Department of Chemistry, Panimalar Engineering College, Chennai, Tamilnadu, India
2Department of Chemistry, Sir Theagaraya College, Chennai, Tamilnadu, India
Annamalai Rajendran, Department of Chemistry, Sir Theagaraya College, Chennai, Tamilnadu, India.
Received Date: June 11, 2020; Published Date: July 06, 2020
Abstract
Understanding the quality of soil by analyzing all soil quality parameters with reference to a particular crop is difficult and time consuming. Therefore, the need for soil quality index was formulated with scientific strategies. Heber Soil Quality Index (HSQI) was exploited in this study to understand the overall quality of Thanjavur region for better rice and sugarcane production. Thanjavur is one of the important cities of Tamil Nadu often referred as rice bowl of the state. Different varieties of crops are being cultivated in the district which includes paddy, sugarcane, pulses and coconut. The farmers in the district are very progressive and innovative in adopting modern technologies and crop varieties. The ultimate HSQI values of the samples examined in the current inspection ranged from 66.26 – 80.27 which suggests that they are of medium to good quality. The index was found to be time saving and economical way of assessing the fertile nature of the soil for the effective cultivation of rice and sugarcane. The twelve parameters in the HSQI are proved highly useful.
Keywords: Micronutrients; Bulk density; Heber soil quality index; Chloride; Electrical conductivity; Total organic matter; Bacterial content
Introduction
Soil productiveness refers to the capability of a soil to supply essential nutrients for plant growth. It encompasses soil fertility, plus all the other factors affecting plant growth, including soil management [1]. All productive soils are fertile for the crops being grown, but many fertile soils are unproductive because they are subjected to drought or other unsatisfactory growth factors or management practices [2]. There is a strong positive correlation in productive soils between fertility and physical properties so that highly productive soils have desirable physical properties as well as high fertility [3]. Although the focus of this article is on plant nutrients, managing these properly is only one part of best soil management practice which also involves consideration of soil organic matter, soil texture and the maintenance of a thriving soil microbial population [4]. Soil analysis is an aid to managing soil nutrients efficiently to maintain soil fertility for those nutrients like phosphorus, potassium and magnesium that are retained in the soil (in plant available forms) [5]. Soil testing refers to the chemical analysis of soils and is well recognized as a scientific means for quick characterization of the fertility status of soils and predicting the nutrient requirement of crops. Researchers in Bishop Heber College, India have formulated a Soil Quality Index called after their names as Heber Soil Quality Index (HSQI) for the first time in India. In the present work, an attempt has been made to use the already formulated Heber Soil Quality Index (HSQI) to assess the suitability of a soil of a chosen area for the cultivation of rice and sugar cane. Though there are more than twenty five parameters available to ascertain the suitability of soil for the cultivation of rice and sugarcane, only twelve parameters are considered to be more than enough to determine the soil quality according to the valuable suggestions offered by agricultural scientists, soil chemists and other experts. The twelve parameters are available nitrogen (kg/ ha), pH, water holding capacity (%), available phosphorus (kg/ha), texture, available potassium (kg/ha), organic matter (%), bacterial content (SPC/g), electrical conductance (mmho/cm), chloride (mg/L), total hardness (mg/L) and bulk density (g/cm3) [6].
Materials and Methods
Study area
Thanjavur district lies between 9º 50’ and 11º 25’ North latitude and 78º 45’ and 79º 25’ East longitude. The geological formation of the major area of Thanjavur district is occupied by the Alluvial and Tertiary deposits. Soils in these areas are found to be with red, black and brown colours. Rice and sugarcane are the major crops being cultivated in these areas. Thanjavur is designated as the rice bowl of Tamilnadu. Surface soils were collected from fifteen different places in Thanjavur area such as Deekshasamudram, Kaduveli, Kalayanapuram, Kandiyur, Karuppur, Keelathirupanthuruthi, Konerirajapuram, Maharajapuram, Marur, Nadukkavery, Punavasal, Sathanur, Tiruvalampozhil, Valappakudi and Varagur.
Soil sampling, processing and storage procedure
First of all, the junk part of the soil from each sampling area was removed. Soil samples were collected by digging from five places of each sampling area (four corners and middle place from a depth of 15cm) using a scoop. Five sub samples and one composite sample were collected from each sampling area. From this 1Kg of composite sample, foreign materials like roots, stones, pebbles and gravels were removed. The collected soil sample of each study area was taken in a clean cloth bag and labeled with the information like name of the farmer, location of the farm, survey number, previous crop grown, present crop, crop to be grown in the next season, date of collection and name of the sampler etc [7].
Table 1: Methods of Determination, Optimum Range and Weighting factor of Various Parameters.
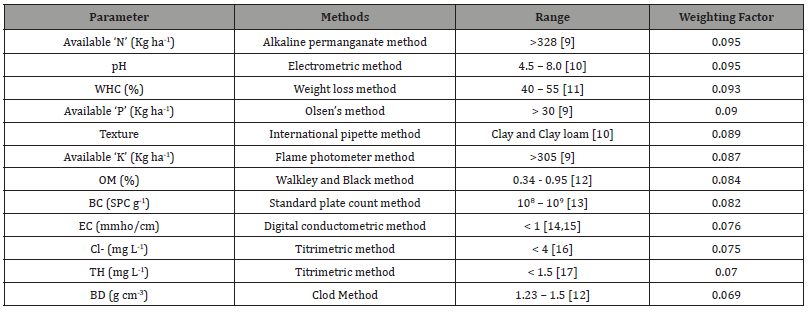
Each soil sample was assigned a sample number and entered in the sample register of a soil testing laboratory. The collected sample was dried under a shade by spreading on a clean sheet of paper after breaking the large lumps if present. Each soil sample was spread on a separate paper or a clean polythene sheet and it was powdered using wooden mallet and sieved to obtain soil particles of 2-mm size. This ultimate soil sample which was taken in new polythene bag with proper labeling for laboratory analysis. One kg of the sample in each type was collected and quality was assessed according to HSQI table consisting of the twelve important parameters namely available Nitrogen (kg/ha), pH, water holding capacity (%), available phosphorus (kg/ha), texture, available potassium (kg/ha), organic matter (%), bacterial content (SPC/g), electrical conductance (mmho/cm), chloride (mg/L), total hardness (mg/L) and bulk density (g/cm3). The values of each test were determined using the methods given in (Table 1).
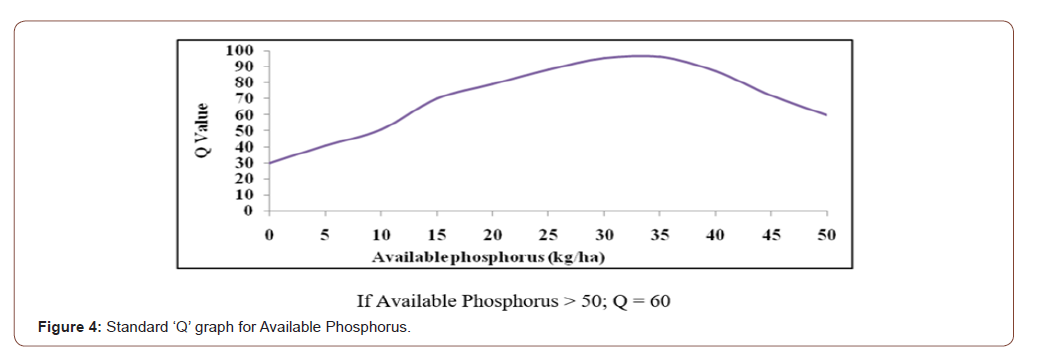
The twelve parameters selected in the present study for the formulation of HSQI are either directly or indirectly related to other parameters. To design the HSQI table, data were collected from agricultural scientists, soil experts and eminent in this area. They were asked to: (i) arrange the selected twelve parameters in their order of importance, (ii) make scoring on a 10 - point scale with ‘0’ indicating the lowest rating and ‘10’ the highest, (iii) assign weighting curve value (Q -Value) (Table 1) and (iv) draw the graph for each parameter according to the permissible limit and tolerance limit.
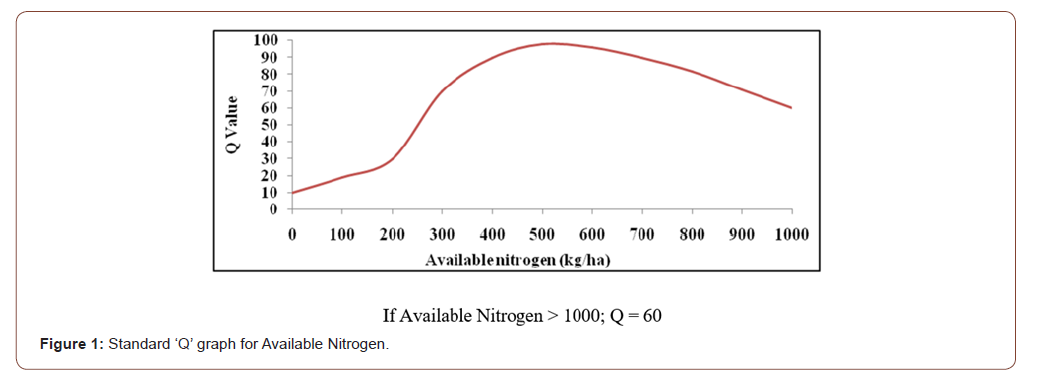
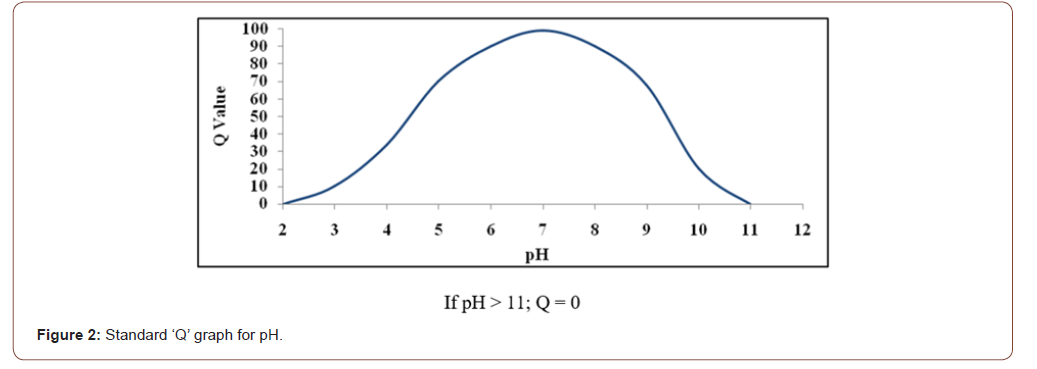
The information like the test result, weighting factor and the ‘Q’ value were used to formulate the soil quality Index. In accordance with HSQI formulation, if the total HSQI value is above 90, then the soil sample is considered to be excellent and is highly suitable for the cultivation with special reference to rice and sugarcane. If the total HSQI value ranges from 70 to 90, then the sample is good in quality. If the value lies between 50 and 70, then the soil quality is considered to be medium, and if it is below 50, then the sample is bad from which no good yield could be expected. ‘Q’ values of each sample were calculated from Figures 1 - 12.



Results and Discussion
The analytical data of the samples examined are presented in Tables 2 - 5. The overall HSQI values of all samples ranged from 66.26 – 80.27, which indicates that the quality of these soils is medium too good for the cultivation of rice and sugarcane.
Among the various soil samples analyzed, sample 13 (Tiruvalampozhil) (Table 4) was found to have high total HSQI value, 80.27. This shows that this sample is good for cultivation of rice and sugarcane. Among the twelve parameters tested for this sample, the test results of the parameters such as pH (7.7), water holding capacity (50.66 %), texture (silty clay), available potassium (333.3 kg/ha), organic matter (0.96 %), electrical conductance (0.46 mmho/cm) and bulk density (1.33 g/cm3) were found to be excellent in accordance with the optimum range required for the best cultivation of rice and sugarcane. Texture reported in the soil sample is silty clay, which causes that high water holding capacity of the soil because it contains small pores and water move slowly in these pores. So that, water holding capacity of these soils was found to be high. The results of the soil samples reveal that it has high organic matter as well as high water holding capacity. High electrical conductivity of soil sample shows that, it contains high salt concentration. The HSQI values of pH, water holding capacity, texture, available potassium, organic matter and bulk density were found to be extremely good with 8.93, 8.84, 8.46, 8.35, 7.14 and 6.49 respectively. The parameters such as available nitrogen (264 kg/ha) and available phosphorus (122.1 kg/ha) contributed moderately to the quality of this soil sample with the HSQI values of 5.89 and 5.40 respectively. Bacterial content, chloride and total hardness do not significantly contribute to the quality of this sample.
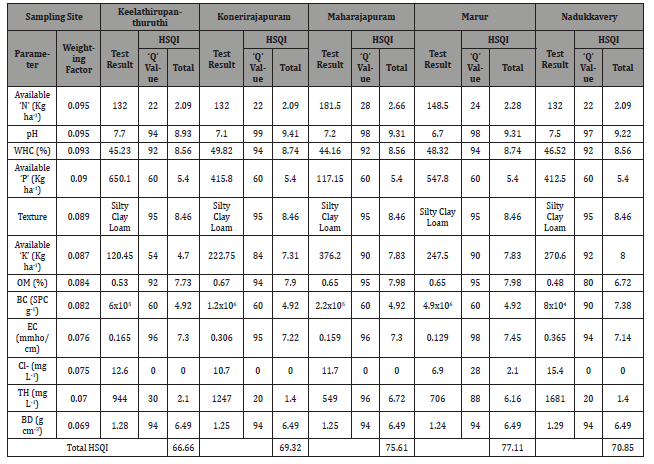
The sample 6 (Keelathirupanthuruthi) (Table 3) registered low total HSQI value, 66.66. This suggests that this sample is of medium quality for the cultivation of rice and sugarcane. The pH (7.7), water holding capacity (45.23 %), texture (silty clay loam), organic matter (0.53 %), electrical conductance (0.165 mmho/cm) and bulk density (g/cm3) were found to be good as per the optimum range required for the best cultivation. The HSQI values of pH, water holding capacity, texture, organic matter, electrical conductance and bulk density were found to have 8.93, 8.56, 8.46, 7.73, 7.30 and 6.49 respectively. The parameters such as available phosphorus (650.1 kg/ha), available potassium (120.45 kg/ha) and bacterial content (1 X 10⁵) values contributed moderately to the quality of this sample with HSQI values of 5.40, 4.70 and 4.92 respectively. The test results of available nitrogen (132 kg/ha) and chloride (12.6 mg/L) were found to be extremely low and they render poor quality to the soil. This reveals that the soil sample suffers from the deficiency of available nitrogen, available phosphorus and available potassium.
Analysis of available nitrogen
The fundamental importance of nitrogen as a primary nutrient element is augmented by the fact that many improved rice varieties cultivated around the world have been bred to show a marked response to the application of nitrogenous fertilizers. The optimum quantity of available nitrogen recommended by the soil experts and scientists for the effective cultivation of rice and sugarcane in Indian soil culture is >328 kg/ha (Table 1). Available nitrogen of the samples investigated in this study ranged from 132 – 264 kg/ ha. This range shows that all the soil samples taken in this analysis severely suffer from nitrogen deficiency. The availability of nitrogen to the plants is interdependent on other soil quality parameters such as organic matter, soil texture and water holding capacity, etc. All the soil samples in this study were determined to have organic matter in the range of 0.48 – 0.96%. These higher values suggest that the rate of decomposition of nitrogen is high. Soil texture of soil samples reported as silty clay loam and clay loam, which shows that the rate of nitrogen loss through a leaching process is low. The water holding capacity of all the samples chosen in this study ranged between 44.16 and 50.66 %. As far as water holding capacity is concerned, the rate of nitrogen loss is low. The availability of nutrients is directly affected by soil pH. If the soil’s pH is too high or too low, some nutrients become insoluble, limiting the availability of these nutrients to the plant root system. A soil pH range of about 6 - 7 increases the most readily available plant nutrients. Bacteria that decompose soil organic matter are hindered in strongly acidic soils. pH of all the soil samples ranged from 5.8 – 7.9 (slightly acidic to slightly alkaline), which supports the low nitrogen loss. The electrical conductance of the samples ranged from 0.129 – 2.18 mmho/cm, higher electrical conductivity values shows that the rate of nitrogen losses is high.
Analysis of pH
Soil pH is a measure of the acidity or alkalinity of soils. pH of all the soil samples ranged from 5.8 - 7.9, which reveals that the quality of these soils is acidic to basic. The range of pH recommended for the better yield of rice and sugarcane is 4.5 - 8 (Table 1). Soil sample 1 (Deekshasamudram) showed a high pH (7.9), which indicates that this soil is basic (Table 2) and soil sample 3 (Kalayanapuram) recorded low pH (5.8), which infers that this soil is acidic (Table 2). Other samples showed intermediate pH values. Soil pH is dependent on factors like soil texture. As far as the texture of the soil samples analyzed in this study is concerned, almost all soil samples are found to silty clay loam type. Soils of this type have a greater cation exchange capacity; higher organic matter and a greater water holding capacity and therefore could buffer against acidification.
Analysis of Water holding capacity
The available water holding capacity of soil is related to soil texture. Clay soils having the greatest water-holding capacity and sands the least. Additionally, organic matter also influences the water-holding capacity of soils because of the organic matter’s high affinity for water. The higher the % of organic material in soils the higher the soil’s water-holding capacity. All the soil samples in this study were determined to have organic matter in the range of 0.48 – 0.96%, which shows that water holding capacity of soil samples are good. Thus, loams and silt loams are considered some of the most productive soil textures because they hold large quantities of water that is available for plants to use. The water holding capacity of all the samples chosen in this study ranged between 44.16 and 50.66 %. As per the recommendations of the agricultural scientists, soils with water holding capacity in the range of 40 – 55 % (Table 1) is good for the plantation of rice and sugarcane from which is better yield is anticipated. Since, almost all these samples analyzed in this study have good water holding capacity, all these samples are considered to be good as far as this parameter is concerned. Sample 13 (Tiruvalampozhil), sample 9 (Marur) and sample 8 (Maharajapuram) recorded as high (50.66 %) (Table 4), moderate (48.32%) (Table 3) and low (44.16%) (Table 3) water holding capacity values respectively. Therefore, as far as this parameter is concerned, all samples are rated good.
Table 2: Soil of Deekshasamudram (Sample 1), Kaduveli (Sample 2), Kalayanapuram (Sample 3), Kandiyur (Sample 4), Karuppur (Sample 5).
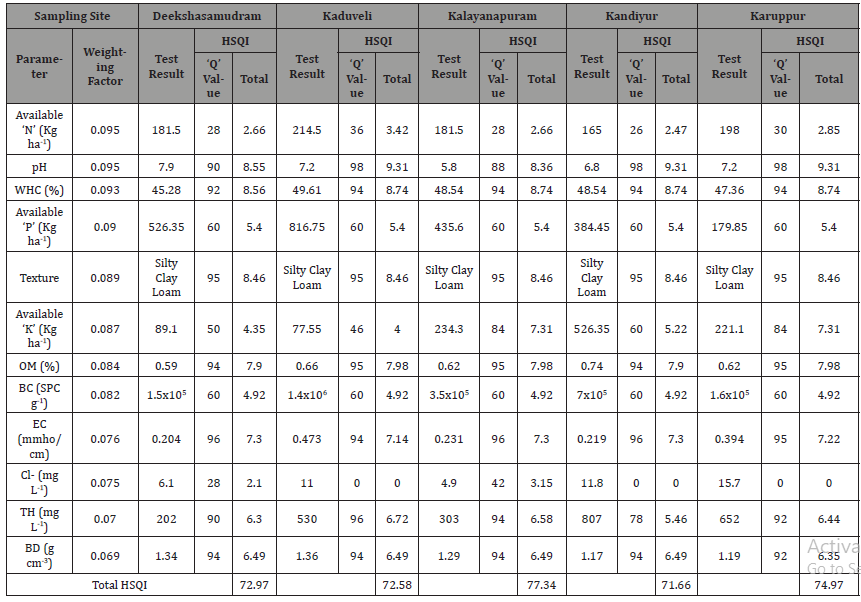
Table 3: Soil of Keelathirupanthuruthi (Sample 6), Konerirajapuram (Sample 7), Maharajapuram (Sample 8), Marur (Sample 9), Nadukkavery (Sample 10).
Analysis of available phosphorus
The recommended value for the effective cultivation of rice and sugarcane is >30 kg/ha (Table 1). Available phosphorus of the samples determined in this study ranged from 117.15 – 816.75 kg/ ha. Soil pH has an important role in phosphorus availability in soils. Availability of phosphorus is maximum at pH range 6 – 7. pH of all the tested soil samples ranged from 5.8 – 7.9, which shows that the amount of available phosphorus present in soil is good. Generally, higher soil organic matter levels are related to greater phosphorus availability. All the soil samples in this study were determined to have organic matter in the range of 0.48 – 0.96%. As far as organic matter is concerned, available phosphorus is good. The percentage of phosphorus in the crop from fertilizer has been reported highest when moisture availability was low. Fixation increases as soil clay content increases. High electrical conductivity of the soil shows that high availability of phosphorus in soil. Mineralization of organic matter provides a significant portion of phosphorus for crops.
Analysis of available potassium
The presence of potassium (K) in most irrigation water, the response of rice to potassium is often not as marked as the responses to nitrogen and/or phosphorus, except in unusual situations (e.g. when certain toxicities are offset by potassium). Nevertheless, potassium should not be overlooked as an important nutrient element, since each crop requires approximately 15kg of potassium for every - ton of yield. The optimum value of available potassium for the better cultivation of rice and sugarcane is >280 kg/ha (Table 1). The samples chosen in this study were found to be in the range of 77.55 – 526.35 kg/ha. The sample 4 (Kandiyur), sample 3 (Kalayanapuram) and sample 2 (Kaduveli) recorded high (526.35 kg/ha) (Table 2), moderate (234.3 kg/ha) (Table 2) and low (77.55 kg/ha) (Table 2) values of available potassium respectively. Available potassium in soil can be increased by the addition of gypsum with potassium also helps to move potassium down in very fine textured soils. Soil potassium levels should be built to high levels before shifting to minimum or conservation tillage. This improves potassium distribution within the plow layer.
Analysis of organic matter
Organic matter is the next basic component that is found in soils at levels of approximately 1% to 5%. Organic matter is derived from dead plants and animals and as such has a high capacity to hold on to and provide the essential elements and water for plant growth. The optimum range of organic matter is 0.6 - 0.8% (Table 1). All the soil samples in this study were determined to have organic matter in the range of 0.48 – 0.96%. The sample 13 (Tiruvalampozhil), sample 2 (Kaduveli) and sample 10 (Nadukkavery) registered high (0.96%) (Table 4), medium (0.66%) (Table 2) and low (0.48 %) (Table 3) values of organic matter respectively. Soils have high in clay content and silt has higher in SOM content than sandy soils. This is recognized to restricted aeration in finer-textured soils, reducing the rate of organic matter oxidation, and the binding of humus to clay particles, further protecting it from decomposition. Additionally, plant growth is usually greater in fine-textured soils, resulting in a larger return of residues to the soil. Poorly drained soils typically accumulate higher levels of SOM than welldrained soils due to poor aeration causing a decline in soil oxygen concentrations.
Analysis of bacterial content
Microorganisms are the final basic element of soils, and they are found in the soil in very high numbers but make up much less than 1% of the soil volume. One bacterium is capable of producing 16 million more in just 24 hours. Most soil bacteria live close to plant roots and are often referred to as rhizobacteria. Active bacteria are critical in the decomposition of organic matter and in humus formation, and their presence is responsible for the sweet earthy aroma associated with a good healthy soil [8]. They require plenty of air and a pH between 6.0 and 7.5 but are more tolerant of dry conditions than most other bacteria and fungi. In the samples analyzed in the investigation, the bacterial content ranged from 8 x 10⁴ – 4.9 x 10⁶ SPC/g. The optimum range of bacterial content recommended for any crop is 107 – 108 numbers per gram (Table 1). The sample 9 (Marur), sample 4 (Kandiyur) and sample 10 (Nadukkavery) have high (4.9 x 10⁶) (Table 3), moderate (7 x 10⁵) (Table 2) and low (8 x10⁴) (Table 3) bacterial content values respectively.
Analysis of electrical conductance
Electrical Conductivity (EC) is a quick, simple and inexpensive method that farmers and home gardeners can use to check the health of their soils. The EC level of the soil water is a good indication of the amount of nutrients available for crops to absorb. The factors contribute to soil EC variability, which includes the connectivity of the soil water through soil density, soil structure, water potential, precipitation, timing of measurement, soil aggregation, electrolytes in soil water (e.g. Salinity, exchangeable ions, soil, water content, soil temperature). Soil EC is also related to specific soil properties that affect crop yield, such as topsoil depth, pH, salt concentrations and water-holding capacity [9-13]. The electrical conductance of the samples ranged from 0.129 – 2.18 mmho/cm. The optimum range of electrical conductance recommended by soil chemists for rice and sugarcane is < 1 mmho/cm (Table 1). The sample 15 (Varagur) registered high electrical conductance value (2.18 mmho/cm) (Table 4). Sample 12 (Sathanur) showed medium value of electrical conductance (0.252 mmho/cm) (Table 4) and sample 9 (Marur) had low value of electrical conductance (0.129 mmho/ cm) (Table 3).
Analysis of chloride content
Chloride is a critical component in the development of plants. Chloride content of the samples was determined to be in the range of 1.2 – 19.8 mg/L. The standard range of chloride content is <4 mg/L (Table 1). The sample 15 (Varagur) had high values of chloride (19.8 mg/L) (Table 4). Sample 7 (Konerirajapuram) showed medium value (10.7 mg/L) (Table 3) and sample 11 (Punavasal) registered value of low chloride (1.2 mg/L) (Table 4).
Table 4: Soil of Punavasal (Sample 11), Sathanur (Sample 12), Tiruvalampozhil (Sample 13), Valappakudi (Sample 14), Varagur (Sample 15).
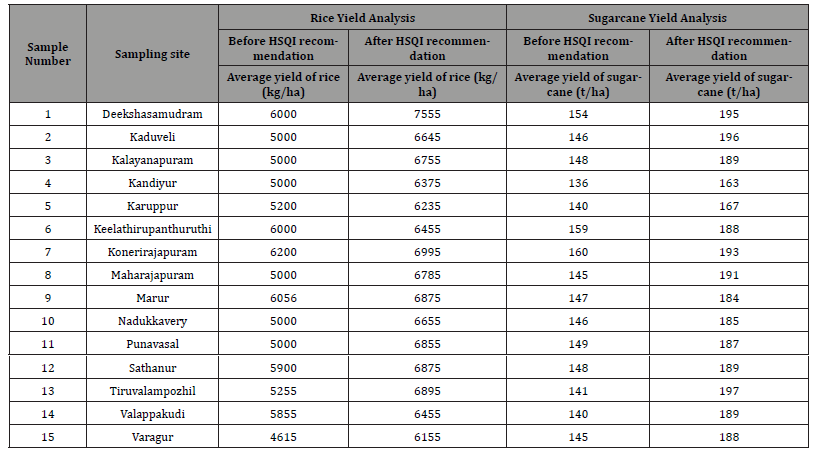
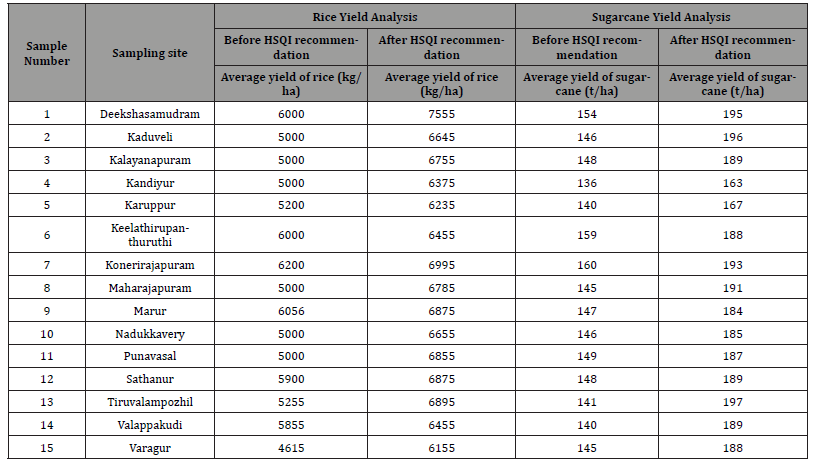
Table 5: Analysis of Average Yield of Rice and Sugarcane of Soil Samples obtained before and after HSQI Recommendations.
Analysis of total hardness
The total hardness of tested samples ranged from 70 – 1681 mg/L. The recommended optimum range of total hardness is (< 1.5 mg/L). The sample 10 (Nadukkavery) had high total hardness (1681 mg/L) (Table 3). Sample 2 (Kaduveli) showed medium (530 mg/L) (Table 2) and sample 13 (Tiruvalampozhil) contained low value of total hardness (70 mg/L) (Table 4). Almost all the samples were found to have extreme hardness which will not give good yield for the cultivation of rice and sugarcane.
Analysis of bulk density
Bulk density is an indicator of soil compaction. It reflects the soil’s ability to function in structural support, water and solute movement, and soil aeration. High bulk density is an indicator of low soil porosity and soil compactness. It may cause restrictions to root growth, and poor movement of air and water through the soil. The bulk density of the samples was found to have the range from 1.17 – 1.37 mg/cm3. The optimum range of bulk density values for the efficient cultivation of sugarcane and rice is 1.23 – 1.50 mg/ cm3 (Table 1). The sample 15 (Varagur) showed high bulk density value (1.37 mg/cm3) (Table 4). Sample 6 (Keelathirupanthuruthi) registered medium value (1.25 mg/cm3) (Table 3) and sample 4 (Kandiyur) low (1.17 mg/cm3) (Table 2).
Analysis of average yield of rice and sugarcane of soil samples obtained before and after HSQI recommendations
A study in depth was conducted to ascertain the validity of HSQI for each region with reference to the average yield of rice (kg/ ha) and sugarcane (t/ha). In this study, the average yield of rice and sugarcane of each region was determined (from the farmers) during December 2015. After harvesting was over, suggestions and recommendations were made to the farmers concerned as per HSQI in order to improve the yield of rice and sugarcane. During March 2016, the average yield of rice and sugarcane was determined again for each region (Table 5). It was very interesting to note that there is remarkable improvement in the yield of both rice and sugarcane of each region. From this, it is noted that the HSQI works well and could be recommended for the global level [14-17].
Conclusion
The farmers in and around Thanjavur area (popularly known as the rice bowl of Tamilnadu, India) mainly depend on the cultivation of rice and sugarcane for their income. Because, these cash plants are being mainly cultivated in their areas. To assess the quality of soils taken from fifteen places in and around Thanjavur area to find out the suitability of the soils for the better cultivation of rice and sugarcane, the soil quality index was used. Highly useful and newly formulated HSQI was exploited in this study to rate the soil samples as excellent, good or bad. The total HSQI values of all the samples investigated in this study ranged from 66.26 – 80.27 which suggests that these soil samples are medium to good quality. This index was found to be time saving and economical way of assessing the fertile nature of the soil for the effective cultivation of rice and sugarcane. The yield analysis of rice and sugarcane carried out before and after HSQI investigation reveals information that the yield obtained after HSQI recommendations is remarkably higher than ever before. Therefore, this newly designed HSQI table could be used for the better assessment of soil quality in an easier way with reference to our climatic conditions, soil properties, industrial, religious and other developmental activities. This work will be highly useful for other researchers to formulate a new soil quality index for other crops in order to increase their yield in a cost-effective way. It is hoped that this study is not only useful for the researchers but also useful to the farmers to increase their productivity.
Acknowledgement
None.
Conflict of Interest
All authors declare that there is no conflict of interest.
References
- Brejda JJ, Karlen DL, Smith JL, Allan DL (2000) Identification of regional soil quality factors and indicators II. Northern Mississippi Loess Hills and Palouse Prairie. Soil Science Society of America Journal 64: 2125-2135.
- Ayoubi S, Nazanin Emami, Nasrin Ghaffari, Naser Honarjoo, Kanwar L Sahrawat (2014) Pasture degradation effects on soil quality indicators at different hillslope positions in a semiarid region of western Iran. Environmental Earth Sciences 71: 375-381.
- Bünemann EK, Bongiorno G, Bai Z, et al. (2018) Soil quality - A critical review. Soil Biology and Biochemistry 120: 105-125.
- Bai Z, Caspari T, Gonzalez MR, et al. (2018) Effects of agricultural management practices on soil quality: A review of long-term experiments for Europe and China. Agriculture, Ecosystems & Environment 265: 1-7.
- Biswas S, GCHazra, TJPurakayastha, N Saha, Tarik Mitran, et al. (2017) Establishment of critical limits of indicators and indices of soil quality in rice-rice cropping systems under different soil orders. Geoderma 292: 34-48.
- Gugan S, Ramesh Kumar C, Rajendran A, Princy Merlin J, Jeyakar chellaraj J (2001) Formulation of a new Heber Soil Quality Index for rice and sugarcane cultivation. Pollution Research 19(3): 485-489.
- Muthuvel P, Udayasoorian C, Natesan R, Ramaswami PR (1992) Introduction to soil analysis. pp. 10-60.
- Swer H, Dkhar MS, Kayang H (2011) Fungal population and diversity in originally amended agricultural soils of Meghalaya, India. Journal of organic systems 6(2): 3-12.
- Yadav RL, Kamta Prasad K, Gangwar KS (1998) Prospects of Indian Agriculture with special reference to nutrient management under irrigated systems. In: Long-Term Fertility management through Integrated Plant Nutrient Supply (Eds. A Swarup, D Damodar Reddy, RN Prasad), Indian Institute of Soil Science, Bhopal, India, pp. 1-335.
- Thiyagarajan K, Kalaiyarasi R (2011) Status paper on rice in Tamil Nadu. Centre for Plant Breeding and Genetics, Tamil Nadu Agricultural University, Coimbatore, Tamil Nadu, pp. 1-20.
- Majumdar DK (2000) Irrigation Water Management by, Prentice Hall of India, pp. 1-18.
- Mandal KG, Kundu DK, Ravender Singh, Ashwani Kumar, Rajalaxmi Rout, et al. (2013) Cropping practices, soil properties, pedotransfer functions and organic carbon storage at Kuanria canal command area in India, Springer Plus 2: 6311-14.
- Hoorman J, Islam R (2010) Understanding Soil Microbes and Nutrient Recycling. Fact Sheet SAG -16 -10. Ohio State University Extension, pp. 1-5.
- Dahnke WC, Whitney DA (1988) Measurement of soil Salinity, In Recommended soil chemical test procedures for the North Central Region. NCR Publ. 221. Revised, pp. 32-34.
- Smith JL, Doran JW. (1996) Measurement and use of pH and electrical conductivity for soil quality analysis. Soil Science Society of America Journal 49: 169-185.
- Horneck DA, Sullivan DM (2011) Owen JS, Hart JM, Soil Test Interpretation Guide. Oregon state university. Extension service, Pp. 1-12.
- Wurts WA, Durborow RM (1992) Interactions of pH, carbon dioxide, alkalinity and hardness in fishponds. Southern Regional Aquaculture Center, pp. 464.
-
Muthukumaran Shanmuganatha n, Annamalai Rajendran. Critical Analysis of Soil for Better Rice and Sugarcane Farming in Thanjavur Region of India. World J Agri & Soil Sci. 5(2): 2020. WJASS.MS.ID.000609.
-
Micronutrients, Bulk density, Heber soil quality index, Chloride, Electrical conductivity, Total organic matter, Bacterial content
-

This work is licensed under a Creative Commons Attribution-NonCommercial 4.0 International License.


