 Research Article
Creating a Multivariate-Multifunctional Database for Weed Control to Support Organic Mixed Vegetable Production
Yaqeen Salatneh Ashqer1*, Chyi Lyi (Kathleen) Liang2 and Marwan Bikdash1
1Department of Computational Science and Engineering, North Carolina A&T State University, USA
2Center for Environmental Farming System, North Carolina A&T State University 1601 E Market St, Greensboro, NC 27401
Yaqeen Salatneh Ashqer, Department of Computational Science and Engineering, North Carolina A&T State University, USA.
Received Date: March 26, 2020; Published Date: April 17, 2020
Abstract
The organic sector has become one of the fastest-growing agricultural movements in the United States. Weed management is one of the most significant challenges for organic vegetable growers since weed interference reduces crop yield and quality. This paper aims to share an innovative method to design, develop, and implement a multivariate- multifunctional database to help small-scale organic mixed vegetable farms to prevent the spread of weeds from the seeding stage of production. We monitored different types of vegetables in spring 2019 that were produced on a 0.5- acre plot in a small urban farm in Guilford County, North Carolina. We documented the environmental and climatic factors for all vegetables. The database we collected incorporates numbers of records, description of conditions, and photo images of vegetable and weed growth. The expected contribution of this study is to determine or calculate.
• The correlation between vegetable growth, weed growth, and circumstantial factors while taking into consideration human decisions and climate variations.
• The average and optimized vegetable plant growth rates corresponding to natural and human factors.
• The survival ratio between vegetables and weeds under a well-monitored environment.
Keywords: Critical period; Monitoring; Organic farming; Gather images
Introduction
Agriculture is the foundation of all culture. It anthropomorphizes a decisive part in the expansion of human civilization. Recently there is an orientation towards organic agriculture, especially in the United States [1]. Many states have made remarkable progress in promoting and supporting organic farming because it provides significant benefits for farmers as well as consumers and the environment. Organic agriculture will reduce human health hazards resulting from inhalation and dermal absorption of herbicides, and the environmental benefits behind organic-farming are to conserve biodiversity, improve soil quality, and to reduce greenhouse gas emissions [2].
Farmers face significant challenges in farming as weeds are a threat to farmers and their crops; they reduce crop yield and the quality of production as well. Weed interference has been seen as one of the most significant constraints to crop production around the world. Several measures can be used to ensure the survival and productivity of these crops [3]. There is a sensitive and critical period during the crop life cycle, during which weeds must be removed to prevent yield losses. This critical period is defined in different ways by various researchers. Amador-Ramı́rez [4] monitored chili pepper plants in a nonorganic farm in Calera Agricultural Experiment Station, Mexico, to determined the critical period of control weeds. The Amador‐Ramírez experiment was applied in the spring season. The dominant weed species observed in the study were Simsia amplexicaulis, Amaranthus palmeri, Helianthus petiolaris, Bidens odorata, Galinsoga parviflora, Eragrostis curvula, and Chenopodium album. The experiment suggested removing weeds within 0.9- 2.1 weeks after transplanting to prevent yield losses. Nadeem et al. [5] determined that the critical period for weed control of black seed is within forty days after initial weed germination. The A field experiment was conducted at the Agronomic Research Area, in Pakistan on a nonorganic farm during the winter season in 2006 and 2007. The types of weeds observed in the experiment were Chenopodium album and Convolvulus arvensis.
Nurse et al. [6] studied the optimal planting date and critical weed-free period for grain amaranth and quinoa. They concluded that the critical weed-free period is twenty-four and sixteen days after emergence for grain amaranth and quinoa, respectively.
The two experiments were conducted at the Greenhouse and Processing Crops Research Center, in Ontario, in 2013 and were repeated in 2014 every two weeks from early May to late July. The experiment was organically managed and kept weed-free using inter-row cultivation and hand-weeding. The weed types observed during the trial were Abutilon theophrasti, Amaranthus retroflexus, Amaranthus hybridus, Chenopodium album, Digitaria sanguinalis, and Panicum dichotomiflorum. Mohammadi et al. (Mohammadi et al., 2005) studied the critical period for chickpea and found that weeds should be removed within 17 to 60 days after chickpea’s emergence, to prevent more than 10% seed yield loss. The experiment was conducted in two nonorganic sites: the first one at Tabriz, Iran, in May 2002, and the second site at Kermanshah, Iran, in May 2003. The weed types observed during the experiment were Convolvulus arvensis, Chenopodium album, Polygonum aviculare, and Acroptilon repens Calflora. Tursun et al. [7] conducted studies on the experimental farm in Turkey, in 2002 and 2003 to determine the critical period for weed control in leeks. The results of this study proposed that leeks should be kept weed-free between 7 and 85 days after transplanting to avoid yield losses. The most prominent weeds in the experimental plot were Brassica kaber (DC.) Wheeler, Convolvulus arvensis, Cyperus rotundus, Portulaca oleracea, Chenopodium album, Datura stramonium, Sorghum halepense, Cirsium arvense, and Amaranthus retroflexus. They used hand hoeing to remove weeds.
The determination of the critical period to remove weeds plays a crucial role in the weed-crop competition, but the climate and environmental changes also affect crop growth since agriculture enormously relies on climate conditions and is, therefore, exposed to change and variability [8].
The evolution of the environmental conditions such as the temperatures, dense rain patterns, and the increase of extreme weather events, affect agricultural productivity [9]. Also, an accurate definition of both the environmental conditions and of the plant response is a precondition for the conduct of repeatable and explanatory experiments [10].
Farmers, in general, aim for higher crop yields in all environmental conditions by supporting crops to cope with climate change and environmental conditions [10]. Manske [11] mentioned that the most significant environmental factors affecting plant growth are light, temperature, and water. The rate of plant growth depends on the temperature surrounding the plant; at the same time, the response to temperature is different from one plant to another [13]. Most plants need a similar balance of nutrients to maintain optimal growth [14].
Moustakas & Evans [15] studied the survival rates of ten tree species in a dataset from the Environmental Change Network, Wytham Woods, in Oxfordshire, UK. Designed to observe growth rates, they included growth rates, size, and light availability as variables in the model that predicted tree survival rates. They found that large trees have a higher survival rate than small trees at the early stage of production and that it better to use the size variable than using light variable or growth rate variable when predicting tree survival rate.
Since weeds limit crop yield through immediate competition for light, water, and nutrients [16], many other environmental and crop management practices can affect crop-weed competition. The use of herbicides is a standard method for controlling the growth of weeds. However, in organic farms, the use of herbicides is not allowed [17].
Organic farming relies heavily on mechanical cultivation and hand weeding. Some researchers favor mechanical methods to control weeds more than hand weeding because it requires less time and costs less than hand weeding [18]. However, using mechanical methods to remove weeds within the crop rows is difficult. The equipment may damage the plants if weeds are close to the plant [19].
Researchers that support hand weeding have a different point of view; they consider it as a practical and efficient way of removing weeds within rows, but at the same time, they agree that it is incredibly tedious and time-consuming [20]. For example, with carrots and onions, hand weeding is still needed after mechanical weeding; approximately 200 person hours/ha are usually required [12]. This causes farm workers to labor in stooped and uncomfortable positions for long periods, which can lead to serious chronic health problems for workers, increasing the cost for labor care [21,22]. Hypothetically, farmers would like to achieve minimal to no-weeds on their farms. In practice,, this may not be achievable, but any reduction in weeds will make weed control operations less expensive [22].
Recently, researchers integrated digital image processing to aid in weed control by differentiating between weeds and crops. For instance, [23] proposed the use of Image Processing to segment crop and weed images, and Convolutional Neural Networks (CNN) for classification. The dataset they used for this analysis was from the GitHub portal for carrots plants [24], and they used weed size features in their weed identification. The algorithms developed are based on an excessive green color algorithm to remove unwanted species; then, they used image enhancement techniques to reduce noise from the images. A labeling algorithm and segmentation between crops and weeds is done by selecting an appropriate threshold value. The photos were taken in March and April in 2013 in the Indian agricultural field for sugar cane and corn crops.
Montalvo et al. [25] applied double automatic thresholding to distinguish weeds and crops in maize fields with high weed pressure. And the method gain effectiveness and accuracy for crop and weed separation. The images were taken in a 1.7 ha experimental field of maize on Madrid in April -May 2011, and April - May 2007.
Gerhards et al. [26] proposed a system for site‐specific weed control. The system includes on‐line weed detection using digital image analysis, computer‐based decision making, and Global Positioning System‐controlled patch spraying to a potential reduction in herbicide use. The herbicide use was reduced in winter grain by 6-81% for herbicides against broad-leaved weeds and 20–79% for grass weed herbicides. The database was collected in Dikopshof Research Station near Cologne, Germany, in 2004, and they choose four fields for this experiment consisting of maize 4.6 ha, winter wheat 5.3 ha, winter barley 8.5 ha, and sugar beets 5.8 ha.
The objective of the current study is to introduce an innovative method to monitor weed growth for early weed control and build a multivariate-multifunctional database to help small-scale organic mixed vegetable farms to prevent weeds from starting from the initial stage of production. Another objective is to use the image dataset that we collected for discrimination and classification purposes between crops and weeds using digital image processing.
Materials and Methods
Overview
Monitoring is a powerful tool to address problems in the early stages before they become dramatically visible. If a weed is identified early, one can manage it at a low cost [27]. So, through monitoring, we aim to control weeds in the early stages of production at small-scale organic mixed vegetable farms to develop a Multivariate-Multifunctional database. The database was collected in a small Urban Teaching Farm in Guilford County, North Carolina (lat. 36° 3’ 28.6596’’ N, long. 79° 48’ 2.8692’’ W) in spring 2019 starting from late January untinn early May. We monitored different types of vegetables (beet, carrot, kale, swiss chard, pepper, peas, and several kinds of tomato, lettuce, and onion), which were produced in a 0.5-acre plot. The digital images were taken using the Samsung Galaxy S8 Plus (Samsung SM-G955U) camera and the camera resolution is 12 Megapixel.
The Urban Teaching Farm is not a certified organic farm, but they practice organic farming. Farmers in general divided the work into two production stages: stage one starts seeds in the high tunnel. The farm-crew will sow seeds into seed trays inside the high tunnel for 6-8 weeks, then move them to the actual field, which is the second production stage. In our work, we monitored these two stages.
Table 1: Vegetables that need the two production stages.
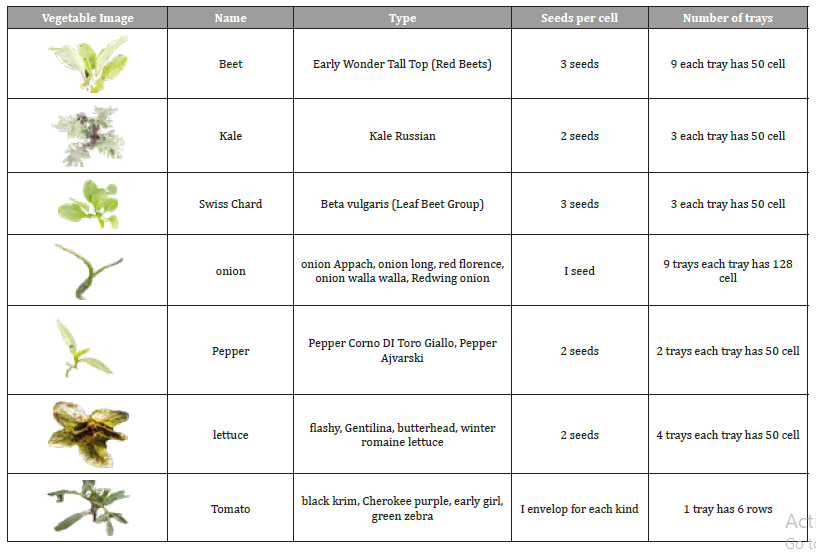
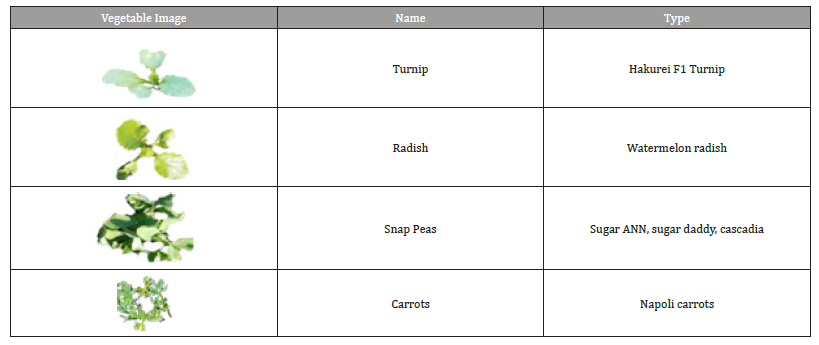
Table 1 shows the vegetables that need two stages of production, the types of these vegetables, the number of trays and seeds per cell. Table 2 shows the vegetables that were direct seeded in the ground; in other words, plants in Table 2 need only the second production stage.
Table 2: Vegetables that need only the second production stage.
Through monitoring and documenting, we found that the following parameters should be considered:
• The environmental and climate factors, and
• The growing condition.
• For the environmental and climate factors, we documented the following for all vegetables in both production stages:
a. The plot soil characteristics: Daddy Pete’s Sea n’ Farm soil was used in the first stage. The ingredients for the soil is Daddy Pete’s Composted Cow Manure, Sphagnum Peat Moss, Premium Aged Pine Bark Fines, Perlite, Sandy Loam, Oyster Shell, Oceanic Fish Meal, Crab Meal, Shrimp Meal, Earthworm Castings, Fossilized Bat Guano, Kelp Meal. For the second stage, the soil sample test result are presented in Supplemental material.
b. Air temperature and humidity using the weather channel application from the play store on the Samsung Galaxy S8 Plus [34].
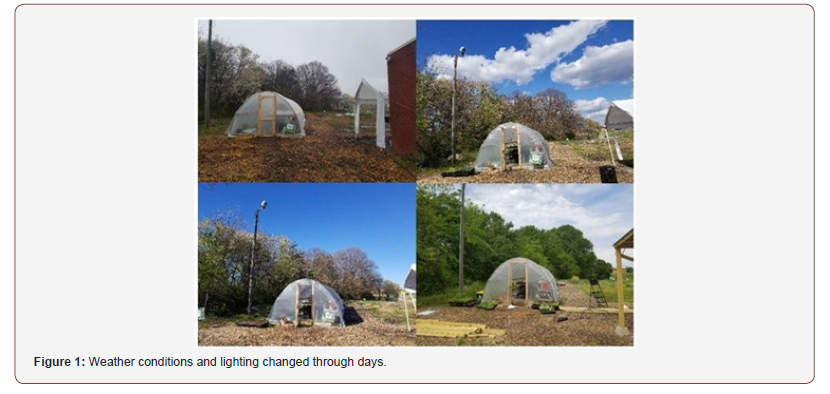
c. The weather conditions: the weather is sunny, cloudy, or rainy, etc. Figure 1 shows different weather conditions and lighting changes throughout the day time and on different days.
d. Soil temperature measured using soil thermometer inside and outside the high tunnel.
• For the growing condition, we documented the following parameters for each vegetable:
a. The total number of seeds in each cell. The farmer-crew sometimes put two seeds per each cell like beets, or they put one seed like the onion.
b. The type of horticultural vermiculite used.
c. Types of weeds appearing in different stages corresponding to vegetable growth.
d. The time and method of putting the transplants in the ground.
e. Plant height from the seedling stage to the semi-mature stage, we used a ruler to measure the height for each plant.
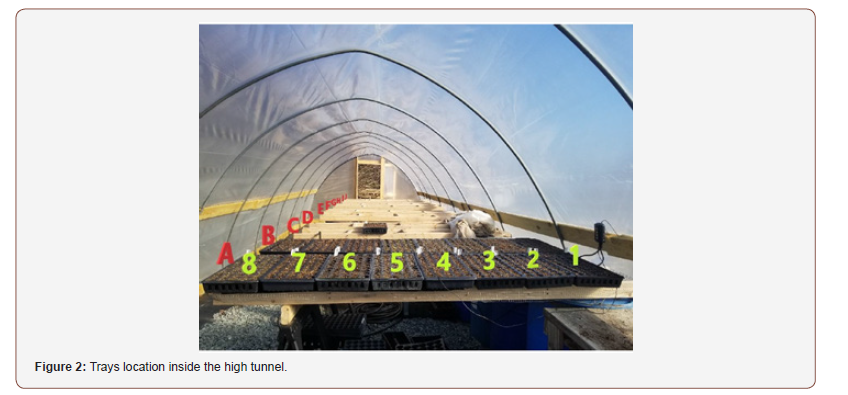
f. Tray location and arrangement in the transplant stage. In the high tunnel, there are ten raised beds. We gave each tray a label from A to J. Each raised bed has an eight tray capacity, and were labeled labeled that in numbers from one to eight. Each tray has a name depending on the location of that tray, for example (A1, A2, ...., D1, D2, J8). Figure 2 shows the trays’ position and the labeling for each one of them.
Swiss Chard Example
In this section, we will illustrate the way that we used to gather these parameters and the way that we used to take images for documentation. To illustrate that in depth, we will take the Swiss Chard as an example to clarify the two production stages.
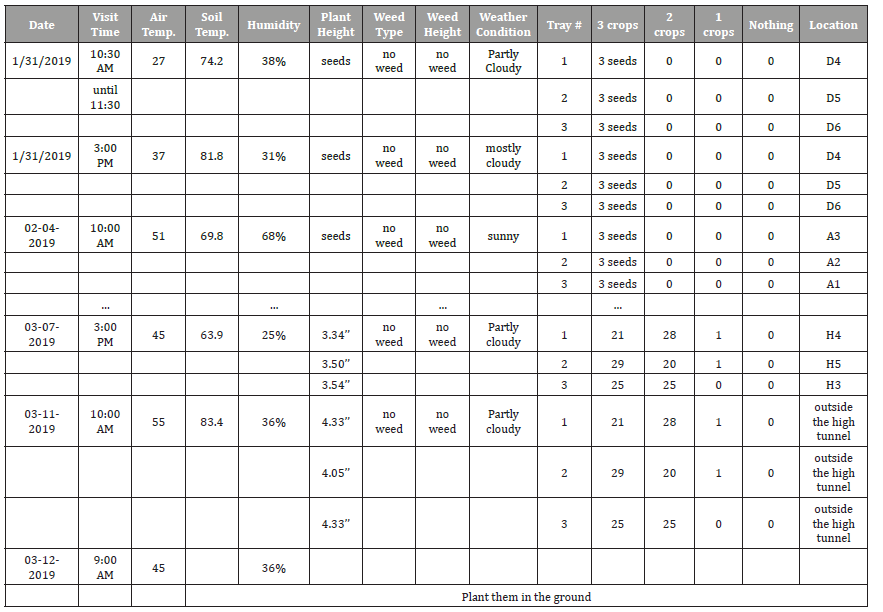
First production stage: Inside the high tunnel: We monitored the plants during the spring season since the plant’s growth is faster in that season compared to other seasons [28]. Based on that information, we visited the farm to record all of the required data, in a regularly scheduled time, two times a week (every Monday and Thursday). On Monday, one time a day at 10 am, and on Thursday, three times a day at 10 am 12 pm and 3 pm. The data collected on Thursdays were sufficient to build results on, but we took extra data on Monday to have better results. Table 3 represents the schedule in the first production stage that we followed to visit the farm for the Swiss Chard plant as an example. We monitored the plant from Jan. 31, 2019 until Mar. 12, 2019.
Table 3: First production stage sequence visit schedule (the value 0 represents there’s nothing germination yet).
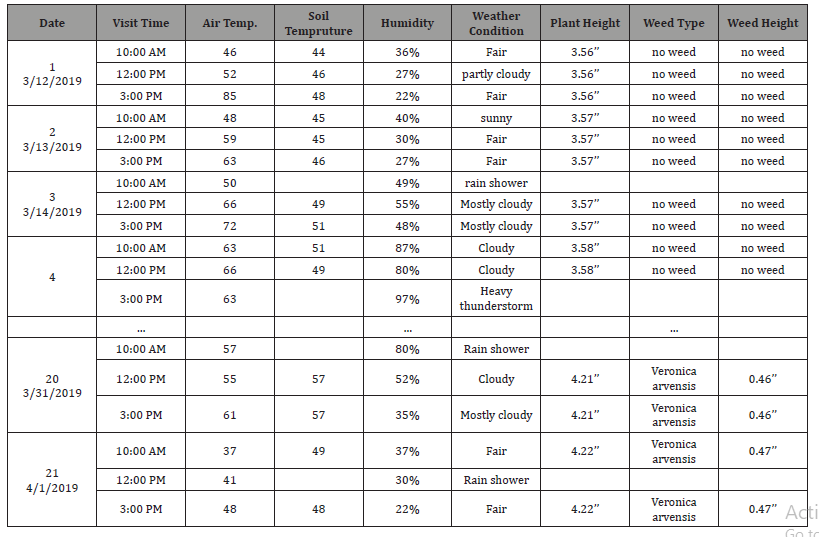
Second production Stage: In the field: The second production stage started when the farm-crew moved the plants from inside the high tunnel to the field. We started monitoring the plants in this production stage after the plant’s appearance until middle-stage growth as plants will be strong after the middle-stage growth and can win the competition with weeds for needs to live. At this production stage, we visited the farm every day, three times a day, at (10 am, 12 pm, and 3 pm). We skipped a few days when there was bad weather (snow or heavy rain), meaning we didn’t take pictures of the plants, but we recorded the weather information. Table 4 shows the schedule in the second production stage that we followed to visit the farm for the Swiss Chard plant as an example. We monitored the Swiss Chard plant from Mar. 12, 2019, unti1 Apr. 1, 2019.
Table 4: second production stage sequence visit schedule.
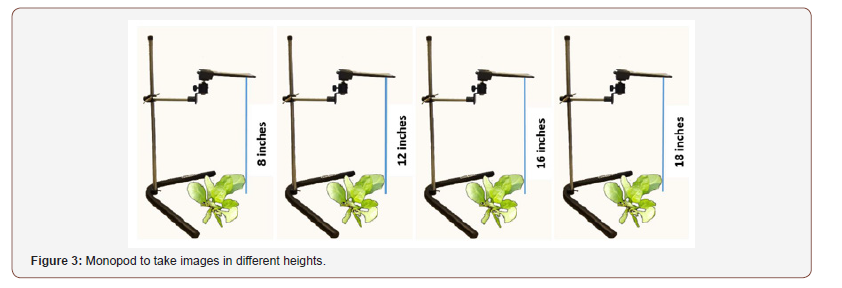
In this stage, we used a camera monopod to obtain a top view image. We took pictures for each plant at different heights (8 inches, 12 inches, 16 inches, and 18 inches), as shown in Figure 3. We used these pictures to isolate crops from weeds using image processing analysis [29].
Survival ratio calculation: To find the survival ratio between vegetables and weeds under a well-monitored environment we used the equation below [30].
𝑝𝑙a𝑛𝑡 survival 𝑟𝑎𝑡𝑒= (number of remaining plants/number of plants originally) ∗100 %
• First production stage (inside the high tunnel):
• Total number of the seeds of Swiss Chard plant originally (initially) = 450.
• Total number of Swiss Chard plants that remain before planting them on the ground = 373.
• Second production stage (in the field):
• Total number of Swiss Chard plants that remain before planting them in the field = 373.
• 𝑆𝑤𝑖𝑠𝑠 𝑐ℎ𝑎𝑟𝑑 𝑠𝑢𝑟𝑣𝑖𝑣𝑎𝑙 𝑟𝑎𝑡𝑒= (373/450) ∗100 = 82.89%
• Total number of Swiss Chard plants that remain after planting them in the field = 123.
• 𝑠𝑤𝑖𝑠𝑠 𝑐ℎ𝑎𝑟𝑑 𝑠𝑢𝑟𝑣𝑖𝑣𝑎𝑙 𝑟𝑎𝑡𝑒= (123/373) ∗100 = 32.97% 278
• The survival rate for Swiss chard for both production stages:
• Total number of the seeds of Swiss Chard plant originally (initially) = 450.
Total number of Swiss Chard plants that remain after planting them on the ground= 123.
𝑇ℎ𝑒 𝑡𝑤𝑜 𝑠𝑡𝑎𝑔𝑒𝑠 𝑡𝑜𝑔𝑒𝑡ℎ𝑒𝑟= (123/450) ∗100 = 27.33%
Result
The database we collected incorporates numbers of records, description of conditions, and photo images of vegetable and weed growth.
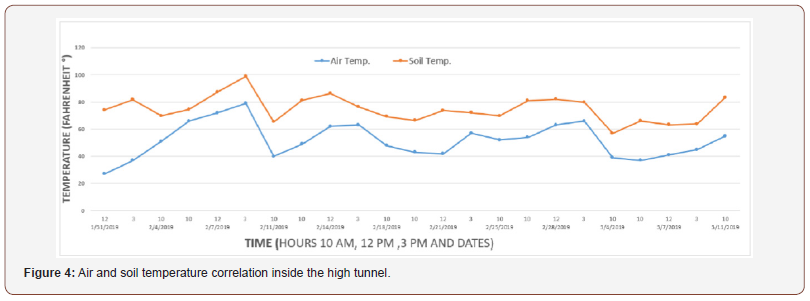
In the first production stage, we found a correlation between the air temperature and the soil temperature inside the high tunnel. Figure 4 represents the correlation between the air temperature and the soil temperature inside the high tunnel for Swiss Chard. From the same figure, we can notice that soil temperatures are always higher than air temperatures.
In the second stage, when the plants are in the field, the air temperatures in most cases are higher than soil temperatures. Figure 5 shows the correlation between the air temperature and the soilm temperature in the actual field for Swiss Chard.
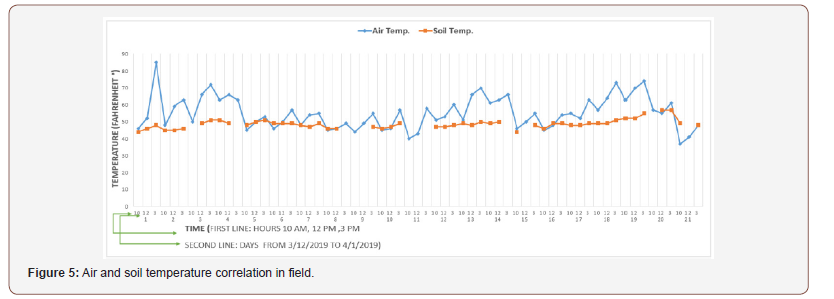
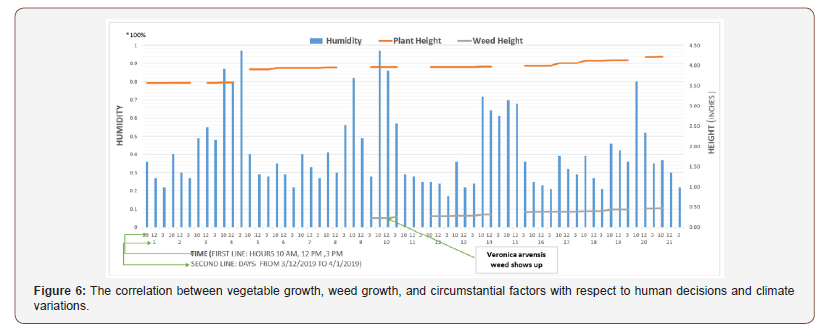
Figure 6 shows the correlation between vegetable growth, weed growth, and circumstantial factors concerning human decisions and climate variations. We can also see the Veronica arvensis weed shows up on day nine around Swiss chard.
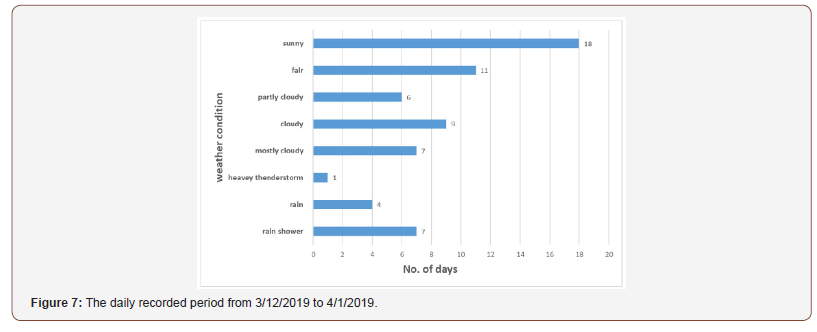
Figure 7 shows the daily recorded period from Mar. 12, 2019 to Apr. 1, 2019, and we can see the weather condition most likely during this period is sunny and fair weather.
To find the percent height change between Swiss Chard and Veronica arvensis, we used the percent change equation (𝑃𝑒𝑟𝑐𝑒𝑛𝑡 ℎ𝑒𝑖𝑔ℎ𝑡 𝑐ℎ𝑎𝑛𝑔𝑒= (𝑙𝑎𝑡𝑒𝑟 – 𝑒𝑎𝑟𝑙𝑖𝑒𝑟/𝑒𝑎𝑟𝑙𝑖𝑒𝑟) ∗100% [31]).
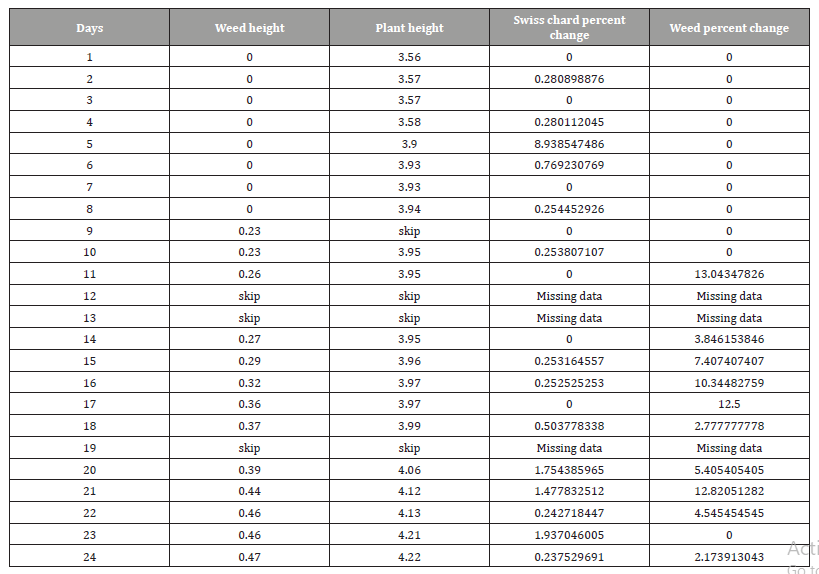
Table 5 shows the Swiss chard and weed height for 24 days and the percent change for both of them. Figure 8 represents the percent height change for Swiss Chard and weed, and we can see how the weeds height changes for grass higher than Swiss chard.
A brief Swiss Chard life cycle is shown in photos in Figures 9&10 shows the four different heights we took photos at to build the image database of vegetables for digital image purposes [31-34].
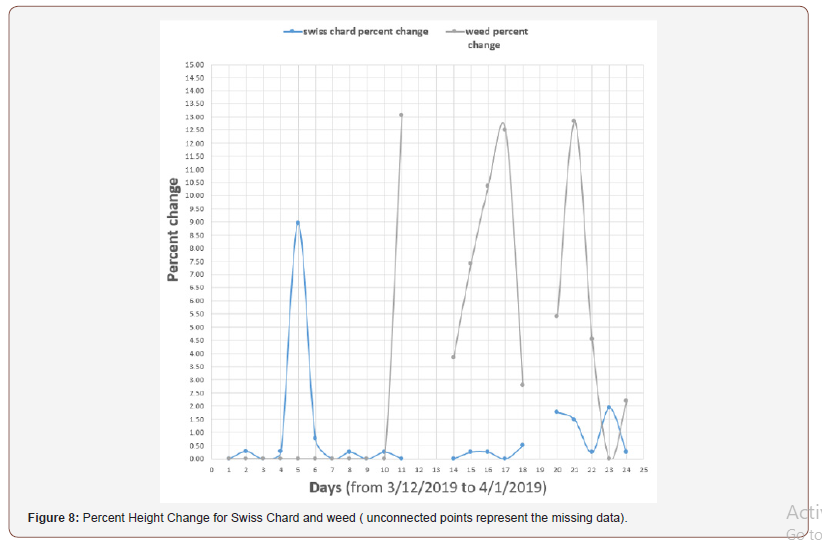
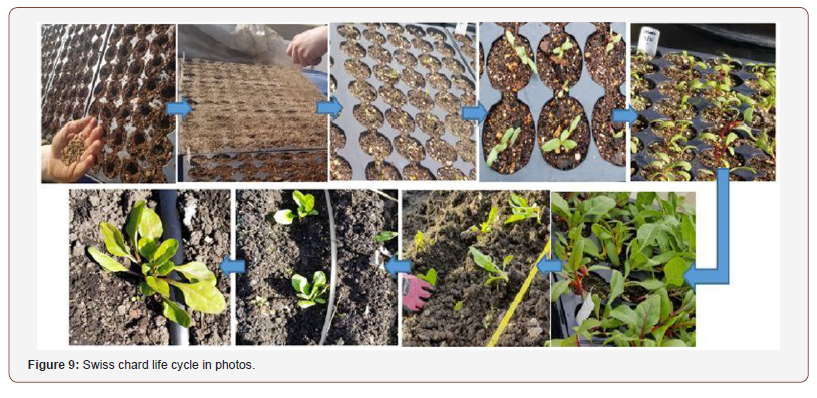
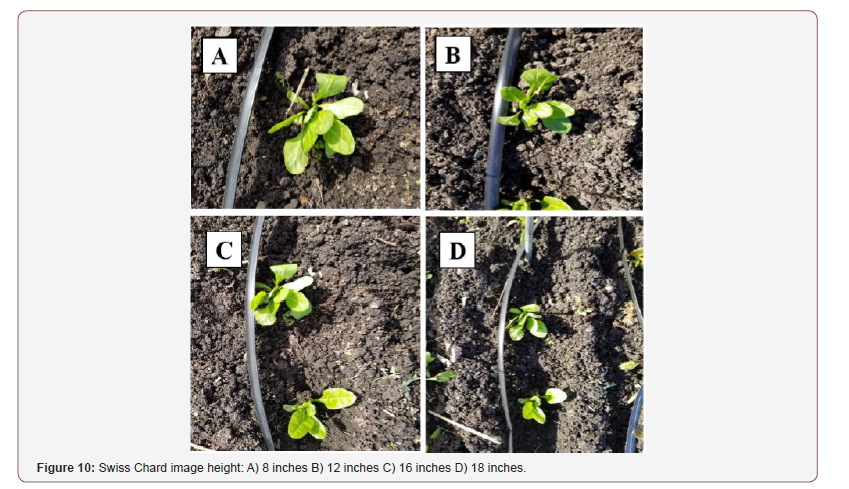
Table 5: Daily percent height change for Swiss chard and weed.
Conclusion and Future Work
In this research, we provided a detailed method to monitor weed growth during crop growth. We collected images and information to build an innovative approach for the early detection of weeds in organic crops. Our primary goal is to reduce labor costs, expenses, and time-consumed to dispose of weeds. One of the purposes of this research is to help farmers and researchers develop a new technology to prevent and treat weeds at early stages while maintaining crop/soil health. For future work, we will use the collected images to do isolation, classification, and identification between crops and weeds by analyzing these images using digital image processing analysis methods.
Supplemental Material
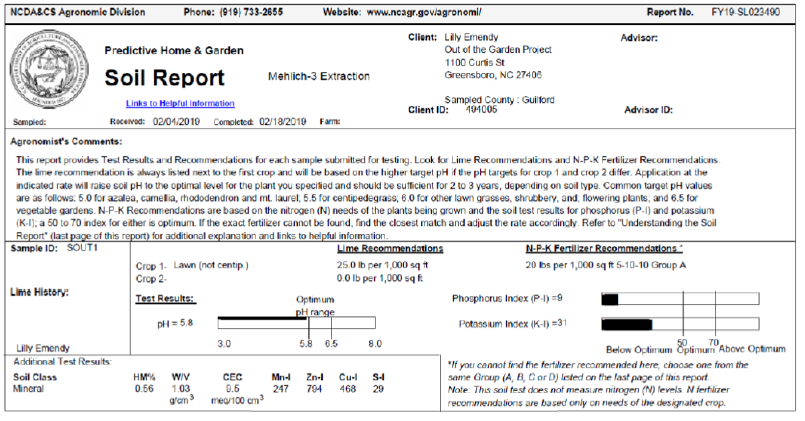
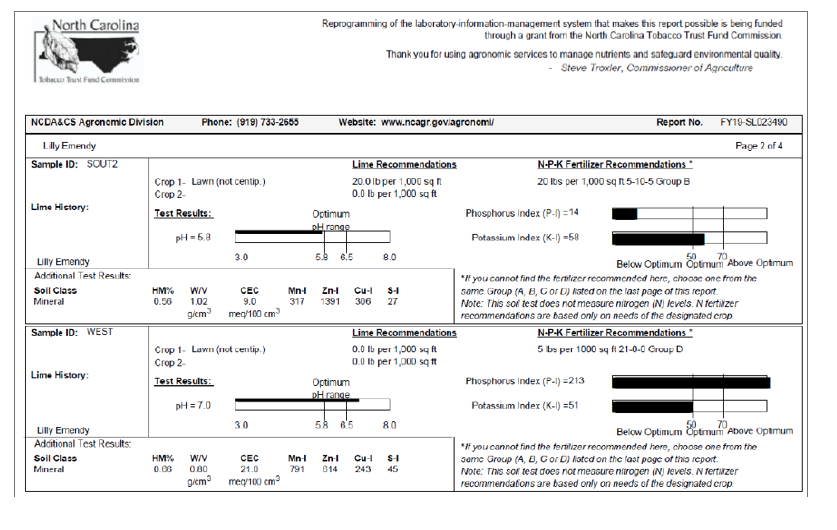
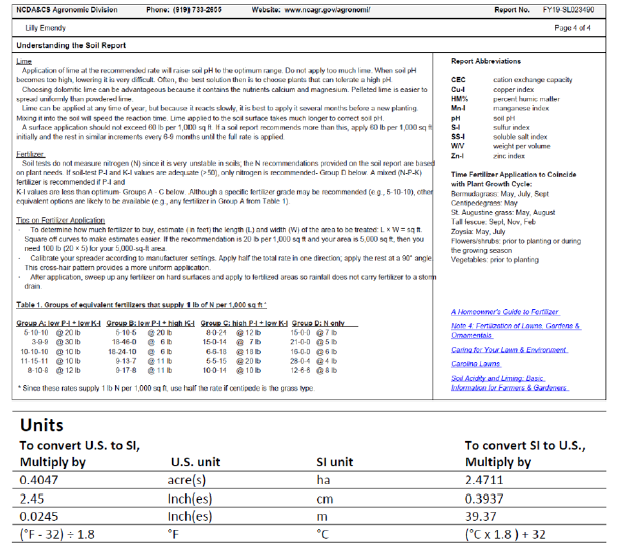
Acknowledgement
We thank the funding provided by USDA NIFA and Kellogg foundation, and we would thank the Small Urban Teaching Farm in Greensboro, North Carolina.
Conflict of Interest
No conflict of interest.
References
- Kim, YJ, Kim HS, Kim KY, Chon JW, Kim DH, et al. (2016) High Occurrence Rate and Contamination Level of Bacillus Cereus In Organic Vegetables on Sale In Retail Markets. Foodborne Pathogens and Disease 13: 656-660.
- Dumanski J, Peiretti R, Benites J, Mcgarry D, Pieri C (2006) The Paradigm of Conservation Agriculture Proc World Assoc Soil Water Conserv P 1: 58-64.
- Karkanis A, Bilalis D, Efthimiadou A, Katsenios N (2012) The Critical Period for Weed Competition In Parsley (Petroselinum Crispum (Mill) Nyman Ex Aw Hill). In Mediterranean Areas Crop Protection 42: 268-272.
- Amador Ramírez M (2002) Critical Period Of Weed Control In Transplanted. Chilli Pepper Weed Research 42: 203-209.
- Nadeem M, Tanveer A, Naqqash T, Jhala A, Mubeen K (2013) Determining Critical Weed Competition Periods For Black Seed J Anim Plant Sci 23: 216-221.
- Nurse RE, Obeid K, Page ER (2016) Optimal Planting Date, Row Width, And Critical Weed-Free Period For Grain Amaranth And Quinoa Grown In Ontario. Canada Canadian Journal of Plant Science 96: 360-366.
- Tursun N, Bükün B, Karacan SC, Ngouajio M, Mennan H (2007) Critical Period for Weed Control In Leek (Allium Porrum L) Hortscience 42: 106-109.
- Howden SM, Soussana JF, Tubiello FN, Chhetri N, Dunlop M, et al. (2007) Adapting Agriculture to Climate Change Proceedings Of The National Academy of Sciences 104: 19691-19696.
- Scialabba NEH, Müller Lindenlauf M (2010) Organic Agriculture and Climate Change Renewable Agriculture and Food Systems 25: 158-169.
- Van Overbeek L, Van Elsas JD (2008) Effects Of Plant Genotype And Growth Stage on the Structure Of Bacterial Communities Associated With Potato (Solanum Tuberosum L) Fems Microbiology Ecology 64: 283-296.
- Feddes RA (1971) Water, Heat and Crop Growth Veenman.
- Finch S, Samuel A, Lane GP (2014) Lockhart and Wiseman’s Crop Husbandry Including Grassland, Elsevier.
- Hatfield JL, Prueger JH (2015) Temperature Extremes: Effect On Plant Growth And Development Weather And Climate Extremes 10: 4-10.
- Chapin FS, Bloom AJ, Field CB, Waring RH (1987) Plant Responses to Multiple Environmental Factors. Bioscience 37: 49-57.
- Moustakas A, Evans MR (2015) Effects Of Growth Rate, Size, and Light Availability on Tree Survival Across Life Stages: A Demographic Analysis Accounting for Missing Values and Small Sample Sizes Bmc Ecology 15: 6.
- Liu J, Mahoney K, Sikkema P, Swanton C (2009) The Importance Of Light Quality In Crop–Weed Competition Weed Research, 49, 217-224
- Oliveira M, Usall J, Vinas I, Anguera M, Gatius F, Abadias M (2010) Microbiological Quality Of Fresh Lettuce from Organic and Conventional Production Food Microbiology 27: 679-684.
- Ngouajio M, Foko J, Fouejio D (1997) The Critical Period of Weed Control In Common Bean (Phaseolus Vulgaris L). In Cameroon Crop Protection 16: 127-133.
- Fontanelli M, Martelloni L, Raffaelli M, Frasconi C, Ginanni M, et al. (2015) Weed Management. In Autumn Fresh Market Spinach: A Nonchemical Alternative Horttechnology 25: 177-184.
- Alam MR, Hoque M, Rahman M, Islam F, Hossain MA, et al. (2002) Effect of Weed Control Methods on the Growth And Yield Of Rainfed Aus Rice Asian. Journal Of Plant Sciences 1: 298-299.
- Kelly MJ, Pritts MP, Bellinder RR (2007) Evaluation of New Cultivation Tools to Reduce Labor Requirements In Matted-Row Strawberry Culture Horttechnology 17: 87-94.
- Smith R, Lanini WT, Gaskell M, Mitchell J, Koike ST, et al. (2000) Weed Management for Organic Crops.
- Sandeep Kumar K, Usha B (2018) Convolution Neural Network Based Weed Detection In Horticulture Plantation.
- Shinde AK, Shukla, M Y 2014 Crop Detection by Machine Vision for Weed Management International Journal Of Advances In Engineering & Technology 7: 818.
- Montalvo M, Pajares G, Guerrero JM, Romeo J, Guijarro M, et al. (2012) Automatic Detection of Crop Rows In Maize Fields With High Weeds Pressure Expert Systems With Applications 39: 11889-11897.
- Gerhards R, Oebel H (2006) Practical Experiences with a System for Site‐Specific Weed Control. In Arable Crops Using Real‐Time Image Analysis and Gps‐Controlled. Patch Spraying Weed Research 46: 185-193.
- Elzinga CL, Salzer DW, Willoughby JW (1998) Measuring & Monitering Plant Populations.
- Dodd AN, Salathia N, Hall A, Kévei E, Tóth R, et l. (2005) Plant Circadian Clocks Increase Photosynthesis, Growth, Survival, and Competitive Advantage Science 309: 630-633.
- Salatneh Ashqer Y, Bikdash M, Liang CLK (2019) A Structured Image Processing Operation Library to Automatically Isolate Weeds And Crops Ieee Southeastcon.
- Krebs CJ (1989) Ecological Methodology Harper & Row New York.
- Bross I (1954) A Confidence Interval for A Percentage. Increase Biometrics 10: 245-250.
- Howden SM, Soussana JF, Tubiello FN, Chhetri N, Dunlop M, et al. (2007) Adapting Agriculture to Climate Change Proceedings Of The National Academy of Sciences 104: 19691-19696.
- Manske LL (2002) Environmental Factors That Affect Range Plant Growth In The Dickinson, North Dakota, Region, ppt. 1892-2001.
- Weather-Channel 2019 Greensboro Weather Channel.
-
Yaqeen Salatneh A, Chyi Lyi L, Marwan B. Creating a Multivariate-Multifunctional Database for Weed Control to Support Organic Mixed Vegetable Production. World J Agri & Soil Sci. 4(5): 2020. WJASS.MS.ID.000596.
-
Critical period, Monitoring, Organic farming, Gather images
-

This work is licensed under a Creative Commons Attribution-NonCommercial 4.0 International License.


