 Research Article
Assessing the Risks of Spatial Spread of the New Coronavirus COVID-19 by Models
Jinming Cao1, Xia Jiang2 and Bin Zhao3*
1School of Information and Mathematics, Yangtze University, Jingzhou, Hubei, China
2Hospital, Hubei University of Technology, Wuhan, Hubei, China
3School of Science, Hubei University of Technology, Wuhan, Hubei, China
Bin Zhao, School of Science, Hubei University of Technology, Wuhan, Hubei, China.
Received Date: May 12, 2020; Published Date: May 26, 2020
Abstract
With the spread of the new coronavirus around the world, governments of various countries have begun to use the mathematical modeling method to construct some virus transmission models assessing the risks of spatial spread of the new coronavirus COVID-19, while carrying out epidemic prevention work, and then calculate the inflection point for better prevention and control of epidemic transmission. This work analyzes the spread of the new coronavirus in China, Italy, Germany, Spain, and France, and explores the quantitative relationship between the growth rate of the number of new coronavirus infections and time.
Background: In December 2019 , the first Chinese patients with pneumonia of unknown cause is China admitted to hospital in Wuhan, Hubei Jinyintan , since then, COVID-19 in the rapid expansion of China Wuhan, Hubei, in a few months’ time, COVID-19 is Soon it spread to a total of 34 provincial-level administrative regions in China and neighboring countries, and Hubei Province immediately became the hardest hit by the new coronavirus. In an emergency situation, we strive to establish an accurate infectious disease retardation growth model to predict the development and propagation of COVID-19, and on this basis, make some short-term effective predictions. The construction of this model has Relevant departments are helpful for the prevention and monitoring of the new coronavirus, and also strive for more time for the clinical trials of Chinese researchers and the research on vaccines against the virus to eliminate the new corona virus as soon as possible.
Methods: Collect and compare and integrate the spread of COVID-19 in China, Italy, France, Spain and Germany, record the virus transmission trend among people in each country and the protest measures of relevant government departments. According to the original data change law, Establish a Logistic growth model.
Findings: Based on the analysis results of the Logistic model, the Logistic model has a good fitting effect on the actual cumulative number of confirmed cases, which can bring a better effect to the prediction of the epidemic situation and the prevention and control of the epidemic situation.
Interpretation: In the early stage of the epidemic, due to inadequate anti-epidemic measures in various countries, the epidemic situation in various countries spread rapidly. However, with the gradual understanding of COVI D -19, the epidemic situation began to be gradually controlled, thereby retarding growth.
Keywords: New coronavirus; Logistic growth model; Infection prediction and prevention
Introduction
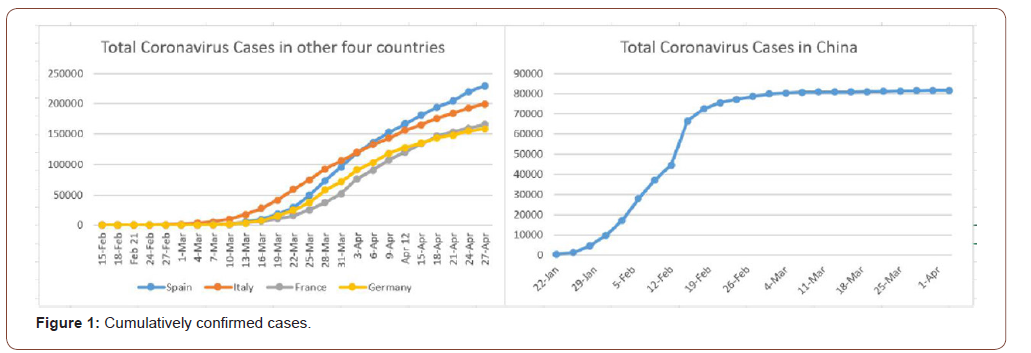
After the outbreak of COVID-19 in China, COVID-19 has also erupted in other countries in the world. Among the countries where new pneumonia outbreaks, Spain, Italy, France and Germany are more serious [1]. As of April 27, Spain, Italy, France and Germany have each accumulated diagnosed 229842 cases, 199414 cases, 165,842 cases, 158758 cases, the new crown pneumonia spread, and various measures of everyday life and people’s social normal operation had not Estimated impact [2].
In fact, there are some urgent problems to be solved regarding the spread of COVID -19. Can existing interventions effectively control COVID-19? Can you elaborate on the changes and development characteristics of each epidemic situation? Can you combine the conclusions found in the comparison of the city / region, actual national population, medical level, traffic conditions, geographic location, customs and culture, and anti-epidemic measures? What mathematical model can we build to solve the problem?
COVID-19 is a new coronavirus discovered in December 2019. The epidemic data is not sufficient, and clinical methods such as clinical trials are still in the exploration stage. So far, the epidemic situation data is difficult to apply directly to the existing mathematical model. The problems to be solved are how effective the existing emergency response is and how to invest medical resources more scientifically in the future. On this basis, this article aims to study the shortcomings of this part [3-5].
Methods
Data
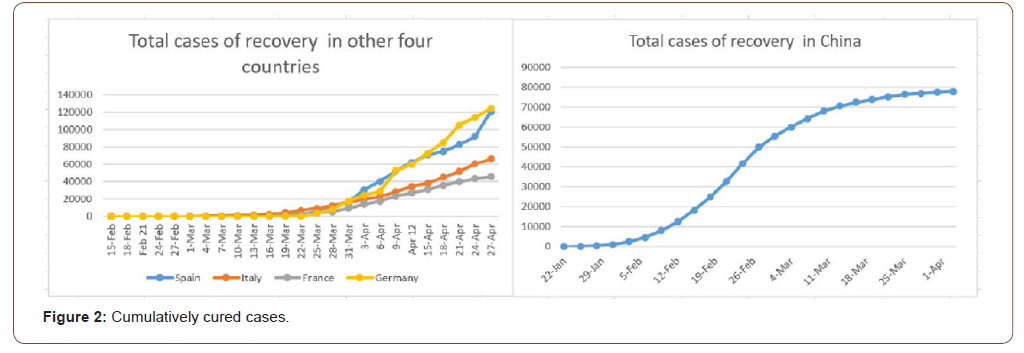
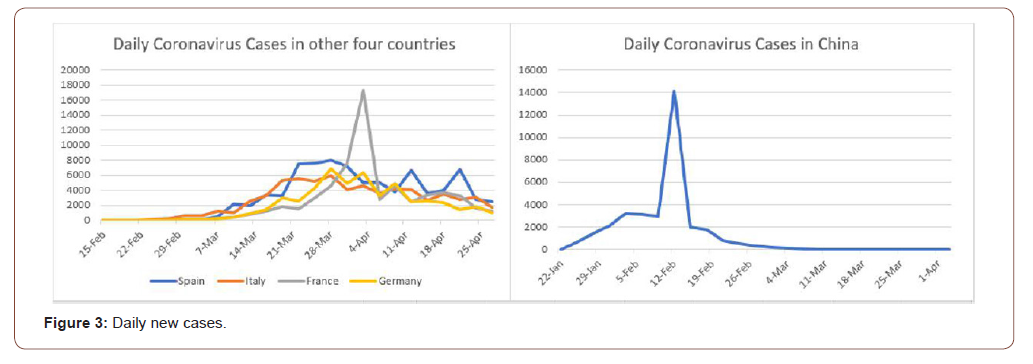
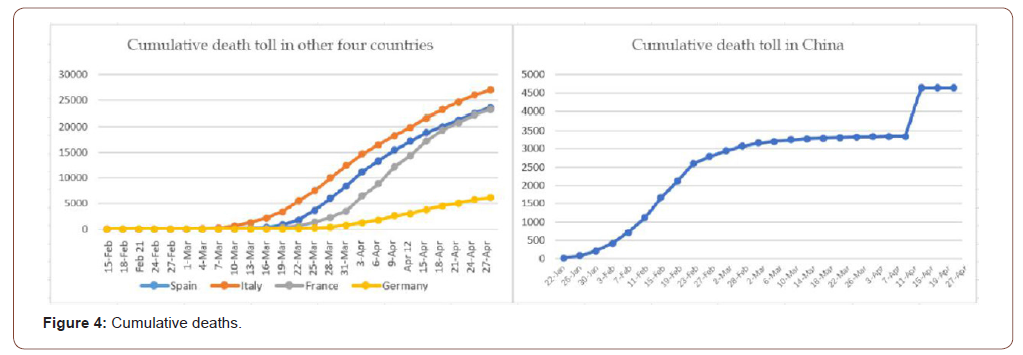
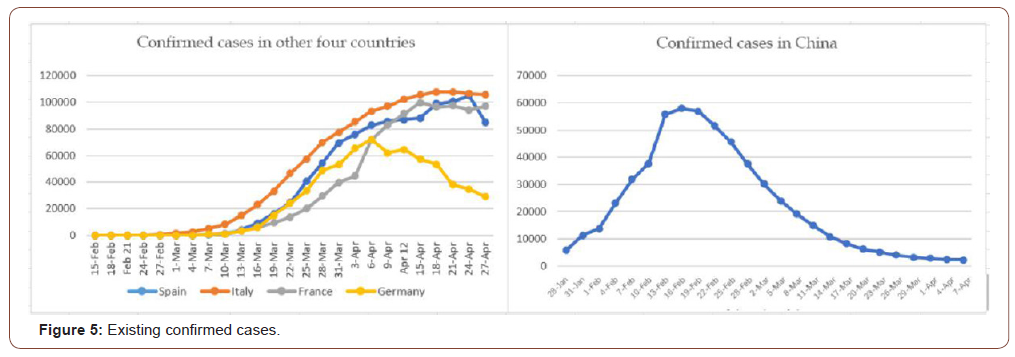
We obtained epidemiological data from the Aminer website, the People’s Republic of China from January 22 to April 3, and Spain, Italy, France, Germany from February 15 to April 27. This includes data such as cumulative confirmed cases, cumulative deaths, newly diagnosed cases per day, cumulative number of cured cases, and existing confirmed cases. The relevant input is shown in the figure (Figure 1-5):
The model
Based on the collected epidemic data, we tried to find the propagation law of COVID-19 and proposed effective prevention and control methods.
There are generally three methods for systematically studying the spread of infectious diseases. One is to establish a dynamic model of infectious diseases. The second is statistical modeling
Based on Logistic estimated square law
The traditional SEIR model cannot describe the different developments of the epidemic well. After analyzing the actual situation and the existing data, we have established a more effective infectious disease transmission model. According to the using statistical methods such as random processes and time series analysis. The third is to use data mining technology to obtain information in the data and discover the epidemic law of infectious diseases. Using the collected data from various countries, this article mainly uses the third method.
In this paper, the growth model of COVID-19 transmission is established, and the prediction effect of the mathematical model on the spread of COVID-19 epidemic is compared.
actual situation of the epidemic, we will analyze the relevant data indicators of the five countries (cumulatively diagnosed cases, cumulative deaths, newly diagnosed cases per day, cumulative number of cured cases, existing confirmed cases) to adapt to the current situation of the new coronary pneumonia epidemic in the world propagation (Table 1).
Table 1: The significance of each parameter under the construction of Logistic model.

As can be seen from the data graph, the change in cumulative death toll in Italy over time is a non-linear process. Considering the shape of the scatter plot and the model generally involving the Logistic curve model, here we use the Logistic curve model for fitting. The basic form of the logistic curve model is:
y = 1 / (a + be ^ (-t))
Therefore, we need to transform this nonlinear process into a linear model after data processing.
Take x0 = e ^ (-t), y0 = 1 / y; Then the original model is converted to a linear model y0 = a + bx0.
Simulation
Since COVID-19 has been developing in Italy for a long period of time, and the cumulative number of confirmed cases is relatively large, the data is more convincing, so here we take the cumulative number of confirmed cases in Italy from February 15th to May 3rd. The nonlinear model becomes a linear model, and matlab is used for fitting linear regression analysis. Matlab source code is as follows [6-9]:
x = [1: 1: 27];
y=[3,3,21,229,655,1701,3089,5883,10149,17660,27980,4103 5,59138,74386,92472,105792,119827,132547,143626,156363,1 65155,175925,183957,192994,199414,205436 , 210717];
plot (x, y, ‘r *’);
xlabel (‘time’)
ylabel (‘population’) x0 = exp (-x);
y0 = 1. / y;
f = polyfit (x0, y0,1);
y_fit = 1 ./ (f (1). * exp (-0.338. * x) + f (2));
plot (x, y_fit * 1000);
hold on
plot (x, y, ‘r *’);
xlabel (‘time’)
ylabel (‘population’)
Results
Logistic model estimates
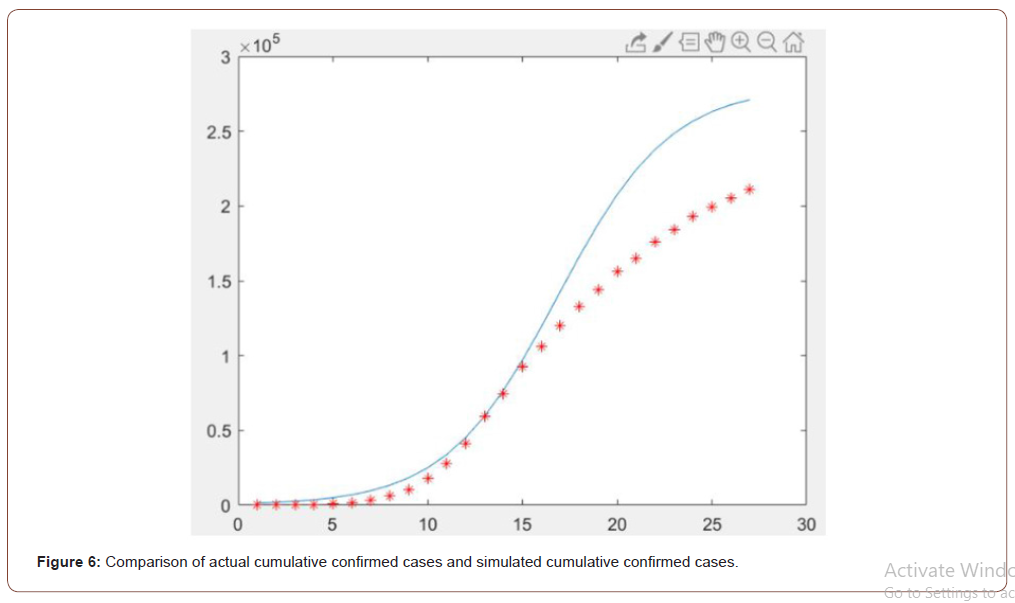
On the basis of the cumulative number of confirmed cases in Italy from February 15th to May 3rd, we used Matlab to establish a Logistic model and performed linear regression analysis. Using the above processing, we can get the predicted cumulative number of confirmed cases in Italy as shown in Figure 6.
As shown in Figure 6, we can conclude that the Logistic model has a good fitting effect on the actual cumulative number of confirmed cases, thus providing reference value for departments and hospitals at all levels to effectively intervene and prevent the spread of new coronavirus in the next few days.
Discussion
The spread of COVID-19 is affected by many complex factors. In the early stage of the transmission of COVID-19, it is difficult to establish a Logistic model and parameter estimation and obtain a fairly accurate simulation result, but the initial estimated parameters such as the growth rate of the confirmed cases and the possible cumulative maximum confirmed cases can be obtained through existing data. It is helpful to solve important parameters such as infection rate and recovery rate, which will help us to grasp the transmission trend of COVID-19 more accurately.
Limitations
• Promotion of the model: The SEIR model based on 2019-nCoV can be established. The SEIR model is superior to the logistic model in trend prediction, but due to the many parameters to be considered, the calculation error is greater than the logistic model [10-19].
• A dynamic growth rate model based on 2019-nCoV can be established. The dynamic growth rate model has a good fitting effect but has a certain error.
• You can also optimize on the value of r. The methods of optimizing r are: 1. Perform grid optimization; 2. Perform bipartite optimization; You can optimize on the value of K and update in real time.
• After the turning point of the epidemic situation, that is, the fitting effect of the reducer and the saturation period is poor, and even a large error occurs [20-23].
Acknowledgement
This work was supported by the Philosophical and Social Sciences Research Project of Hubei Education Department (19Y049), and the Staring Research Foundation for the Ph.D. of Hubei University of Technology (BSQD2019054), Hubei Province, China.
Conflict of interest
We have no conflict of interests to disclose and the manuscript has been read and approved by all named authors.
References
- http://www.nhc.gov.cn/xcs/yqfkdt/202005/f8d5621b55b7434ba452dcaf9fa1aae7.shtml [Accessed 11 May 2020]
- (2020) Use Logistic growth model to fit the number of infections (updated on 2.11).
- (2020) Python implements logistic growth model fitting 2019-nCov confirmed number of people.
- (2020) Dynamic growth rate model and analysis of overseas epidemic situation.
- The establishment and improvement of SEIR model based on 2019-nCoV.
- (2020) Calculate the inflection point of the new coronary pneumonia epidemic.
- (2020) [Coronavirus Pneumonia 2020-Wuhan Come on] Use regression model and LSTM to predict the number of diagnosed patients.
- (2020) [Coronavirus Pneumonia 2020-Wuhan Come on] Use Logistic growth model to predict the number of diagnosed patients.
- Big secret! Four mathematical models of Wuhan pneumonia spread (code attached).
- BlogCommendFromMachineLearnPai23&depth_1utm_source=distribute.pc_relevant.none-task-blog-Blog CommendFromMachineLearnPai2-3 [Accessed 07 Feb 2020]
- (2020) [Hubei Daily] Correct the epidemic data to grasp the impact of the epidemic.
- https://www.baidu.com/link?url=bteawStCC4AxqykDnb2m8Sg7dbi34rReAX6vxzuHHiSyhlXKNpbwTS TCwvrRUQaQMAOJJb4nX0O546zhYWb1q&wd=&eqid=bf461f490008aca4000000055eb1071a [Accessed 30 Mar 2020]
- (2020) National Health Commission of the People’s Republic of China.
- (2020) National Health Commission of the People’s Republic of China.
- (2020) Epidemic prediction of COVID-19.
- Ming W, Huang J, Zhang CJP (2020) Breaking down of healthcare system: Mathematical modelling for controlling the novel coronavirus (COVID-19) outbreak in Wuhan, China [J]. bioRxiv 12(1): 627-630.
- (2020) Health Commission of Hubei Province.
- Chan J FW, Yuan S, Kok KH, Kelvin Kai-Wang To, Hin Chu, et al. (2020) A familial cluster of pneumonia associated with the2019 novel coronavirus indicating person-to-person transmission: a study of a family cluster [J]. The Lancet 395(10223): 514-523.
- (2020) National Health Commission of the People’s Republic of China.
- Chaolin Huang, Yeming Wang, Xingwang Li, Lili Ren, Jianping Zhao, et al. (2020) Clinical features of patient sinfected with 2019 novel coronavirus in Wuhan, China[J]. The Lancet 395(10223): 497-506.
- Haagmans BL, Al Dhahiry SH, Reusken CB, V Stalin Raj, Monica Galiano, et al. (2014) Middle East respiratory syndrome coronavirus in dromedary camels: an outbreak investigation [J]. Lancet Infect Dis 14: 140-145.
- Azhar EI, El-Kafrawy SA, Farraj SA, Ahmed M Hassan, Muneera S Al-Saeed, et al. (2014) Evidence for camel-to-human transmission of MERS coronavirus[J]. N Engl J Med 370: 2499-2505.
- Zhou P, Fan H, Lan T, Xing-Lou Yang, Wei-Feng Shi, et al. (2018) Fatal swine acute diarrhoea syndrome caused by an HKU2-related coronavirus of bat origin [J]. Nature 556: 255-258.
-
Xia Jiang, Jinming Cao, Bin Zhao. Assessing the Risks of Spatial Spread of the New Coronavirus COVID-19. World J Agri & Soil Sci. 5(1): 2020. WJASS.MS.ID.000603.
-
New coronavirus, Logistic growth model, Infection prediction and prevention
-

This work is licensed under a Creative Commons Attribution-NonCommercial 4.0 International License.


