 Review Article
Economic Impact of the Louisiana Motion Picture Incentive (MPI) Program
Anthony J Greco1* and David Stevens2
1University of Louisiana at Lafayette, Department of Economics, USA
2Department of Management,University of Louisiana-Lafayette, USA
Anthony J Greco, Department of Economics, University of Louisiana at Lafayette, USA.
Received Date: October 17, 2019; Published Date: October 31, 2019
Synopsis
After the passage of its Motion Picture Incentive Act of 2002 and subsequent amendments, Louisiana granted tax credits for certain expenditures and payroll. This paper investigates the impact of Louisiana’s incentives program on the state’s economy over the 2002-2015 period through correlation and regression analyses. Statistically significant models were found to exist, leading the authors to conclude that the state’s incentives program performed very well.
Introduction
In 1992, Louisiana became the first state to adopt motion picture tax incentives via the enactment of section 47:6007 of the Louisiana Revised Statutes. However, the state did not experience any substantive production activity until after the passage of its Motion Picture Incentive Act of 2002 and subsequent amendments to same in 2003, 2005 and 2009.The lack of success of the original legislation in stimulating the Louisiana film industry has been attributed to the fact that it only compensated filmmakers for losses, as well as, the requirement that the credits had to be used against one`s Louisiana income tax liability.
However, very few, if any, film production companies were based in the state (5). As of the 2009 amendments, the state had an incentive tax rate of 30 percent for in-state productions and an incentive tax rate of 5 percent for expenditures on payroll for Louisiana residents. That is, the state could authorize a tax credit against Louisiana state income tax for each investor (production company) if the amount of the investment (production expenditures) exceeded $300,000.00. Further, each investor could receive an additional tax credit of five percent of its payroll to Louisiana residents. The state’s legislation offered recipients of these credits the opportunity to transfer or sell any previously unclaimed tax credits to another Louisiana taxpayer or to the Louisiana Governor’s office of Film and Television [1]. This ability to transfer the tax credits is significant because most non- Louisiana production companies have no Louisiana state income tax liability. They can, therefore, essentially monetize their credits through appropriate intermediaries by exchanging their credits for cash. Otherwise, such production companies can transfer their tax credits to the aforementioned Louisiana agency for 85 percent of the face value of the credits [2].
As of 2004, six states had some form of MPIs designed to attract motion picture productions within their borders. However, by the end of 2009, 44 states had some type(s) of MPIs. From the outset, such incentives have been shrouded in controversy. Proponents of MPIs claim that they enhance economic development and generate substantial employment opportunities in the private sector, as well as generate significant tax revenue for the public sector. On the other hand, critics of MPIs contend that their associated benefits are overstated and that their concomitant costs are understated. They charge that many of the jobs created by such programs are temporary in nature. MPI detractors further decry them as picking winners and losers (identifying the film industry as benefactors of such legislation, while leaving out other industries) and urge instead that states should implement tax systems that welcome all industries in an effort to generate wealth creation within their borders.
There have been many reports and studies undertaken relative to the pros and cons of the MPI programs of the various states. In general, commissioned or self-generated studies by such states have extolled the positive economic effects of their MPI programs while independent studies have often emphasized negative economic aspects of such programs. It is probably fair to say that there has been an over-proliferation of such programs, i.e. that states tended to implement such programs on a “monkey-see monkey-do” basis in an attempt to lock into new methods of raising desperately needed revenue. Indeed, since the initial rush to establish such programs, some states have eliminated or have reduced the incentives offered in their programs. However, at least in one case, a generally critical study of such programs acknowledges that Louisiana, New Mexico, and Michigan, which were essentially pioneers in the MPI movement, have enjoyed great success in attracting film productions within their states [3].
Due to the over-proliferation of state MPI programs, a shakeout over time of some, if not many, of these programs was to be expected. However, some state programs, such as that of Louisiana, may survive and prosper over the long haul due to various factors such as getting an early jump in the race to attract more productions, the formation of comfortable relationships between states and production companies, the astute development of instate personnel and facilities making the state’s movie industry increasingly mature and efficient in the film-generating process, as well as, unique or alluring economic, cultural, climatic, topographic or other features of a state. Considering that the movement to MPIs only began in 2002, it is probably too soon to make definitive judgements on the long run economic effects of these programs or on which state programs will endure.
Studies and reports relative to the state MPI programs have focused on their impact on output employment, wages, and growth within the private sector, as well as on the fiscal impact relative to tax revenue within the public sector. These works are discussed in a prior article by one of the present authors [4]. It was thought best not to discuss them again in the present article. The presumption has been that MPIs are solely responsible for attracting film productions to individual states. Though such incentives may, indeed, be the main reason why producers initially undertake operations within a state, there may be, as alluded to previously, other factors that attract production companies to operate and continue to operate over time in certain states.
Using correlation and regression analysis, this paper purports to investigate the influence of Louisiana’s MPI program on the state’s economy and explore whether other factors (variables) have an influence on attracting and maintaining film production activity within the state. Available data relate to the Louisiana MPI programs for the years 2002-2015 and relate to tax incentives granted under the program, earnings generated in the private and public sectors, jobs created under the program, as well as several relevant data series derived from the data set [5].
Data
Information was obtained from the Louisiana Film Commission for all certified film productions undertaken in Louisiana from 2002-2015. As of mid-2018, only partial data are available for 2016, which is why this analysis concludes with data from 2015. The productions were combined for each year of the 2002-2015 period and totals were calculated for each variable.
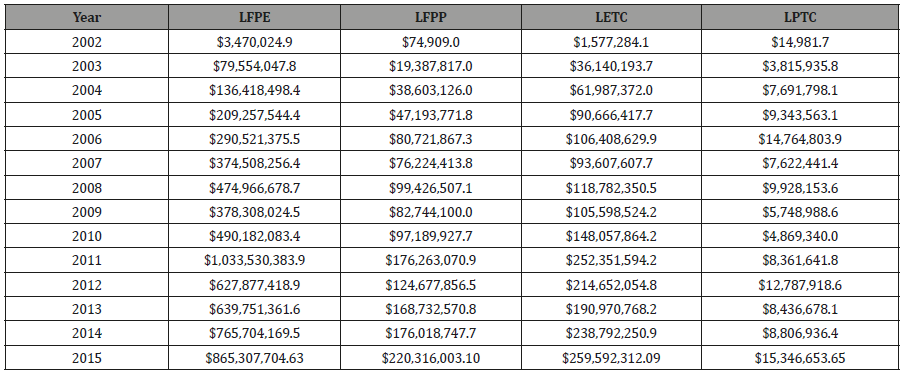
Table 1 shows the data utilized in these analyses. The variables have the following meanings
• LFPE = Louisiana Film Production Expenditures (subject to 30% tax credit)
• LFPP = Louisiana Film Production Payroll (subject to 5% tax credit)
• LETC = Louisiana (Film Production) Expenditure Tax Credits
• LPTC = Louisiana (Film Production) Payroll Tax Credits
Table 1:Louisiana Economic Data Relative to Motion Picture Incentives.

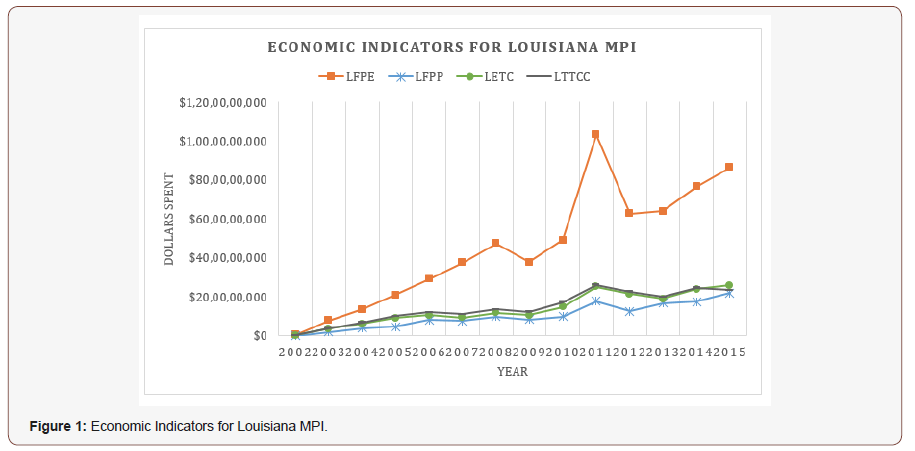
Figure 1 provides a visual summary of these data values. These data, with the exception of a spike in 2011, indicate a steady increase in production expenditures (LFPE) in the state, with an average yearly increase of 51.0% per year for the period from 2002 through 2015. Note that in this discussion, all yearly increases are obtained by calculation of the geometric mean. Not surprisingly, the tax credits associated with those expenditures (LETC) also show a steady yearly increase of 46.3% during the same time period. Note that the tax credit growth is less because not all expenditures qualify for the program. Recall that expenditures had to exceed $300,000 per project. In terms of payroll expenditures, the total payroll for film (LFPP) shows an average annual increase of 82.1% per year. The tax credits associated with those payroll expenses (LPTC) show a 66.7% yearly increase from 2002 through 2015. The lower rate of increase for tax credits indicates that not all companies took advantage of the incentive program by hiring Louisiana residents Figure 1.

Models
The purpose of this research is to investigate the overall effectiveness of the MPI program. Towards that goal, correlation and linear regression models can be used to quantify the significance of the relationships between total expenditures and expenditure tax credits, as well as between total payroll and payroll tax credits. Of course, those relationships should be very strong assuming that companies are aware of the program and take advantage of the tax breaks that it offers.
Correlation
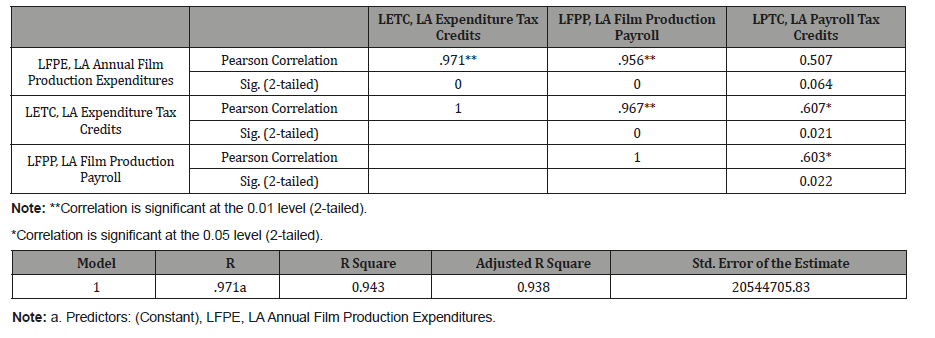
Table 2 shows the correlations between these variables. Among these, the associations of greatest interest are between annual expenditures and their associated expenditure tax credits, and between payroll and their associated payroll tax credits. As expected, annual expenditures (LFPE) is very highly correlated (very strong positive relationship) with expenditure tax credits with a correlation coefficient of +.971. This result indicates that virtually all expenditures were associated with the corresponding tax credit which was available. Surprisingly, payroll (LFPP) has only a moderately positive relationship with payroll tax credits (LPTC), with a value of +.603. This result indicates that a significant portion of companies did not take advantage of the payroll tax credit which was available to them (Table 2).
Other variables, including the population of the state, state per capita income, and infrastructure tax credits were also investigated but did not show statistically significant relationships with the four primary economic variables listed in Table 2. These variables were eliminated from further analyses and are not included in the tables and figures for the sake of brevity.
Table 2:Pearson correlations, r, among variables.

Regression results
Linear regression produces a statistically significant (sig. = 0.000) model between film production expenditures (LFPE) and expenditure tax credits (LETC), such that every additional $100 spent produces $26.20 in tax credits. See Table 3 below. Note that this value is less than the $30 tax credit which is the theoretical maximum under the law. As shown above (and also in regression output in Table 3 below) with correlations between these two variables, this result indicates that companies were largely able to claim the tax credit for almost all expenditures (r-squared = .943 indicates that 94.3% of variation in expenditure tax credits is explained by variation in expenditures). Note that this result is identical to that in Table 3 for R and R Square since only a single variable is being used in the regression.
Table 3:Pearson correlations, r, among variables.

Similarly, linear regression produces a statistically significant (sig. = .022) model between payroll expenditures (LFPP) and payroll tax credits (LPTC), such that every additional $100 spent on payroll produces $3.80 in payroll tax credits. See Table 4 below. Note that this value is less than the $5 tax credit which is the theoretical maximum under the law. Again, as with correlations suggested above between these two variables, this result indicates that companies did not fully take advantage of the tax breaks for which they were eligible. This model has an r-squared = .364, indicating that 36.4% of the variation in payroll tax credits is explained by variation in payroll expenditures (Table 4).
Table 4:Linear Regression Model Summary for LFPP and LPTC.

Conclusions and Future Research
From the period 2002 through 2015, the film industry spent increasing amounts of money within the state of Louisiana each year. Not only did total expenditures rise rapidly: at a yearly increase of 51.0%, but payroll expenditures also increased significantly each year, showing an average annual growth rate of 82.1% per year. Over the thirteen-year period, production expenditures increased by a factor of 212: from $3,470,024 in 2002 to $737,775,763 in 2015. During this same time period, payroll expenditures increased by a factor of 2,420: from $74,909 in 2002 to $181,322,430 in 2015. It is difficult to imagine that state legislators could have expected the program to perform any better.
While state lawmakers did not provide any metrics by which the motion picture incentive program should be evaluated, it seems quite reasonable to conclude that it has been a success within the state of Louisiana. Filmmakers use 87.3% of the expenditure tax credits available to them, and 76% of the payroll tax credits available. Given the significant drop in the price of oil beginning in 2015, and the fact that Louisiana’s economy is very much dependent on the energy industry, it will be very interesting to look at potential changes in film industry spending within the state in the coming years. It would also be interesting to look at the results of similar programs in other states, and to compare results to determine whether the results obtained in Louisiana are generalizable to the entire United States.
Finally, while there were other variables investigated that did not have significant relationships with production expenditures and payroll expenditures and their associated tax credits, further investigation could potentially uncover such variables. This is especially true if the investigation were to be more focused on which variables actually impact production expenditures. This could include such variables as type of film, production company, production budget, time of year that filming begins, and ratings of the notoriety of actors and actresses participating in the film.
End Notes
1. Grand, 2006.
2. Louisiana Acts 1992, 2002, 2003, 2005, 2007, 2009.
3. McDonald, 2011.
4. Greco, 2015.
5. Greco, 2015; Greco, 2017.
Acknowledgement
No conflict of interest.
Conflict of Interest
None.
References
- Grand, John (2006) Motion Picture Tax Incentives: There’s No Business-Like Show Business. State Tax Notes 791-803.
- Greco, Anthony J (2015) Louisiana’s Motion Picture Incentives Program: How Well is it Working. Southwestern Economic Review 42: 197-210.
- Greco, Anthony J (2017) A Reexamination of the Economic Impact of Louisiana’s Motion Picture Incentive Program. Journal of Business, Industry, and Economics 22: 17-40.
- Louisiana Act of 894, H.B. 521, 1992; Acts 1 and 2, Extraordinary Session, Louisiana Legislature, 2002; Acts 551 and 1240, Regular Session, Louisiana Legislature, 2003; Act 456, Regular Session, Louisiana Legislature 2005; Act 482, Regular Session, Louisiana Legislature 2007; Act 478, Regular Session, Louisiana Legislature, 2009.
- McDonald, Adrian (2011) Down the Rabbit Hole: The Madness of State Film Incentives as a ‘Solution’ to Runaway Production. University of Pennsylvania Journal of Business Law 14(1): 85-165.
-
Anthony J Greco, David Stevens. Economic Impact of the Louisiana Motion Picture Incentive (MPI) Program. Sci J Research & Rev. 2(2): 2019. SJRR.MS.ID.000532.
Motion Picture Incentive Act, Subsequent amendments, Filmmakers, Production, Essentially monetize concomitant costs, Attempt to lock, Film-generating process, Presumption
-

This work is licensed under a Creative Commons Attribution-NonCommercial 4.0 International License.


