 Research Article
Status Of EDXRF Method Validation and Quality Control in the Chemistry Division of Atomic Energy Centre, Dhaka, Bangladesh
Shirin Akter1*, Yeasmin N Jolly1, Jamiul Kabir1, Sushmita Hossain1, K M Mamun1 and M J Abedin2
1Chemistry Division, Atomic Energy Centre, Dhaka, P.O. Box 164, 4, Kazi Nazrul Islam Avenue Shahbag, Dhaka 1000, Bangladesh
2Accelerator Facilities Division Atomic Energy Centre, Dhaka, P.O. Box 164, 4, Kazi Nazrul Islam Avenue Shahbag, Dhaka 1000, Bangladesh
Shirin Akter, Chemistry Division, Atomic Energy Centre, Dhaka, P.O. Box 164, 4, Kazi Nazrul Islam Avenue Shahbag, Dhaka 1000, Bangladesh
Received Date:March 25, 2025; Published Date:April 03, 2025
Abstract
The Chemistry Division of the Atomic Energy Centre, Dhaka, has actively engaged in validating and implementing quality control measures for Energy Dispersive X-Ray Fluorescence (EDXRF) spectrometry. The division employs the EDXRF system for elemental analysis across environmental and industrial applications. Rigorous quality control procedures, including calibration with certified standards and verification using multi-elemental reference materials, ensure the accuracy and reliability of analytical results. These efforts contribute to high analytical standards, enhancing the credibility of research findings in environmental monitoring and pollution assessment.
Keywords:Energy Dispersive X-Ray Fluorescence (EDXRF); Precision, Accuracy; Calibration
Introduction
X-ray Fluorescence (XRF) Analysis is a non-destructive instrumental method used for the qualitative and quantitative analysis of chemical elements. It is based on the measurement of characteristic fluorescent radiation emitted when inner-shell vacancies, created by an external radiation source, are de-excited. Among the various types of XRF analysis, the two major approaches are Wavelength Dispersive X-ray Fluorescence (WDXRF) and Energy Dispersive X-ray Fluorescence (EDXRF). These techniques are primarily differentiated by the type of detector used to measure the characteristic emission spectra. WDXRF employs a diffracting crystal to separate and determine the characteristic wavelengths of emitted X-rays. EDXRF utilizes detectors that directly measure the energy of the X-rays by collecting the ionization produced in a suitable detecting medium. A wide range of EDXRF analytical systems has been developed using various excitation sources, including radioisotopes, X-ray tubes, charged particle accelerators, microprobe electron beams, and synchrotron radiation sources. Energy Dispersive X-ray Fluorescence (EDXRF) spectroscopy is a widely used analytical technique for non-destructive, multielemental analysis in environmental, industrial, and material science applications. The Chemistry Division of the Atomic Energy Centre, Dhaka (AECD) employs EDXRF for the determination of elemental composition in various samples, including soil, sediments, road dust, and industrial materials. To ensure the reliability of EDXRF results, method validation and quality control (QC) procedures are strictly followed. These steps confirm the accuracy, precision, detection limits, and robustness of the analytical method, ensuring compliance with international standards and national research objectives. This report highlights the current status of EDXRF method validation and quality control at AECD, focusing on calibration procedures, performance evaluation, and quality assurance measures [1-10].
Process of X-ray Line Excitation
When radiation, such as charged particles or photons, interacts with an atom, it is absorbed, transferring its energy to an orbital electron. This absorption process, known as photoelectric absorption, results in the ejection of the electron, creating a vacancy in the atom’s energy level. The ejected electron, referred to as a photoelectron, carries the acquired kinetic energy away from the atom. To restore equilibrium, an electron from a higher energy level transitions to fill the vacancy. This transition releases a quantum of energy in the form of fluorescence X-rays. Since electron energy levels in an atom are well-defined, the emitted X-rays have characteristic energy values unique to each element. By analyzing the energy of these X-rays, elements can be identified (qualitative analysis). Furthermore, by measuring the intensity of the emitted X-rays, the concentration of the element can be determined (quantitative analysis) [1]. In X-ray spectrometric analysis, the intensity of the secondary spectral lines emitted by the analyte is measured to estimate its concentration.
Primary X-ray Beam Intensity and Spectrum
The incident X-ray beam interacts with the sample, leading to excitation of atoms. The intensity (I0I_0I0 ) and energy distribution of this beam determine how many atoms can be excited. Absorption of Primary X-rays in the Sample The probability of the incident X-rays exciting the analyte depends on how much energy is absorbed by the analyte atoms relative to the matrix material. This is governed by the mass absorption coefficient (μ\muμ) and thickness of the sample.
Excitation Probability & Fluorescent Yield
Not all excited atoms emit characteristic X-rays; some undergo non-radiative transitions. The fluorescence yield (ω\omegaω) describes the probability of X-ray emission after excitation. Once X-rays are emitted, they may be reabsorbed by the sample or matrix before reaching the detector. The self-absorption effect is influenced by the sample composition and thickness. The efficiency of detecting X-ray photons depends on the sample-detector configuration. Factors like take-off angle, detector efficiency, and collimation affect the measured intensity. This theoretical framework is essential for quantitative XRF analysis, where corrections for matrix effects and instrumental factors must be applied to accurately determine analyte concentrations.
Materials and Methods
Method Validation
Method validation is essential to confirm that the EDXRF technique produces accurate and reproducible results. The Chemistry Division follows rigorous validation protocols, which include: Calibration and Standardization: Calibration is performed using certified reference materials (CRMs) with known elemental concentrations. Calibration curves are constructed by plotting elemental X-ray intensities against their concentrations. Matrixmatched standards are used to minimize interference effects. Energy Dispersive X-ray Fluorescence Spectrometry (EDXRF) was employed to quantify heavy metals (Cr, Mn, Fe, Co, Ni, Cu, Zn, As, Sr, Hg, and Pb) in wastewater and cultured fish samples. The analytical method was validated by constructing a calibration curve using the certified reference material (CRM) “Tuna Fish Homogenate/ IAEA-350.” To ensure the accuracy of the calibration curve, another CRM, “TORT-2,” was used as part of the quality control process. For water samples, the calibration curve was developed using a cellulose-based, lab-synthesized multi-elemental standard (Cellu-1), while another lab-synthesized water standard (Cellu-2) was used to verify the quality of the curve. The results, presented in Table 1, indicate that the percentage error remained within ±10%. The complete methodology for sample analysis and method validation for both water and fish is detailed [11]. When radiation, such as charged particles or photons, interacts with an atom, it is absorbed, transferring its energy to an orbital electron. This absorption process, known as photoelectric absorption, results in the ejection of the electron, creating a vacancy in the atom’s energy level. The ejected electron, referred to as a photoelectron, carries the acquired kinetic energy away from the atom. To restore equilibrium, an electron from a higher energy level transitions to fill the vacancy. This transition releases a quantum of energy in the form of fluorescence X-rays. Since electron energy levels in an atom are well-defined, the emitted X-rays have characteristic energy values unique to each element. By analyzing the energy of these X-rays, elements can be identified (qualitative analysis). Furthermore, by measuring the intensity of the emitted X-rays, the concentration of the element can be determined (quantitative analysis). In X-ray spectrometric analysis, the intensity of the secondary spectral lines emitted by the analyte is measured to estimate its concentration.
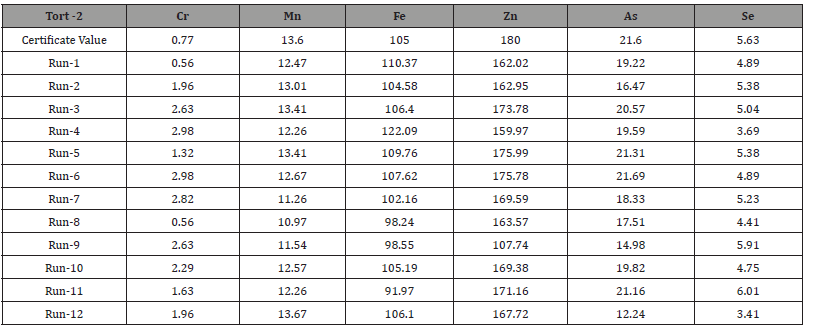
The Energy Adjustment Procedure corrects energy drift in analytical instruments, ensuring optimal performance, especially after a software upgrade. It realigns energy settings using reference standards, maintains accuracy, and prevents deviations in measurements. The process involves pre-checks, calibration, validation, and saving adjustments to ensure consistent and reliable results. Comparison between Present Results and the Certified Values of Standard (Tort-2) Reference Materials (mg kg-1).
Table 1:Comparison between Present Results and the Certified Values of Standard (Tort-2) Reference Materials (mg kg-1).


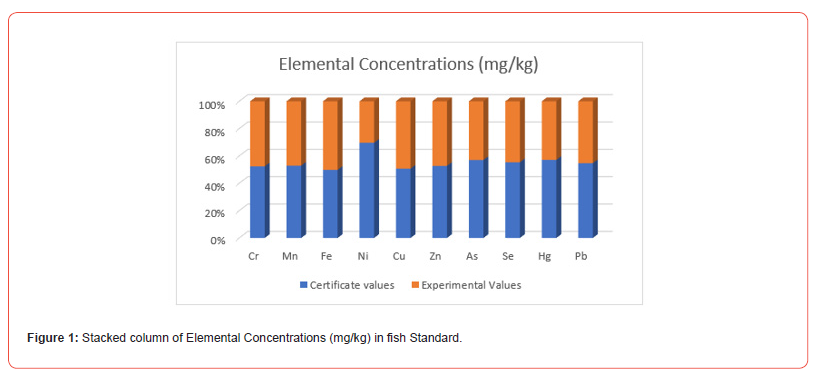
A comparison between the present results and the certified values of the standard (Tort-2) reference materials can be described as follows: The Tort-2 reference material provides certified values for various elements, typically expressed in mg/ kg. The present results are obtained from the EDXRF analysis of the sample. The comparison evaluates how closely the measured concentrations of elements in the sample match the certified values of Tort-2, which serves as a benchmark. This comparison helps assess the accuracy and reliability of the analytical method used for the sample analysis. The differences between the two values can be used to identify potential biases or errors in the calibration or measurement process. Here is the stacked column graph Figure 1 comparing the standard (0.65 mg/kg) and experimental (0.59 mg/ kg) concentrations of Chromium (Cr) in fish standard. We found the result certificate values Mn 13.60 mg/kg and experimental values 12.11mg/kg. Similarly, we got the others elements Fe, Ni, Cu, Zn, As, Se, Hg and Pb respectively. To validate the method, the following parameters are evaluated.
Accuracy and Precision
Accuracy is verified by analyzing reference materials and
comparing results with certified values [12]. Precision analysis
is the process of evaluating the consistency or repeatability of
results obtained from repeated measurements or experiments. In
the context of tuna fish or any scientific measurement, precision
refers to how consistently results can be repeated under the same
conditions. Precision: Reproducibility in repetitive measurements.
Precision is assessed through repeated measurements of the same
sample, ensuring low standard deviation and high reproducibility.
(I) Repetitive measurements (ii) Duplicates (iii) Reference samples
(iv) Control charts. Analyze TORT-2 and compare results with
certified values. Calculate percent recovery using:
% Recovery= (Measured Value /Certified Value) ×100
Precision (Repeatability & Reproducibility). Analyze TORT-
2 multiple times on different days. Calculate Relative Standard
Deviation (RSD %) using:
RSD= (Standard Deviation/ Mean Value) ×100
Typically, RSD ≤ 5% is acceptable.

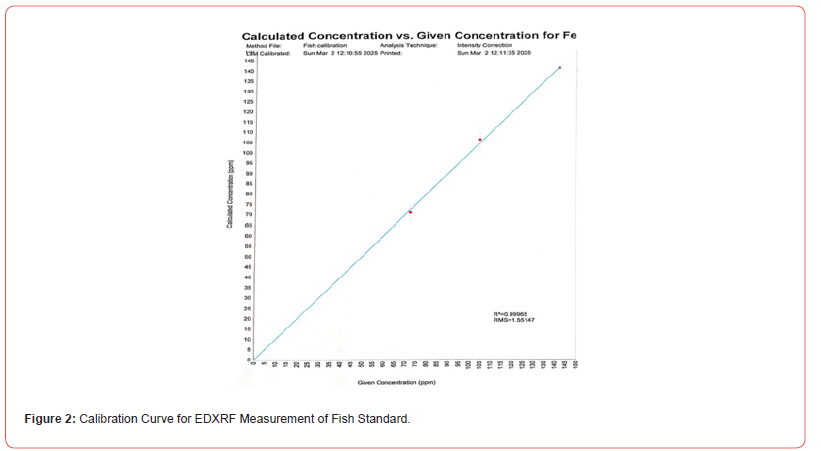
The EDXRF calibration results view shows plots with red data points for each element. Two modes are available: Calculated vs. Given: Plots analysis results for standards as unknowns against known concentrations. Intensity vs. Concentration: Compares measured intensities with known concentrations. These plots help assess calibration accuracy. Calibration corrections are used to manually adjust the slope and intercept values of the calibration. A regression value of 0.99965 likely represents the coefficient of determination (R2) or a correlation coefficient (r) in a statistical model. Here’s what it means: If it is an R2 value: R2measures the proportion of variance in the dependent variable that is explained by the independent variable(s). An R2 of 0.99965 (very close to 1) suggests that the model explains 99.965% of the variance, indicating an excellent fit. If it is a correlation coefficient (r): The correlation coefficient measures the strength and direction of a linear relationship between two variables. An r of 0.99965 suggests an almost perfect positive correlation between the variables. Such a high value is rare in real-world data and may indicate overfitting, measurement bias, or an artificially perfect dataset [13]. The RMS (Root Mean Square) value of 1.55147 typically represents the measure of deviation or error in various contexts, such as: Regression Analysis (RMSE - Root Mean Square Error). If this is the RMSE in a regression model, it indicates the average deviation of predicted values from actual values. A lower RMSE suggests better model performance.
Results and Discussion
Limit of Detection (LOD) and Limit of Quantification (LOQ)
The LOD and LOQ are determined for each element to establish the lowest measurable concentration. These values are optimized by adjusting instrumental parameters like tube voltage, current, and detector settings.
Table 2:Certified Values of Standard (Tort-2) Reference Materials (mg kg-1).

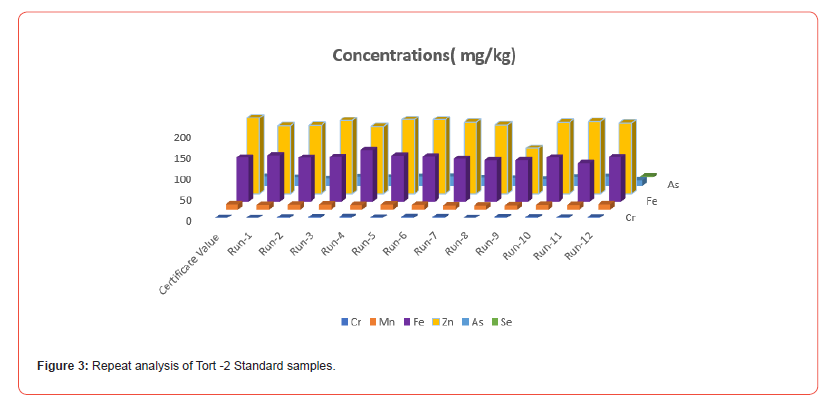
Repeatability in the context of TORT-2 (Tissue Oxidation
Reduction Test-2) refers to the ability to obtain consistent and
reproducible results when the same test is performed under the
same conditions, using identical methodologies and samples. The
concept of “12 times run time standards” could refer to repeating
the TORT-2 test under varying conditions or extended periods.
Repeating a test multiple times ensures that results are consistent
and reliable, especially when trying to account for variability in
environmental conditions, biological response, and equipment
performance. This could also be a standard procedure for ensuring
that the system or method remains stable and that potential outliers
or errors are minimized. In research, having multiple trials can also
assist in understanding the variability of the response of organisms
to contaminants over time [14-15]. By performing the test 12
times, researchers can identify patterns and potential anomalies,
improving the overall robustness of the study.
Determine using:
LOD=3.3× σ/S
LOQ=10×σ /S
where σ = standard deviation of blank and S = slope of
calibration curve.
Prepare a calibration curve with metal standards. Ensure R² >
0.999 for good linearity.
Selectivity and Interference Studies
Matrix effects and spectral interferences are evaluated and corrected using empirical and fundamental parameter-based methods. Software-based corrections are applied to improve measurement accuracy.
Quality control, Quality Assurance and Quality Assessment
Quality control: A system of activities whose purpose is to control the quality of need of users. The aim is to provide quality that is adequate satisfactory and economic.
Quality Assurance: A system of activities to provide the assurance that a product or service meets the defined standards of quality with a stated level of confidence.
Quality Assessment: A system of activities whose purpose is to provide assurance that control is being done effectively [16]. It involves a continuing evaluation of performance of a production /service system and quality of products produced /services provided.
Quality Control (QC) Measures for EDXRF
To ensure continuous analytical reliability, AECD follows strict quality control protocols: Instrument Performance Monitoring. Regular calibration checks are performed using quality control samples (QCS). Detector efficiency and stability are assessed through periodic tests.
Replicate Sample Analysis
Duplicate and triplicate analyses are conducted to ensure
consistency. Standard Deviation in Replicate Measurements.
Sc=So+ K*C
Sc= Standard deviation of replicate analysis
C= Concentration
So and K are constants which define relative’s errors
Relative standard deviation (RSD) is monitored to maintain
data integrity.
Figure 3
Participation in Proficiency Testing (PT)
The laboratory participates in inter-laboratory comparison programs, following international proficiency testing standards. Results from AECD’s EDXRF system are compared with those from other accredited laboratories.
Data Validation and Reporting
Analytical results are validated through statistical evaluation and uncertainty analysis. Data is reported with appropriate correction factors and confidence intervals to ensure reliability. Compare results with regulatory limits (e.g., WHO, FAO, EU standards). Report validated data with uncertainty estimation.

Conclusion
The Chemistry Division of the Atomic Energy Centre, Dhaka has successfully implemented rigorous method validation and quality control measures for EDXRF analysis. The use of certified standards, calibration techniques, and quality control protocols ensures high accuracy and reliability in elemental analysis. The use of TORT-2 and implementing multiple run time standards (e.g., 12 times) in environmental testing provides a reliable foundation for understanding the effects of contaminants on ecosystems. This approach aligns with rigorous scientific methodologies, ensuring the reliability of data, which is critical for environmental health risk assessments. With repeated trials, researchers can develop a deeper understanding of pollution patterns, enhance prediction models, and contribute to more informed decision-making in pollution control and policy development. The division’s adherence to international best practices, IAEA guidelines, further strengthens its analytical capabilities. Moving forward, continuous improvements in instrument calibration, software-based corrections, and interlaboratory comparisons will enhance the robustness of EDXRF at AECD. These advancements will play a vital role in supporting environmental monitoring, industrial applications, and scientific research in Bangladesh.
Acknowledgement
The authors acknowledge the assistance of the staff members of the Atmospheric and Environmental Chemistry Laboratory, Nuclear and Advanced Chemistry Division, Atomic Energy Centre, Dhaka-1000, Bangladesh.
Conflict of Interest
No Conflict of Interest.
References
- E P Bertin (1975) Principles and Practice of X-ray Spectrometric Analysis, 2nd Ed, v, Plenum Press, New York, pp. 571-641.
- R Jenkins (1974) An Introduction to X-Ray Spectrometry, Heyden and Son, New York.
- HA Leibhatsky, G Pleiffer, EH Winshow, PD zemany, X-Rays (1972) Electrons and Analytical Chemistry, Wiley-Interscience, New York.
- E Elad, M Nakamura (1966) J Nucl. Instr. Methods 41: 161.
- HR Bowman (1966) J. Sci 151: 652.
- DA Landis, FS Goudling, BV Jarrett (1972) J. IEEE Trans. Nucl. Sci 101(1): 127-135.
- FS Goulding, DA Landis (1974) Semiconductor Detector Electronics in Nuclear Spectroscopy and reactions, Part A., Academic Press, New York.
- GF Knoll (1971) Radiation Detection and Measurement, John Wiley and Sons. New York.
- EE Haller, FS Goulding (1981) Handbook on Semiconductors, In C. Hilsson (Ed.), Nuclear Radiation detectors, North Holland, Amsterdam Vol. 4.
- E Van Grieken Rene, A Markowicz (Eds.) Andrzej, a Handbook of X-Ray Spectrometry, Chapter VIII.
- Yeasmin N Jolly, Sadia A Surovi, Sheikh M Mizanur Rahman, Jamiul Kabir, Shirin Akter, et al. (2022) Biological Trace Element Research 201(1): 1996-2010.
- AKM Khan (2008) M.Sc. Thesis, Department of Geology, Dhaka University.
- A Islam, YN Jolly (2007) J. Bang. Aca. Sci 31(2): 16.
- G Muller (1969) Geo Journal 2, pp.108.
- C Lin, M He, Y Zhou, W Guo, Z Yang (2008) Enviro. Monit. Asses. 137(1-3): 329-342.
- DL Sparks (2002) Environmental Soil Chemistry (Amsterdam: Academic).
-
Shirin Akter*, Yeasmin N Jolly, Jamiul Kabir, Sushmita Hossain, K M Mamun and M J Abedin. Status Of EDXRF Method Validation and Quality Control in the Chemistry Division of Atomic Energy Centre, Dhaka, Bangladesh. Sci J Research & Rev. 4(3): 2025. SJRR.MS.ID.000589.
Energy Dispersive X-Ray Fluorescence (EDXRF); Precision, Accuracy; Calibration
-

This work is licensed under a Creative Commons Attribution-NonCommercial 4.0 International License.


