


 Review Article
Developing an Asset Management Optimisation Strategy for Very Large Photovoltaic Arrays
Received Date: September 07, 2025; Published Date: September 18, 2025
Abstract
Photovoltaic (PV) systems are playing an increasingly significant role in Australia’s national electricity market. This includes both domestic and large PV arrays. However, there are recognised faults and failures in PV panels impacting the capacity of PV systems, and require asset maintenance to ensure cost-effective means of maximising generation capacity during their operational lifetime. This investigation involves a survey of six 250- Watt PV panels chosen at random from a 6kW PV array in the south-east Queensland region that was completely replaced under warranty after 3.5 year of operation from new. The findings are combined with other global reliability statistics for PV systems, and then used to predict the implications for long term PV array generation capacity losses. An associated asset management review into how best to handle faulty PV panel replacement completed this investigation.
Keywords:PV arrays; PV survey techniques; Reliability; asset management.
Introduction
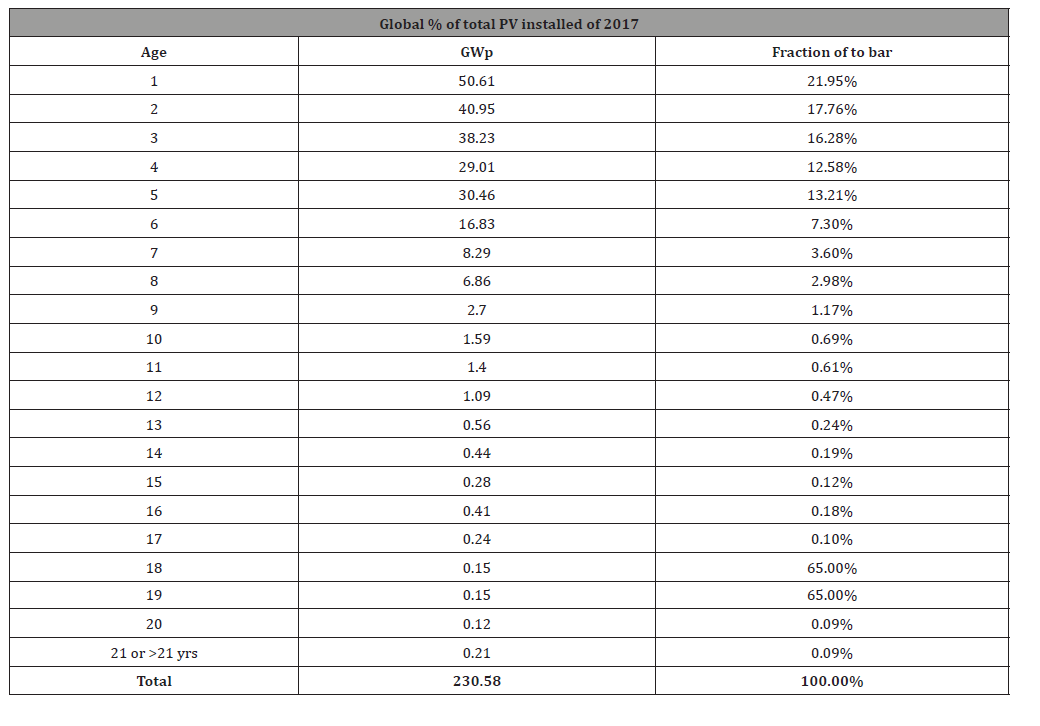
The knowledge that led to PV technology begins in 1839, when Edmond Becquerel discovered that various materials would generate small voltages and currents when exposed to sunlight. Becquerel found while investigating an electrolytic cell made up of two different metal electrodes, that in the presence of light, the electricity output increased with exposure to sunlight. In this instance, what became known as the photo-electric effect accelerated the electro- chemical corrosion rate of the electrolytic cell. However, it was not until 1883 that Charles Fritts coated the semiconductor selenium with a junction of very thin layer of gold to produce electricity from sunlight at a conversion efficiency of 1%. Investigations by Russel Ohl into developing the first transistors, led to modern PV cell being discovered and patented in 1946. Since that time, continuing PV technology steps have produced PV cells of 17 - 18% efficiency currently achieved, as well as multi-junction PV cells now with efficiencies greater than 30%. As reported by Könges M, et al [1] in 2017, since 2007 and as shown in table 1, there has been a near exponential growth in PV system installations.
As more and more PV systems, and especially very large PV arrays come into operation, development of asset management responses is an important function to maximise profit from electrical energy generation. The focus of this investigation was how to recognise fault, failures and fatigue problems in PV arrays, and how then to best manage the asset to provide maximum available capacity to operate profitably. Nilsson [2] reported the importance of minimal failures in PV arrays, particularly as very large arrays over 1 GW are being planned and executed. Such large arrays bring increased complexity to manage in terms of the increased number of PV panels, connections, bypass diode faults and failures in such large arrays. Understanding the impact of issues on very large PV systems’ profitability is one of the key issues to investigate in this study. Defining this both by physical inspection of random warranty sample of PV panels, as well as global statistics available allow modelling investigation into the impacts over lifetime operation. This then helps to determine from outcome consequences, what is the best asset management response to undertake for very large photovoltaic arrays (VLPVA) as they come online.
Table 1: 2017 Installed Global PV Capacity
Issues impacting VLPVA viability
Current Queensland PV and Pumped Hydro Trends
The authors [3] have previously investigated the impacts of energy purchase costs on both pumped hydro-storage systems (PHESS), and deep-see pumped hydro-storage. The conclusions drawn from this was that the only role for PHESS development is greenfield sites near an existing strong HV network backbone, where the lowest CAPEX costs occur. Otherwise due to high CAPEX prices the PHESS is out of normal market range. If the recharge cost for PHESS is free, i.e. it becomes an energy absorber when demand is below system generation capacity, the PHESS will be able to participate at nominally $89/MWh every day within the Australian national electricity market. However, if PHESS energy recharge costs were at $30/MWh during low demand periods, the price required in the NEM peak period market time would have to exceed $103/ MWh, and this would seriously curtail use. Typically, as reported in the CS-Energy 2016-17 Annual report, Wivenhoe Dam’s Split Yard Creek Pumped Hydro only participated in the 3-hour evening peak shaving market in Queensland at a rate of 2.6 - 15.7% annually between financial year 2012/13 to financial year 2016/17. It is only when electricity prices fall to near or below zero for significant period that energy recharge is worthwhile for pumped storage, otherwise the costs are too high to run during load demand peak shaving opportunities. Further development is often discussed, but significant lead times in the upper pondage development and raceway hydraulic head implementation currently hamper development of further pumped hydro-generation resources in Queensland.
Currently, for 2019 to date, Queensland electricity NEM 30-minute average settlement rate tends to average between $45/ MWH during low demand to $95/MWH during higher demand periods [4]. Within the 5-minute period spot AEMO electricity market this tends to be more wide ranging from –$100 (-ve) to $1000/ MWH (-ve) during peak solar PV plant production near midday, to $300/MWH during the evening peak period. [5] Volatility in the Queensland electricity market now appears both at solar PV peak production (around midday) and at peak evening demand times. This is a significant change in the Queensland electricity market in the past two years, when volatility used to only exist in the evening peak demand period.
Thermal Peaking Power Required
As reported in the Australian Energy Council Solar Report January 2018 [6], currently Queensland PV provided nominally 220GWh of annual energy. This equates to 603MWh/ day of the total of the 5.5 - 6.5 GWh of daily Queensland energy use. Significant portions of this energy now must be sold during midday periods as off-peak energy to power switchable supplies such as electric water-heaters. This level of PV energy production equates to nominally 10% penetration in PV in the daily demand profile. For higher penetrations, then peaking power supplies are required, as well as energy storage systems to produce a hybrid renewable generation supply system for a state like Queensland. The purpose of this investigation is to model hybrid gas thermal peaking power gas turbines, PV and energy storage system (ESS) using different battery technologies. Currently, due to the long lead times for significant lead times to develop pumped hydro-storage, electro-chemical stationary batteries are considered for this investigation. Two battery types will be considered, these being the AGM advanced valve-regulated sealed tubular positive plate battery, and the Lithium-ion polymer batteries. For gas turbine technology for peaking (fast response on-line peaking), the U.S. Energy Information Administration (EIO) published night rates are the source document [7] utilised for the cost profiles of 260MW GE peaking power generation units.
Modelling Methodology
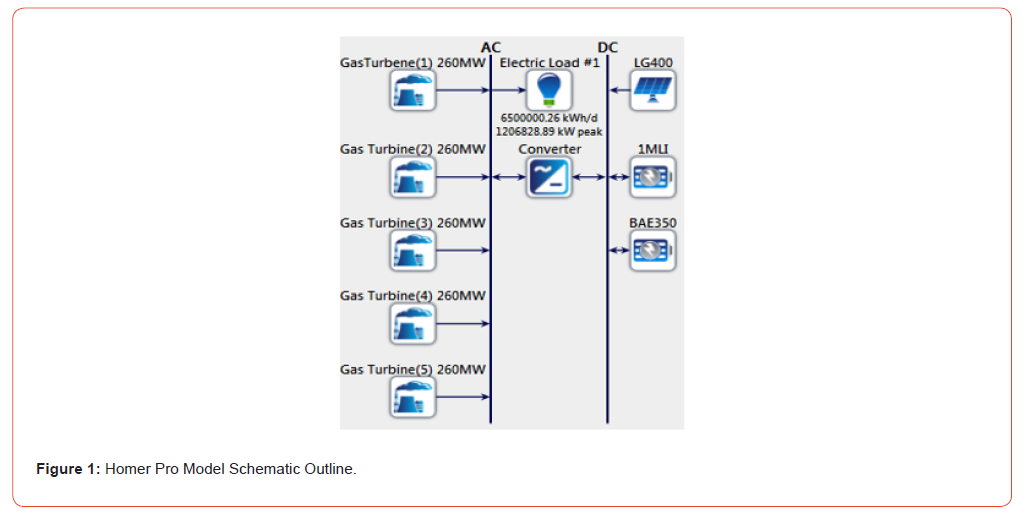
For this investigation, a HOMER Pro ® software model was developed, that allowed for up to 5 peaking 260MW rated gas turbines, with advanced optimise software function was used to determine maximum PV required to meet as much of the Queensland daily demand as possible over a year. An average solar GNI was obtained for Queensland from the NASA weather global database [8]. Battery storage was set to utilise either of the two battery types to compare cost / life implications and $COE of electricity produced. This model outline is shown in figure 1.
The battery types used were a 350Ah AGM sealed VR lead acid battery, and the 1MWh lithium-ion battery. Both battery models are part of the library of HOMER Pro. To further study the impacts of various cost and operational issues, a sensitivity study was undertaken as part of the model analysis. As reported by Helwig and Sahay [9], there are early PV and inverter string failures statistics now available globally. Up to 7% of PV panels can under current production manufacturing outcomes be expected to fail or be seriously compromised within the first five years, and the expected capital replacement life now appears to be degraded 18 years, not the original expected 25 years for earlier generation PV panels. These impacts are also studied as sensitivity life cycle values to see the impact on $COE. Similarly, in Europe and USA, reported inverter life are currently 7.2 - 7.8 years, not the expected 12 - 15 years that was initially promoted by various inverter suppliers.
General Input Cost for Model
For the model, the following general inputs were used based on
the HOMER library, or the US EIO [7] source:
• 260 MW peaking natural gas turbine capital (night) costs of
$1200/KW-yr. rating, with a 30-year full operational life. Note
- in comparison current night costs for advanced coal powered
super-critical thermal generation is $5,084/kw-year for a 50-
year life. This shows the advances in gas turbine technology.
• PV Panels were high quality Korean built, $410 installed per
KW rating, with a 25-year life. A degraded life of 18 years used
for a sensitivity study impact for other lesser quality PV panels.
• Damaged or compromised panel replacement costs of $1,510
/ kW based on supply/transport/labour/travel maintenance
costs in the Australia to semi-remote PV farms.
• Inverter costs were $300/KW rating, with a standard 7.5-year
life based on global trends reported. Efficiency of conversion
was 95% DC to AC, and 75% efficiency for battery charging
(DC – DC or AC-DC depending on the time of day for charging
regime period times.) [9].
• Lithium-Ion battery was costed at $1,200 per kWh storage
installed for a 600V DC bus configuration. Life throughput of
3,000,000 kWh and turn around charge / discharge efficiency
of 90%; a DoD of 80% allowed.
• AGM VRLA battery (positive tubular plate type) costed at
$500 / kWh for storage installed with a 600V DC bus configuration.
Here a fatigue life of 20years to 80% capacity downgrade was based
on 50% allowable DoD, with an 81% turn around efficiency.
Other Cost Point Sensitivity Study Inputs
On the more positive side, as industry optimists predict PV and battery technology costs are expected to drop. Here a sensitivity multiplier value of 0.6 (or 40% drop in price) to be expected is added into the model to determine the impacts of priced drops on future $COE costs. On the negative sensitivity side, if Australia does not develop new gas fields or a gas reserve national policy to keep prices down, a gas price rise of 40% is also included in the model’s sensitivity study. The HOMER model also allows for variability in daily load demand of ±10%, and an hourly time step variation in early/late load change of ±20% for a nominally Queensland daily load demand forecast of 6.5GWh. A 50-year project life was used, as currently Australia is replacing coal thermal power stations which have a similar period operational life.
Results and analysis
The model and sensitivity investigation produce 55Mbyte of data for 813,000 feasible solutions with 30% or more PV generation penetration of daily demand. This was from the 1.5 million permutations and combinations reviewed by the optimising algorithm. Only and extract of these is presented in this paper, specifically regarding lowest $COE (cost of electricity) results. These costs should be compared to the current nominal daily average cost for Queensland of $70/MWh [4].
Case 1 (Benchmark coal to natural gas thermal generation): Using
5 x 260 MW Gas Turbine
• For a gas price of $0.32/m3 yields $129/MWh COE with life
NPC costs of $4.94billion, with a 6.3% excess energy available.
Note turbine daily use on rotation use during non-peak time to
achieve 50-year operation lives.
• For a gas price of $0.64/m3 yield $204/MWh COE with life
NPC costs of $7.74billion, and 6.3% of excess energy available.
Case 2 (Optimistic Case):
o Using 3 x 260MW Peaking natural gas turbines, plus optimised (maximum life) PV generation and optimising battery size for best solar penetration achievable (noting peaking turbine daily use on rotation use during non-peak time to achieve 50-year operation lives):
• Gas price $0.32/m3 yields:
o with 823MWh AGM VRLA ESS achieving a 20-year replacement
life (coupled to 323GW inverter/charger capacity), 698GW of
PV, a 117/MWh COE with life NPC costs of $4.45billion, with a
9.8% excess energy available. A 32.7% PV generation penetration
is the optimal possible.
o with 432MWh Lithium-ion ESS achieving a 15-year replacement
life (coupled to 402GW inverter/charger capacity),
860GW of PV, a 118/MWh COE with life NPC costs of $4.48billion,
with a 23.3% excess energy available. A 30.1% PV generation
penetration is the optimal possible.
• Gas price $0.64/m3 yields:
o With 823MWh AGM VRLA ESS achieving a 20-year replacement
life (coupled to 323GW inverter/charger capacity),
698GW of PV, a $167/MWh COE with life NPC costs of $6.38billion,
with a 9.5% excess energy available. A 33% PV generation
penetration is the optimal possible.
o With 432MWh Lithium-ion ESS achieving a 15-year replacement
life (coupled to 402GW inverter/charger capacity),
860GW of PV, a $165/MWh COE with life NPC costs of $6.29billion,
with a 21.7% excess energy available. A 41.4% PV generation
penetration is the optimal possible.
Case 3 (Pessimistic Case):
1. Using 3 x 260MW Peaking natural gas turbines, plus accounting for early demise at 18-year life for PV generation and optimising battery size for best solar penetration achievable (noting peaking turbine daily use on rotation use during non-peak time to achieve 50-year operation lives):
• Gas price $0.32/m3 yields:
]o with 805MWh AGM VRLA ESS achieving a 20-year replacement
life (coupled to 355GW inverter/charger capacity), 670GW of
PV, a $130/MWh COE with life NPC costs of $4.98billion, with
a 8.1% excess energy available. A 33% PV generation penetration
is the optimal possible.
o With 492MWh Lithium-ion ESS achieving a 15-year replacement
life (coupled to 402GW inverter/charger capacity),
860GW of PV, a $133/MWh COE with life NPC costs of $5.06billion,
with a 7.28% excess energy available. A 30.6% PV generation
penetration is the optimal possible.
• Gas price $0.64/m3 yields:
o With 819MWh AGM VRLA ESS achieving a 20-year replacement
life (coupled to 334GW inverter/charger capacity),
670GW of PV, a $180/MWh COE with life NPC costs of $6.85billion,
with a 7.7% excess energy available. A 33% PV generation
penetration is the optimal possible.
o With 470MWh Lithium-ion ESS achieving a 15-year replacement
life (coupled to 412GW inverter/charger capacity),
796GW of PV, a $183/MWh COE with life NPC costs of $6.96billion,
with a 10.9% excess energy available. A 37.5% PV generation
penetration is the optimal possible.
• Case 4 (Most Optimistic Case):
o Lowest gas pricing, using 3 x 260MW Peaking natural gas turbines, full 25-year life for PV generation and optimising battery size for best solar penetration achievable for 40% reduction in PV and battery costs (noting peaking turbine daily use on rotation use during non-peak time to achieve 50-year operation lives):
• Gas price $0.32/m3 yields:
o With 824MWh AGM VRLA ESS achieving a 20-year replacement
life (coupled to 300GW inverter/charger capacity), 677GW of
PV, a $114/MWh COE with life NPC costs of $4.34billion, with
a 9.48% excess energy available. A 31.7% PV generation penetration
is the optimal possible.
o With 502MWh Lithium-ion ESS achieving a 15-year replacement
life (coupled to 300GW inverter/charger capacity),
692GW of PV, a $117/MWh COE with life NPC costs of $4.45billion,
with a 9.17% excess energy available. A 33.1% PV generation
penetration is the optimal possible.
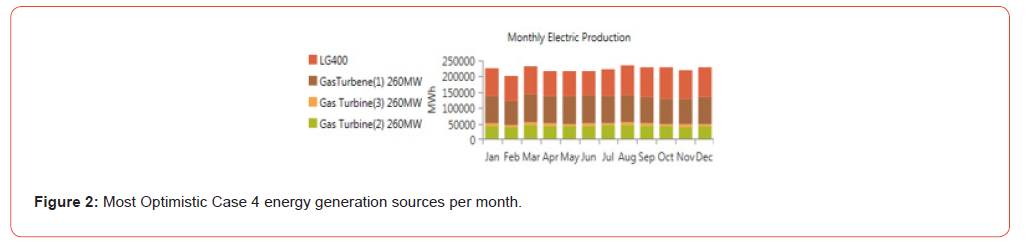
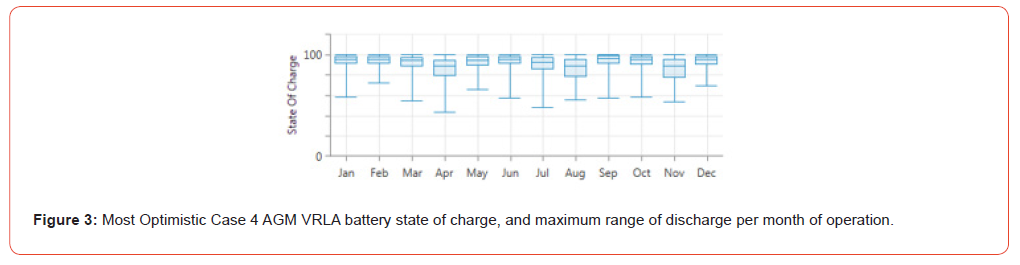
Figure 2 shows the annual split of generation capacity between the PV and the three gas-turbines on a monthly basis, while figure 3 shows the battery general state of charge and the maximum depth of discharge for each month of the annual year. It is noted that the AGM VRLA battery ESS has nominally 1.6 times the energy storage, and its short time current rating for fault ride through is considerably greater. Lead acid battery advanced technology is obviously still in the race for stationary energy storage systems. The AGM VLRA would require short circuit protection, to prevent possible battery internal meltdown / arcing / explosion due to the extreme short time current rating of these batteries under such conditions. The Lithium-Ion battery ESS would require discharge current protection to prevent lithium-ion concentration gradients leading to lithium metal plating in the polymer solid electrolyte (which in turn increases risk of fire). So, there are some safety issues that need further consideration.
The area of concern from this study is though the modelling does show PV generation penetration of 30% or above are possible, the most optimistic case of lowest gas pricing for peaking gas turbine to handle maximum demand conditions in Queensland’s evening, and other days when PV output may be down, and a 40% reductions in cost of batteries and PV panels, the predicted $COE of $114/MWh is still 60% above the current average costs of power from current mix of thermal coal fired power stations and 10% penetration of PV. This however still compares favourably for domestic or remote rural stand-alone power supplies whose costs are $500 - $690 / MWH.
However, power cost rises as increasing PV penetration occurs even in the best case will be the future. It also assumes that Australia will ensure domestic gas prices for onshore energy generation and industrial uses will eventually be sorted out. Lower than current gas prices would help reduce predicted costs from this model. Note, even replacing with a coal fired power station, would not ensure that power prices are held, considering a coal fired power station costs on LCA basis are 2.5 times that of the gas turbine technology. So, the driving influences to maintain current energy costs for future power pricing in Queensland using cleaner gas supplies and renewable energy would require gas prices to be considerable cheaper than current bulk prices for the Australian domestic market (with gas quantity reserved); plus PV and battery energy storage systems would have to significantly drop to an estimated 25-30% of current costs. Significant life improvement is also required due to PV panel early fault failures or Inverter failures, as these will also cause significant disruption in grid reliability based current global reported failure statistics as indications of the future.
Further Considerations
This outline modelling is a reality check of future energy costs for going to renewable energy. This means, particularly for bulk industry-based electricity prices, there will as renewable PV penetration occurs, and the need for quick installation of energy storage systems occurs simultaneously, a great need for domestic bulk gas prices to reduce for energy generation. Similarly, a very significant drop in the costs of PV and batteries is required for Australia to remain competitive in agriculture (for irrigation energy costs) and industrial mineral and food processing / storage / transport etc. Add to this also the potential need for fast charging electric vehicles as a disruptive technology, which if powered directly from the grid will cause significant grid instability.
Further, in this model several resource recovery issues have not been included for end-of-life costs. Disposing and recycling/repurposing in circular economies (i.e. not into landfill) over 5 - 7 billion PV panels, 2.8 - 3 million PV inverters, and over 1,500 GWh of batteries (regardless of technology type) over the next 50 years requires some significant forethought, planning and development of the processes to support. This would be just for Queensland alone. This cost is not yet calculated into the model and is one of the issues with distributed power supplies and our current consumer disposable technology design principles used by industry. Either these costs must be end of life need to quantify and added to demonstrate the impact of renewable energy. Alternatively, there will be a need to develop and adopt ‘perpetual’ engineering design philosophy for longer life inverter electronics, PV panels and batteries that can easily be rebuild needs to be considered for future renewable energy sources. Engineering design for future rebuild, repurposing (through other circular economies) is a future requirement to aspire towards, or there will be a lot of landfills to accommodate from renewable energy and battery storage units.
Conclusion
The world does need better and cleaner energy sources. However, the politics of quick profit and its impact on energy systems design, and design longevity for component life is being compromised with the race for cheaper PV and battery technology in its current form. Why is it not possible to design a PV panel to come apart and be repaired? Why is it not possible to extend inverter design life or repair inverters by preventing cascade failure to main bridge and DC link components? There is also another battery technology to explore, i.e. the nickel-iron Edison battery, which even its current form of 100-year design with little change can be fully and easily rebuilt, as it has no-corrosion issues, is self-limiting in short circuit current and uses abundant iron and nickel crustal element resources, and non-exotic KOH (potassium hydroxide) as an electrolyte. This study indicates the necessity to include this battery type as a third considered possible station application ESS, and to be reported in the future.
Also, if Australia chooses to take up advanced gas turbine technology, many parts of Australia due to temperature extremes will also need intercooler inlet air temperature regulation to ensure turbine efficiency. These costs will have to be accounted for in both parasitic energy costs, but also CAPEX costs. Further for such a system as this, then fault ride through capability of such hybrid renewable energy systems required further dynamic studies to see how response time in Queensland would work during thunderstorm and cyclone potential disruption. Similarly looking at load stepping grid disruption is another priority for further work, should electric vehicles become established in the south-east Queensland area around the North Coast to Brisbane to the state border below the south coast.
There are significant engineering challenges in maintaining current energy costs in Australia for future competitiveness in agricultural and processing industries, not to mention for maintaining potable water, sewerage and essential utility service reliability that our Australian lifestyle has become used to. These are not insurmountable, but a better systems approach is required for increasing renewable energy penetration, while reducing environmental impact footprint. The current headlong tilt into ‘cheap’ renewable resources may not be the best approach to achieve future societal sustainability improvement while maintaining energy security and affordability.
Acknowledgements
None.
Conflict of interest
No conflict of interest.
References
- Kai Swaboda (2019) Energy prices - the story behind rising costs, Parliament of Australia.
- J Flauger (2018) Power price hikes shock Germany’s Mittelstand, www.handelsblat.com.
- A Helwig, A Sahay (2018) Will Pumped-Hydro Energy Storage Business Models Work for Peak Shaving Use? AUPEC.
- (2019) AEMO.
- (2019) AEMO.
- (2018) Australian Energy Council, Solar Report.
- (2016) US Energy Information Administration, Capital Cost Estimates for Utility Scale Electricity Generating Plants, U.S. Department of Energy, Washington.
- (2019) NASA, Surface Solar Energy Data Set.
- (2019) A Helwig, A Sahay, Tropical Island Community PV Development Challenges and Opportunities, International Symposium on Renewable Energy, Environment and Climate Change, Fiji University.
-

This work is licensed under a Creative Commons Attribution-NonCommercial 4.0 International License.