 Research Article
Intelligence of Children with Repaired Cleft Palate: A Retrospective Chart Review Study
Benjamin Becker1, Bailey Harvey1, Sue Ann S Lee2* and Joshua Demke3
1School of Medicine, Texas Tech University Health Sciences Center, Lubbock, TX
2PhD Program in Rehabilitation Science, Texas Tech University Health Sciences Center, Lubbock, TX
3Department of Otolaryngology, School of Medicine, Texas Tech University Health Sciences Center, Lubbock, TX
Sue Ann S. Lee, Ph.D., CCC-SLP, Professor, Department of Speech-Language-Hearing Sciences, Ph.D. program in Rehabilitation Science, Texas Tech University Health Sciences Center, USA.
Received Date:April 04, 2022; Published Date:April 29, 2022
Abstract
Cleft deformities have known detrimental effects on affected individuals, including physical, psychological, and intellectual in nature. The goal of this study was to examine intelligence amongst patients diagnosed with and treated for CL/P. A total of 115 medical charts of patients between ages 3 and 18 years old were screened and reviewed in this retrospective study for their TONI/PTONI scores. Intelligence scores were compared by gender, race, urban versus rural hometown, cleft type, and speech therapy (ST). The mean TONI/PTONI scores were higher in females, in patients who lived in urban areas, patients diagnosed with unilateral incomplete cleft, those who received ST, and those of Asian descent, though these differences were statistically insignificant. This data may provide useful information for prognosis of communication skills and their academic success and providing individualized care in patients with repaired cleft palate. Further research using a larger sample size is warranted in order to prove statistical significance and make an application to the broad population.
Keywords: Nonverbal Intelligence; Children with cleft palate
Introduction
Cleft lip with or without palate (CL/P) and isolated cleft palate without cleft lip or cleft palate only (CPO) are two distinct forms of birth anomalies affecting the oromaxillary and oropharyngeal anatomy and function. It has been previously identified that the incidence of a cleft lip with or without cleft palate is about 1:1000 and isolated cleft palate is about 1:2500 [1]. Cause of these abnormalities are mostly associated with other genetic diseases or congenital abnormalities, common ones including velocardiofacial, Alpert, and CHARGE syndromes, but there have also been genetic correlations observed [2-4]. Even pre-congenital environmental factors, including inadequate vitamins, maternal smoking, and diabetes, increase risk for clefts to develop [5-7].
Research has shown that the incidence of both CL/P and CPO vary by sex. According to the World Health Organization, maleto- female ratio affected by a non-syndromic cleft palate only (CPO) is 0.93 [8]. The nature of female sex hormones as well as the later embryologic closing of the female palate both pose increased risk for CPO [8-11]. It has also been suggested that X-chromosome inactivation enhances CL/P formation, even though most inheritance patterns appear X-linked recessive or autosomal dominant [12, 13].
CL/P incidence also varies across racial profiles. Mossey, et al. [14] previously noted that there is increased risk for oral clefts in Asians and lowest rates in Africans. In a more recent study in the United States, Mai, et al. [15] reported that CL/P was greatest in non-Hispanic whites, followed by American Indians/Alaskan Natives, Hispanics, Asians/Pacific Islanders, and lastly smallest for non-Hispanic blacks, though only 29 states were involved. These differences may be explained by the fact that Asians have smaller nasal processes and facial features, compared to Africans, which have broader, larger frontal nasal processes and palates [16, 17]. CL/P incidence differs in terms of sex, but the rate is similar across races. Cleft lip with or without cleft palate is more frequent in males while cleft palate is more frequent in females [14].
Cleft defects inevitably have numerous physical, cognitive, and psychological adverse effects. Intelligence or Intelligence Quotient (IQ) is one of the common psychological measures in children to identify normal cognitive development. One of the long standing questions about cleft palate is whether children with CL/P and CPO demonstrate similar intelligence compared to typically developing peers; thus, these children become normally functioning adults. The majority of studies examining IQ in children with CL/P were done in 1950s-60s in the United States. These studies reported that IQ of children with CL/P was below that of the general population [18-22] or lower than the control group [23-24]. In their review, Richman and Eliason [25] criticized these previous studies and noted that these earlier studies did not include noncleft control groups, used several different measures of intelligence within a study, or IQ of children with CL/P were within normal limit although they were lower than a control group. Richman and Eliason concluded that there may be a slight decrease in verbal intelligence related to the cleft condition while nonverbal intelligence appear to be normally distributed.
Intelligence of children with cleft palate is, however, still controversial. Intelligence deficit in children with CL/P is still reported in other countries while IQ within the normal range is also reported simultaneously. Niemann and Gover [26] reported that a group of German children with CL and palate showed a general average IQ of 106.6, which is within normal range. However, Swellen, et al. [27] examined 37 Velocardiofacial syndrome in Belgium and reported that 55% of the children had a borderline to normal IQ, but 45% of the children had an IQ 2SDs below the mean. Chen, Chen, Wu, and Zhang [28] also examined IQ and developmental quotient of 152 children with CP who were under 14 years of age. As compared to 80 healthy children, they found that the mean value of IQ in children with CP was significantly lower than the control group. Children with CL or CP showed higher IQ than children with both CP and CL. Children with II deformity were higher than that of children with III deformity. Children who were fed with breast milk showed higher IQ than those who were fed with commercial milk. Cognitive dysfunction continues to appear in adult speakers. Nopulos and colleagues [29] examined cognition in 50 adults with oral clefts. Compared to age matched controls, participants with oral clefts had significantly lower IQ.
Subsequent studies revealed which factors were related to IQ of children with CP. Lamb, Wilson, and Leeper [30] examined 73 children with CL/P between five and 16 years of age and reported no significant difference between types of cleft palate. In other words, children with CL and/or CP and children with both CL and CP had a similar IQ. Furthermore, sex and SES (Socioeconomic Status) were not different between the two groups of cleft type.
Hentges, et al. [31] conducted two studies examining the effect of early vs. late lip repair in children with cleft lip. Children with late lip repair done at 3 months old had significantly poorer cognitive development at 18 months than a group of children without cleft lip. However, children with early lip repair showed no cognitive delay. These differences were caused by the quality of early motherinfant interactions. In a subsequent study, they followed up 93 children (44 early and 49 late repair) at 7 years of age and found that children with late lip repair showed significantly lower scores on cognitive development as compared to the other groups. Social interactions in the first few months may be crucial for child cognitive development, emphasizing the need for early interventions for mother and infant relationship. Unlike Hentges et al., recently, Petrachoval and colleagues [32] examined whether early and late operation of cleft lip affects IQ in children with cleft palate who are 3 to 7 years of age and found no significant difference between early and late repair groups. They only examined small number of children (either 15 or 17). Early repair was done within the first 8 days of life and late repair was done between 3 and 10 months.
In summary, it is not still certain whether children with repaired CL/P demonstrate similar or lower IQ compared to peers. In addition, to our knowledge, there is no previous research published that compares intelligence in children treated for CL/P to children’s race or size of the hometown, especially in rural vs urban areas. Therefore, the goal of this retrospective review was to observe IQ in children with CL/P in terms of gender, race, ethnicity, size of hometown, type and severity of cleft, and receival of speech therapy (ST) to obtain a better understanding of patient profile and to make a better prognosis of the patient communication ability and academic success.
Methods
Participants
Participants in this retrospective study were based on the medical records of children who were admitted and treated in the Cleft Palate Clinic at the Texas Tech University Health Sciences Center (TTUHSC), a clinic that provides aid and treatment to children of all ages. Prior to collecting data from the medical records, approval was granted by the Institutional Review Board (IRB) (IRB #L20-141). Note that all patients were anonymized and strictly referred to as randomly generated numerical values.
Medical charts of children who were enrolled in the Cleft Palate Clinic were obtained from the electronic medical record (EMR). Primary inclusion criteria were a) children who visited the TTUHSC Cleft Palate Clinic between January 1, 2013 and March 1, 2020; b) children between ages 3-18 years old who had been diagnosed and treated for a cleft deformity; c) recipients of intelligence testing.
A computer algorithm and methods of data extraction were utilized to narrow the medical records to a population who met the inclusion criteria. A total of 115 children between the ages of 3-18 years initially qualified. These medical records were then individually reviewed for intelligence testing. After screening for this variable, among the 115 children, a total of 67 children had the TONI/PTONI scores. A further analysis of age distribution can be seen below, in which patients were stratified into the appropriate age-range at which they completed their IQ testing (see Table 1).
IQ Measurement
Intelligence was determined based on scores from an IQ test which the children were given after receiving surgical treatment for their cleft deformity. The primary test utilized and documented in the medical records of the patient population was the Test of Nonverbal Intelligence (TONI), also referred as the Primary Test of Nonverbal Intelligence (PTONI) (TONI/PTONI) [33]. This test requires children to identify pictures on pages that are dissimilar to other images on the same page, with a gradual increase in difficulty from simple visual and spatial recognition to advanced reasoning skills. For those that received a TONI/PTONI test, the numerical TONI/PTONI scores were recorded. Those who did not receive the test or had no record of receiving the test were excluded. Patients who had received the TONI/PTONI test multiple times were only noted for their most recent TONI/PTONI score.
Data Analysis
To understand the patient profiles more comprehensively, secondary medical conditions were identified. Medical conditions that fulfilled this criterion were those that have shown evidence in leading or contributing to the development of a CL/P. Diagnoses that did not lead to the development of a CL/P were excluded. Patients’ auditory status was also identified. The hearing loss was identified based on the tympanogram test results. Patients were stratified into three categories based on their status: normal hearing bilaterally (type A bilaterally), normal hearing unilaterally (type A unilateral and type B or C unilaterally), and abnormal hearing bilaterally (type B bilaterally, type C bilaterally, or type B unilaterally and C unilaterally).
The participants’ IQ was analyzed in terms of several demographics such as sex, race and size of hometown (urban versus rural), which we refer to as “urbanicity”. Rural, as defined by the United States Census Bureau, was defined as population less than 50,000, whereas urban was defined as greater than or equal to 50,000 [34]. The medical records were also analyzed in terms of types of cleft palate and speech therapy (ST).
Clefts were documented in this review based on what was diagnosed and recorded in each medical chart. Clefts were classified based on region [Cleft Lip only (CL), Cleft Palate only (CPO), or both Cleft Lip and Palate (CLP)], laterality [unilateral or bilateral], and anatomical involvement [complete versus incomplete]. Note that patients were only diagnosed and recorded as having only a bifid uvula. These categories of diagnoses would then be compared to TONI/PTONI scores. In addition, information regarding the year of and when the patient received treatment for the CL/P was recorded.
Medical charts were also reviewed for children who did and did not receive ST. Due to the variability of different ST regimens, our sample population was classified as either having received treatment at any point versus those who had never received any form of ST. All of these variables would be compared to their respective TONI/PTONI values.
Statistical Analysis
The mean TONI/PTONI score for each cohort was the dependent variable. Several independent variables included sex (female vs. male), urbanicity (urban vs. rural), type of cleft diagnosis (bilateral CL/P, unilateral complete CL/P, CPO, unilateral incomplete CL/P), and usage of ST (utilized vs. did not utilize). Independent t-tests were utilized for statistical comparison of the TONI/PTONI scores for sex, urbanicity, and speech therapy and Analysis of Variance (ANOVA) was adopted for cleft type using Statistical Product and Service Solutions (SPSS) (v.26) software. A significance level of p < 0.05 was adopted.
Results
Age distribution of participants
As mentioned above, a total of 67 patients qualified for this study. Table 1 shows the age distribution of participants who received a TONI/PTONI score. A majority of our sample population completed IQ testing when aged 6-11 years old (64.18%) (Table 1).
Table 1:Age group distribution and percentage of total study population.

Secondary medical conditions and hearing loss of participants/
A very small portion of the study population was found to have a qualifying secondary medical condition. Those which we encountered include: Pierre-Robin sequence (3 patients), DiGeorge Syndrome (2 patients), Velocardiofacial Syndrome (1 patient), VACTERL syndrome (1 patient), Auriculocondylar Syndrome (1 patient), Goldenhar syndrome (1 patient), and Turner Syndrome (1 patient).
Two patients were excluded from hearing loss analysis due to inadequate information provided in the EMR. From our compilation of TM statuses, those who exhibited normal hearing bilaterally totaled 28 individuals (42%). Patients who experienced normal hearing unilaterally totaled 15 (21%), and those with abnormal hearing bilaterally equaled 25 (37%).
TONI/PTONI scores and sex
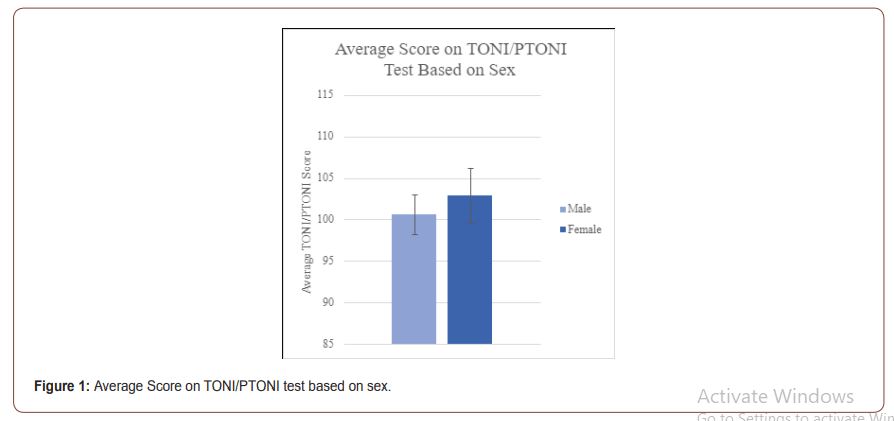
Figure 1 shows the intelligence scores by gender. A total of 40 males and 27 females were recorded. The mean and standard deviation for males was 100.6 (SD=14.96) whereas those for females were 102.9 (SD=25.4). Independent t-test found no significant difference on the nonverbal IQ between the two groups (t (65) = -.81, p = .42) (Figure 1).
TONI/PTONI scores and race
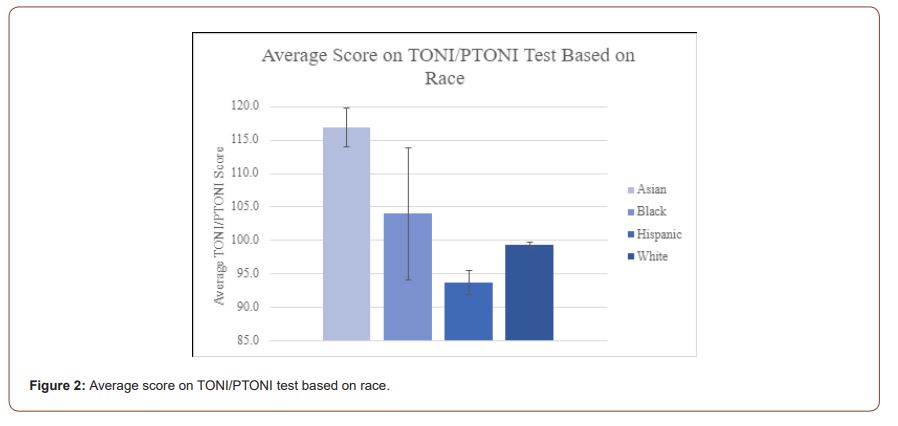
Figure 2 shows TONI/PTONI scores for each race. The mean IQ for Asian was 116.8 (6 patients). For other races, 104.0 was for Black (2 patients), 93.7 for Hispanic (6 patients), 99.3 for White (52 patients). Due to the small cohorts of other races than white, no statistical analysis was made (Figure 2).
TONI/PTONI scores and urbanicity
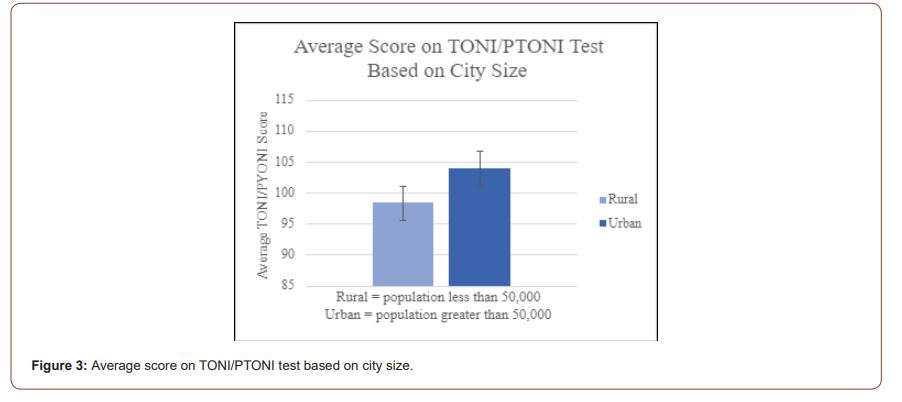
Figure 3 shows intelligence scores by urbanicity (population of urban area > 50,000). A total of 37 patients resided in urban areas while 30 resided in rural areas. The mean IQ for urban residents was 104 (SD=16.93), and that for rural residents was 98.4 (SD=21.82). The independent t-test shows that the children who resided in urban areas had marginally higher IQ than children in rural areas (t (65) = 1.88, p = .065) (Figure 3).
TONI/PTONI scores and cleft types
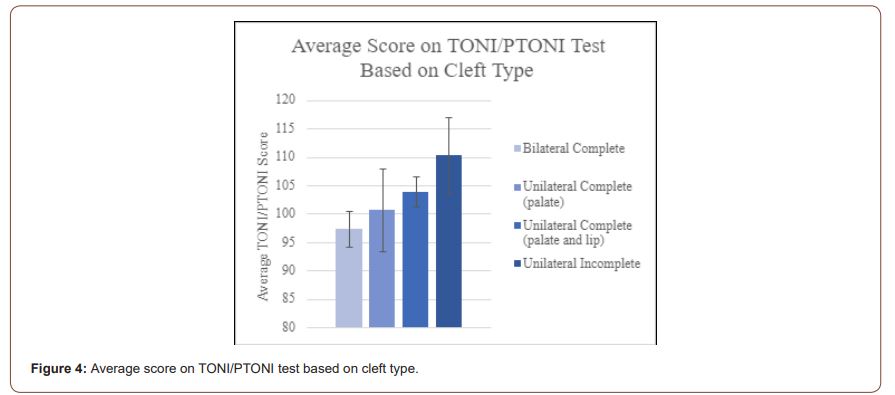
Figure 4 shows intelligence scores by differences in cleft diagnoses. The mean IQ for the four diagnoses were: A). 97.3 (SD = 13.1) for bilateral complete CLP - 17 patients B). 103.9 (SD = 22.2) for unilateral complete CLP – 28 patients C). 100.5 (SD = 20.5) for unilateral complete CPO – 8 patients D). 110.3 (SD = 20.0) for unilateral incomplete CL/P – 9 patients. The children with bilateral complete had the highest IQ whereas the children with unilateral incomplete had the lowest IQ. However, their IQ among the four groups were not significantly different from each other (F (3, 29) = 1.25, p = .282) (Figure 4).
TONI/PTONI scores and speech therapy (ST)
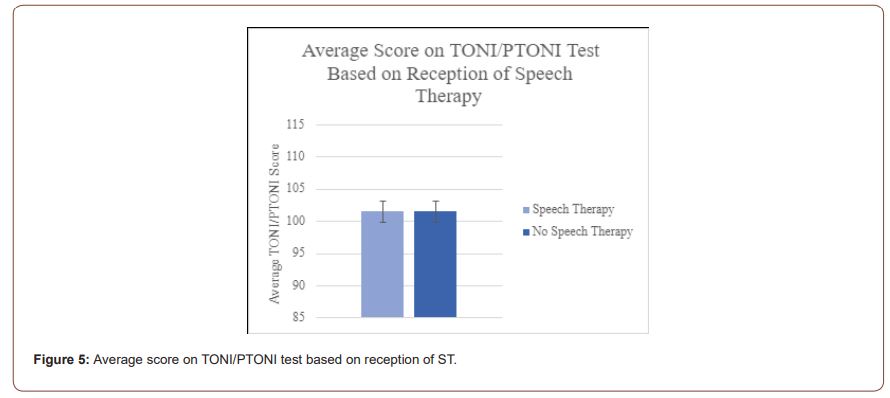
Figure 5 shows intelligence scores for those patients who received ST (27 patients) and those who did not receive ST (38 patients). The mean IQ for children who received ST was 101.53 (SD=16.56) whereas that of children who did not receive ST was 97.75 (SD=23.39). An independent t-test found no statistical significance in their IQs between the two groups (t (65) = 0.79, p = .428) (Figure 5).
Discussion
The focus of this study was to explore nonverbal IQ of children (ages 3-18 years old) with repaired CP in the West Texas and New Mexico areas serviced by the TTUHSC Cleft Palate Clinic. The current study found marginal effects of CL/P on intelligence factors in this patient population. To our knowledge, this study is the first of its kind to investigate the effects of CL/P on children’s non-verbal IQ in the West Texas and New Mexico pediatric patient population. The findings of this study provided helpful resource to the cleft palate team in the US.
Secondary medical conditions and hearing Loss
The small frequency of encounters of secondary medical conditions that lead to CL/P can be attributed to the fact that our subject population was limited in size, and due to the rarity of these conditions within the world population. When addressing hearing loss, we encountered more patients with abnormal hearing than normal hearing. This should be expected in patients with CL/P, when compared to the general population, due to higher likelihood of experiencing significant anatomical changes within the skull.
Sex
Numerically, the female category had a mean TONI/PTONI score greater than males. When testing our hypothesis surrounding male and female average TONI/PTONI scores, we found that there was no statistical difference between the cohorts average scores, and thus we had to accept the null hypothesis. Of note is the large difference in standard deviation and standard error of the mean between the two cohorts which most likely resulted from the difference in the size of the two patient populations (40 males to 27 females).
Race
Numerically, our results yielded that the Asian population had higher TONI/PTONI scores, followed by Black, Hispanic, and White patients, which disagrees with the data from Mossey, et al. and Mai, et al. [8, 15] However, we anticipated that this data would be statically insignificant due to the limited sample size and distribution, and therefore we refrained from performing any statistical analyses and making any definite conclusions.
Urbanicity
Numerical data revealed that the urban patient population had a higher TONI/PTONI score compared to the rural category, which could be explained by the fact that urban environments have access to more resources than rural regions. When testing our hypothesis surrounding urban and rural children’s average TONI/PTONI scores, we found no statistical difference between the cohort’s average scores, and thus we had to accept the null hypothesis. This cohort split displayed the largest difference between average TONI/PTONI scores (Urban = 104.00 and Rural = 95.10) plus the lowest standard deviation and standard error of the mean between the two groups, giving this cohort split the greatest chance of showing statistical significance. However, the difference between the two groups’ average TONI/PTONI scores, coupled with the large standard deviation displayed in the rural patient population, ultimately contributed to the data displaying no statistical significance between urban and rural children’s average TONI/PTONI scores. Perhaps with a larger sample size, we may have been able to see some statistical significance between the average scores.
Cleft types
Numerically, it was determined that the unilateral incomplete CL/P group had the highest TONI/PTONI score, followed by the CPO, unilateral complete CLP, and bilateral complete CLP with the lowest score. However, when testing our hypothesis surrounding cleft types and average TONI/PTONI score, we found that there was no statistical difference between the cohorts’ average scores, and so we had to accept the null hypothesis. Between the groups, the data displayed a predictable pattern: that those with less severe cleft types (e.g., unilateral incomplete clefts), on average, scored higher than those with more severe cleft types (e.g., bilateral complete clefts), but this was unable to be rendered statistically significant. We believe, similarly to urbanicity, that given a large enough sample size, that statistical differences may be shown to occur between patients with varying degrees of cleft type severity.
Speech therapy
The numerical calculations revealed that those who did not receive ST had a greater TONI/PTONI score compared to those who did not received ST, and the standard deviation was smaller in the non-ST group. When testing our hypothesis surrounding patients who received ST and their average TONI/PTONI scores, we found that there was no statistical difference between the cohorts’ average TONI/PTONI scores, so we were forced to accept the null hypothesis. The average between the two groups displayed a difference of less than 1 point, and thus had a small likelihood of demonstrating statistical significance. One of the contributing factors to this groups small difference between average TONI/ PTONI scores may be due to the reason for obtaining or abstaining from ST.
The numerical data may be explained due to the fact that some patients may not have had the resources to engage in ST, which may have rendered some children with a worse TONI/PTONI score, since they may have required ST for greater cognitive development. This may have drawn the mean TONI/PTONI score down for the group who did not engage in ST. On the other hand, some children who did not engage in ST may have not needed ST to begin with, which would have drawn the average TONI/PTONI score higher for the cohort who did not receive ST. Lastly, some patients who engaged in ST may have experienced the benefits of ST on their cognitive development, which would have drawn the average TONI/PTONI score higher for the group who received ST. These various effects on the average TONI/PTONI score between the two groups who received or did not receive ST may have ultimately brought the two averages together, which is why there was so little difference between the two group’s means.
Conclusion
The information gathered from this retrospective review concludes that there are no statistical differences in intelligence within the gender, hometown size, cleft severity, ST, and race categories, albeit there were numerical differences. Quantitatively, intelligence was slightly greater in female patients, those who resided in an urban environment, those diagnosed with a unilateral incomplete cleft, those who received ST, and those of Asian descent. This information will be useful when providing care to patients who have been diagnosed with a CL/P by identifying the groups of people who tend to have lower intelligence levels, and ensuring that high quality care is provided to those populations. Further research involving a larger sample population must be conducted to reduce risk of statistical error and ultimately make definite conclusions.
Acknowledgement
None.
Conflict of Interest
No conflict of interest.
References
- Parker SE (2010) Updated national birth prevalence estimates for selected birth defects in the United States, 2004–2006. Birth Defects Res A Clin Mol Teratol 88(12): 1008-1016.
- Wong F, U Hägg (2004) An update on the aetiology of orofacial clefts. Hong Kong Medical Journal 10(5): 331-336.
- Burg ML (2016) Epidemiology, Etiology, and Treatment of Isolated Cleft Palate. Front Physiol 7:67.
- Goudy S, L Buckmiller (2014) Genetics, prenatal diagnosis and counseling, and feeding, in Complete cleft care: cleft and velopharyngeal insufficiency treatment in children P: 1-10.
- Honein MA (2007) Maternal Smoking and Environmental Tobacco Smoke Exposure and the Risk of Orofacial Clefts. Epidemiology 18(2): 226-233.
- Wong WY (1999) Nonsyndromic orofacial clefts: association with maternal hyperhomocysteinemia. Teratology 60(5): 253-257.
- Correa A (2008) Diabetes mellitus and birth defects. Am J Obstet Gynecol 199(3): 237. e1-237. e9.
- Mossey PA, EE Catilla (2003) Global registry and database on craniofacial anomalies: Report of a WHO Registry Meeting on Craniofacial Anomalies.
- Ross RB, Cleft lip and palate [by] RB Ross [and] MC Johnston With contributions by WK Lindsay [and] MO Hamlen, and in consultation with JD Niswander (Ed.) MC Johnston. 1972, Baltimore: Williams & Wilkins.
- Miura S, N Natsume, T Kawai (1989) Preventive effects of estradiol on cleft lip and/or palate in mice. Plast Reconstr Surg 84(5): 852-853.
- Burdi AR, RG Silvey (1969) Sexual differences in closure of the human palatal shelves. Cleft palate j 6(1): 1-7.
- Stanier P, GE Moore (2004) Genetics of cleft lip and palate: syndromic genes contribute to the incidence of non-syndromic clefts. Hum Mol Genet 13(suppl_1): R73-R81.
- Jugessur A (2012) X-linked genes and risk of orofacial clefts: evidence from two population-based studies in Scandinavia. PloS One 7(6): e39240.
- Mossey PA (2009) Cleft lip and palate. Lancet 374(9703): 1773-1785.
- Mai CT (2014) Birth defects data from population-based birth defects surveillance programs in the United States, 2007 to 2011: highlighting orofacial clefts. Birth Defects Res A Clin Mol Teratol 100(11): 895-904.
- Eppley BL (2005) The spectrum of orofacial clefting. Plastic and reconstructive surgery115(7): 101e-114e.
- Setó Salvia N, P Stanier (2014) Genetics of cleft lip and/or cleft palate: association with other common anomalies. European journal of medical genetics 57(8): 381-393.
- Billing AL (1951) A psychological appraisal of cleft palate patients Procedures of Pennsylvania Academy of Science 29: 31.
- Munson S, May A (1955) Are cleft palate persons of subnormal intelligence? Education Research Journal 48: 617-622
- Lewis R (1971) Survey of the intelligence of cleft lip and cleft palate children in Ontario. Br J Disord Commun 6: 17-25.
- R E Estes, Morris, H L (1970) Relationships among intelligence, speech proficiency and hearing sensitivity in children with cleft palates. Cleft Palate J 7: 763-773.
- Mrans B J, Irwin J An analysis of certain measures of intelligence and hearing in a sample of the Wisconsin cleft palate population. Cleft Palate Bull 4: 4.
- Goodstein LD (1969) Intellectual impairment in children with cleft palates. Journal of Speech & Hearing Research 4: 287-294.
- Smith R, McWilliams BJ (1968) Psycholinguistic abilities of children with clefts. Cleft Palate J 5: 238-249.
- Richman LC, Eliason M (1982) Psychological characteristics of children with cleft lip and palate: intellectual, achievement, behavioral and personality variables. Cleft Palate J 19(4): 249-257.
- Niermann W, Goyer K (1981) Intelligence in children with cleft lip and palate. Z Plast Chir 5(4): 218-227.
- Swillen A, Devriendt K, Legius E, Eyskens B, Dumoulin M, et al. (1997) Intelligence and psychosocial adjustment in velocardiofacial syndrome: a study of 37 children and adolescents with VCFS. J Med Genet 34(6): 453-458.
- Chen Z, Chen J, Wu J, Zhang X (2001) Factors involved in intelligent development of children with cleft lip and palate. Hua Xi Kou Qiang Yi Xue Za Zhi 19(3): 174-177.
- Nopoulos P, Berg S, VanDemark D, Richman L, Canady J, et al. (2002) Cognitive dysfunction in adult males with non-syndromic clefts of the lip and/or palate. Neuropsychologia 40(12): 2178-284.
- Lams M, Wirsox, FB, Leeper HA (1972) A comparison of selected cleft palate children and their siblings on the variables of intelligence, hearing loss and visualperceptual-motor abilities. Cleft Palate J 9: 218-228.
- Hentges F, Hill J, Bishop DV, Goodacre T, Moss T, et al. (2011) The effect of cleft lip on cognitive development in school-aged children: a paradigm for examining sensitive period effects. J Child Psychol Psychiatry 52(6): 704-712.
- Petráčková I, Zach J, Borský J, Černý M, Hacklová R, et al. (2015) Early and late operation of cleft lip and intelligence quotient and psychosocial development in 3-7 years. Early Hum Dev 91(2): 149-152.
- Ehrler DJ, RL McGhee (2008) PTONI: Primary test of nonverbal intelligence. Pro-ed Austin, TX.
- Ratcliffe M (2016) Defining Rural at the U.S. Census Bureau: American Community Survey and Geography Brief.
-
Benjamin Becker, Bailey Harvey, Sue Ann S Lee and Joshua Demke. Intelligence of Children with Repaired Cleft Palate: A Retrospective Chart Review Study. On J Otolaryngol & Rhinol. 5(3): 2022. OJOR.MS.ID.000615.
-
Cleft palate, Oropharyngeal anatomy, Nasal processes, Facial features, Velocardiofacial syndrome, Hearing loss, Speech therapy, Cleft lip, Maternal smoking, Frontal nasal processes.
-

This work is licensed under a Creative Commons Attribution-NonCommercial 4.0 International License.


