 Research Article
Loblolly Pine and Shortleaf Pine Hybridization Analysis Using Chromatography and Geographic Information Systems: A Case Study in East Texas
Gary R White Jr, Brian P Oswald*, Katheryn R Kidd and I Kuai Hung
Arthur Temple College of Forestry and Agriculture, Stephen F. Austin State University, Nacogdoches, Texas USA
Brian P Oswald, Arthur Temple College of Forestry and Agriculture, Stephen F. Austin State University, Nacogdoches, Texas, USA.
Received Date: July 17, 2023; Published Date: July 28, 2023
Abstract
The spatial quantification of hybridization is of growing interest as southern United States pine forests come under greater influence of improved pine genetics in the face of the warmer, drier conditions from climate change. High Performance Liquid Chromatography (HPLC) and spatial interpolation using the Inverse Distance Weighted method were conducted using extracted terpenes derived from foliar tissue of shortleaf pine (Pinus echinata), loblolly pine (Pinus taeda), and putative hybrids of a sample of 24 individuals (14 overstory and 10 advanced regeneration individuals) sampled on a north to south gradient in East Texas. Chromatograms were obtained and 14 peaks representing terpene constituents were measured for peak intensity. T-Tests indicated no significant differences for peak intensity between forest strata. Two-way ANOVA tests indicated that the site variable was significant for six peaks, the species class variable was significant for five peaks, and the interaction of site and species class was significant for one peak. Tukey HSD tests indicated that the comparison of shortleaf pine to shortleaf x loblolly pine was the most consistently significant. From spatial interpolation of peak intensities, both north-south and west-east variations in chemical composition were realized. A pattern of species differentiation at the population scale and individual responses to environmental stressors is implied. Knowledge of spatial patterns of species identity and individual resiliency to environmental stressors is valuable for the sustainable management of forests in the face of rapidly changing forest genetic compositions and climatic conditions.
Keywords:Hybridization; Shortleaf pine; Loblolly pine; Climate change; Chromatography
Abbreviations:ASP: Atlanta State Park; MTSP: Mission Tejas State Park; TSP: Tyler State Park; IDW: Inverse Distance Weighted
Introduction
Hybridization influenced species evolution by facilitating gene flow between species, resulting in new genotype combinations and increased ecological adaptability [1]. Natural hybridization is commonly observed between sympatric pine species that occupy environmental gradients [2-4]. Native East Texas loblolly pine (Pinus taeda) and shortleaf pine (P. echinata) hybridize to produce shortleaf x loblolly pine hybrids [5], which may have historically led to improved fitness for southeastern pine forests growing at the western edge of their ranges in the warmer and drier climate of the region [6]. Contributions of rapid growth from loblolly pine and fire adaptations from shortleaf pine may have resulted in more resilient pine populations.
Genetically improved loblolly pine has been utilized in intensive silviculture to make commercial forests more productive [7]. The increased use of genetically improved loblolly pine has shifted the forest composition towards improved loblolly pine dominance, while reducing the potential for natural hybrids [8,9]. Because widespread usage of genetically improved loblolly pine is fairly recent in relation to the evolutionary history of southeastern pines, the incidence of hybridization in the present overstory may be dif ferent than the incidence of hybridization for the younger regeneration cohort that became established after the implementation of intensive forestry practices.
The southeastern United States has been predicted to become warmer and drier due to the effects of climate change [10,11]. Specifically, the average temperature in the West Gulf Coastal region is projected to increase by 0.5 °C per decade, along with an associated decline of annual precipitation by 200 mm over the next 40 years [12]. This change in annual temperature and rainfall regime is speculated to have major implications on forest health [13, 14]. Additional concerns include species distribution and abundance shifts, potential increases in disease incidence, maladaptation to regional conditions, and altered trophic interactions [13].
Subsequent expansions and declines can have profound impacts on species genetics, including incidents of allele frequency gradation and large-scale introgression of genes [15]. The commercial pine forests of the southern United States are of unique risk due to the common practice of planting individuals from a small number of families that are genetically identical (i.e. clonal forestry) [7]. However, hybridization of local species has been offered as one of many approaches for safeguarding forest systems from the deleterious effects of climate change [16]. The reduced natural hybridization potential found in the regeneration stage could lead to diminished adaptability of the pine forests in East Texas to climate change. Thus, methods useful in determining hybridization among the southern pines become ever more important precursors of genetic conservation.
Prior to the usage of Deoxyribonucleic Acid (DNA) as a species identification tool, morphology was relied upon for determining species identity, taxonomic classification, and phylogenetic history [5,17,18]. Being able to morphologically separate and classify species can be useful in initial assessments, but complete reliance on this methodology can lead to species misidentification, erroneous species classification, and incorrect phylogenetic associations with other species [19,20]. These shortcomings are especially apparent when evolutionarily young species, extensively hybridized species, or species with highly variable morphological characteristics are considered [21]. Such is the case with the Australes subsection in the Pinus genus, containing 22 species found in the southeastern United States, Mexico, and the Caribbean; included in the subsection are shortleaf pine, slash pine, longleaf pine, and loblolly pine [22]. Species within Australes are thought to have begun differentiation 7-15 million years ago in the middle of the Miocene epoch and are theorized to have been dramatically influenced by rapid climate fluctuations such as the Pleistocene Ice Age [23]. The geographic variability of these species has led, in part, to the difficulty researchers have encountered when using DNA analysis to make phylogenetic inferences about the southern yellow pines [13].
Compounding this difficulty is the close interrelatedness of the southern yellow pine species and their inclinations to hybridize. While some species crosses are difficult to achieve, and are not known to occur in nature (i.e. shortleaf x slash pine and shortleaf x longleaf pine), they have been produced in laboratory settings [24,18]. Other species crosses happen readily under certain climatic and site conditions (i.e. loblolly x shortleaf pine, loblolly x longleaf pine, loblolly x slash pine, and longleaf x slash pine) [25].
Chromatography is a common chemical analysis method that has been used for isolating compounds within plants for over a century [26], and its usefulness for intraspecies and interspecies identification has been realized [27]. While a fine scale understanding of the genetic identities of individuals is not possible with chromatography alone, species signatures based on inheritable compositions of compounds is possible, and has been completed for most species in the Pinus genus [28,29]. However, few have included comparisons of species within the Australes subsection of Pinus.
This study investigates hybridization occurrence of overstory and regeneration cohorts utilizing high performance liquid chromatography (HPLC) to identify chemical markers useful in differentiating between loblolly, shortleaf, and hybridized pines. These signatures were tabulated and displayed in ArcGIS ArcMap 10.6.1 to produce a map product useful in elucidating where local differences between loblolly pine and shortleaf pine distribution occur in East Texas. As climate change continues to be a pressing concern, investigating the spatial relationships of native pine parents and hybrids may be of increasing importance for the future sustainability of forest resources. The specific objectives were to:
1. Identify chemical markers from chromatogram peaks using spectral data for loblolly pine, shortleaf pine, and their hybrid, shortleaf x loblolly pine.
2. Investigate hybridization frequency by determining if chromatogram peaks differed between overstory and advanced regeneration strata along a north-south gradient in eastern Texas.
3. Utilize Geographic Information Systems (GIS) analysis to elucidate the geographic variation of species hybridization for loblolly pine and shortleaf pine in East Texas.
Materials and Methods
Study area
Study sites were selected based upon the site containing a mature overstory and advanced regeneration (sapling-size) individuals of loblolly pine, shortleaf pine, or potentially hybrids within the West Gulf Coastal Plain. Sampling locations included Atlanta State Park, Tyler State Park, and Mission Tejas State Park to provide a north to southbound transect of East Texas (Figure 1). Atlanta State Park is in extreme northeast Texas, and is dominated by shortleaf pine associated with white oak (Quercus alba). Loblolly pine does occur within the park in interspersed populations growing in association with sweetgum (Liquidambar styraciflua). Tyler State Park is at the western fringe of the Pineywoods ecoregion where it meets the Post Oak Savannah ecoregion. Due to this, floristic components of both ecoregions can be found with the dominant pine species being shortleaf pine, found in association with post oak (Quercus stellata). Loblolly pine is found within the park at lower elevations. Mission Tejas State Park, the southernmost sampling location, and the dominant tree species is loblolly pine, though shortleaf pine is found readily.

Field Measurements
Mature overstory trees were reproductively capable individuals useful in determining vegetative community type (e.g. free-to-grow, dominant or co-dominant position). Advanced regeneration was classified as individual understory stems less than six meters tall. At each site, three variable area sampling units were established, separated by at least twice the height of the overstory trees to minimize potential spatial autocorrelation. At each unit, three overstory trees and three advanced regeneration trees were selected for collecting branch samples, resulting in a total of 54 trees sampled, 18 at each of the three sites. Branches were collected with equipment appropriate for tree height (e.g. pole saw or hand clippers for sapling-sized individuals; rope saw or portable sampling device for taller individuals). Branch samples were placed in brown paper bags and labeled. Global Positioning System (GPS) coordinates were recorded for each individual, increment cores were obtained from overstory individuals using an increment borer, and individuals were tentatively identified to species or hybrid classes based on morphological measurements. A subset of 24 from the 54 total individuals sampled were selected for chemical analysis.
Tentative species class identification for each sample was determined by measuring needle length from fascicle base to needle tip for six randomly selected needles from six different branches for each individual sampled as described in [18]. The three species classes of shortleaf pine (average needle length < 9.3 cm), loblolly pine (average needle length > 11.4 cm), and shortleaf x loblolly pine (average needle length between 9.3 and 11.4 cm) were created to facilitate analysis.
Laboratory analysis
Pine needles were obtained by cutting the needles from the branch at the fascicle using stainless steel scissors, and stored in a freezer at 5°C, pending analysis. The needles were air dried at 21°C to a consistent moisture content, quantified as needle weights remaining within 0.01 g over two consecutive days. This drying method was conducted to reduce the potential for terpene volatilization from high temperature drying. Dried needles were ground into powder using a 900-Watt household blender and extracted with 95% ethanol in a Dionex ASE 200 Accelerated Solvent Extraction System for 30 minutes using instrument settings of 65°C, 10,342 kilopascal (kPa), 30 minutes static time, 100% volume flush, 120-second purge, and 1 cycle. The extracted solution was then diluted with HPLC grade acetonitrile at a rate of 50 μL solution to 1000 μL solvent to protect UV detection lamp integrity. Diluted samples were fractioned sequentially with HPLC grade ultra-pure water (60% of solvent solution) containing an added 0.04% 12 molarity hydrochloric acid by volume to increase peak sharpness and acetonitrile (40% of solvent solution). The diluted samples were carried by fractioned solvents (mobile phase) and were analyzed using Agilent ODS columns (Zorbax SB-C18, 4.6 x 250 mm, 3.5 μm) in a complete Jasco 4000 HPLC system using the instrument settings of 0.7 ml per minute solvent flow rate, injection volume of 20 μL, and a complete run time of 45 minutes. The diode array detector module of the HPLC system with a setting of 254 μm. System pressure was maintained within range of 8.1 to 8.5 megapascal (MPa), and column temperature was maintained at 40°C. Fractions were analyzed for stability for identification of loblolly pine, shortleaf pine, and hybridized pine from solutions via acquired chromatograms.
Chromatograms were obtained for the 24 individual subsample of to evaluate method efficacy. These chromatograms were compared to a genetically improved loblolly pine control sample obtained from ArborGen, and a genetically improved shortleaf pine control from International Forest Company. Control samples were obtained as prepared foliar samples, therefore only needle measurements and average needles per fascicle could be recorded.
Data analysis
Samples from Atlanta State Park, Tyler State Park, and Mission Tejas State Park were codified as ASP, TSP, and MTSP, respectively. The plot number and cohort of the individual were recorded as P1, P2, and P3 for plots 1-3, O1, O2, and O3 for overstory trees 1-3, and U1, U2, and U3 for advanced regeneration trees 1-3 (e.g. TSP P1O1 is the first overstory individual sampled at plot one of Tyler State Park).
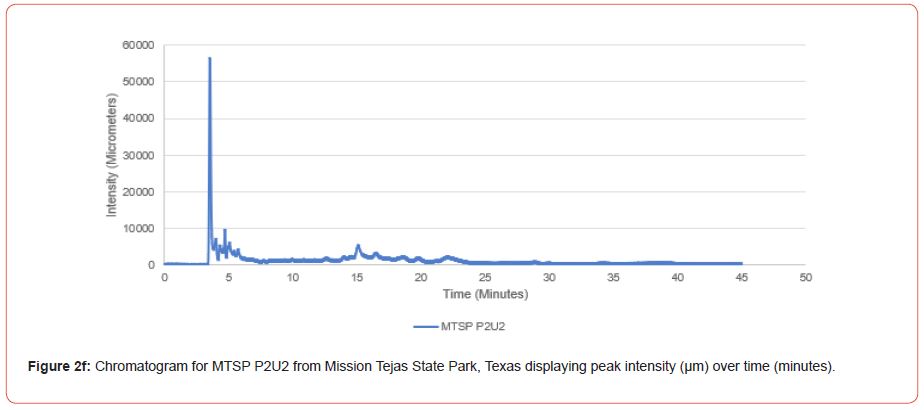
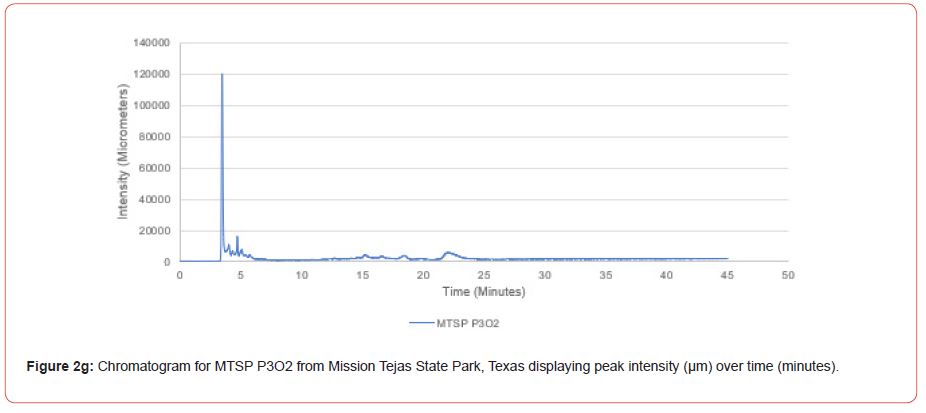
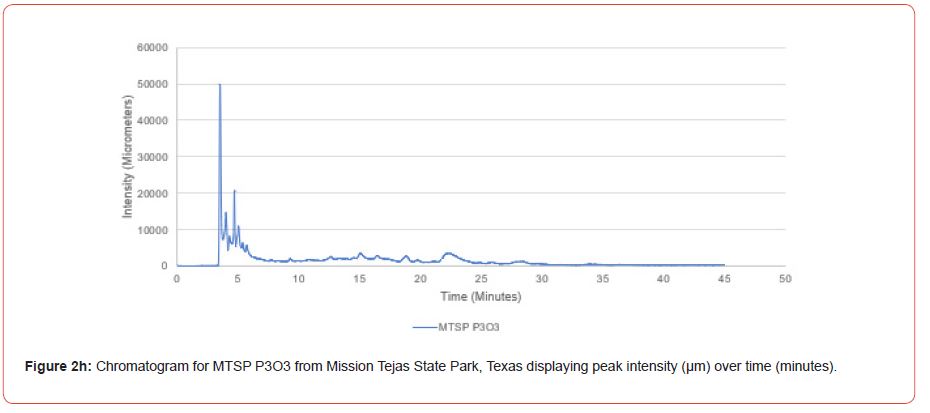
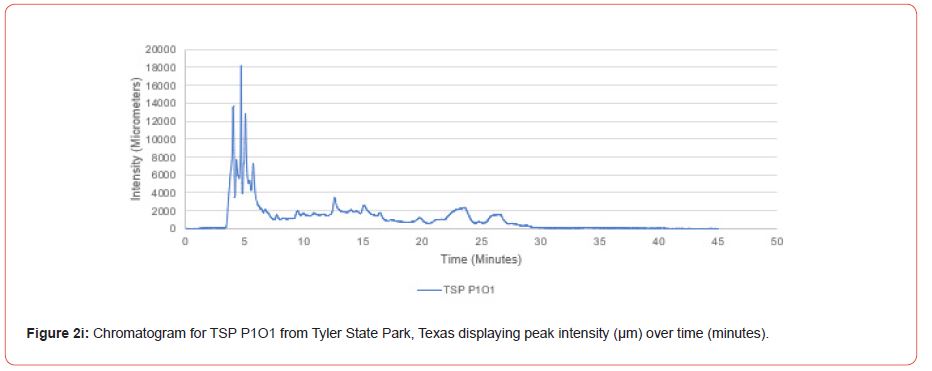
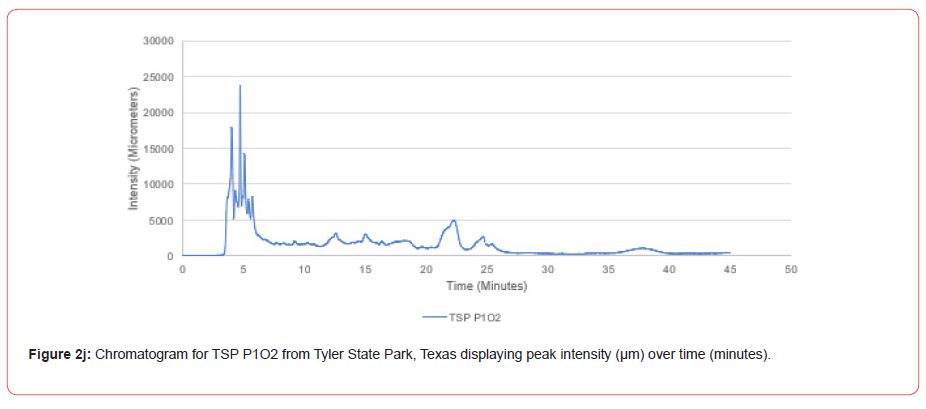
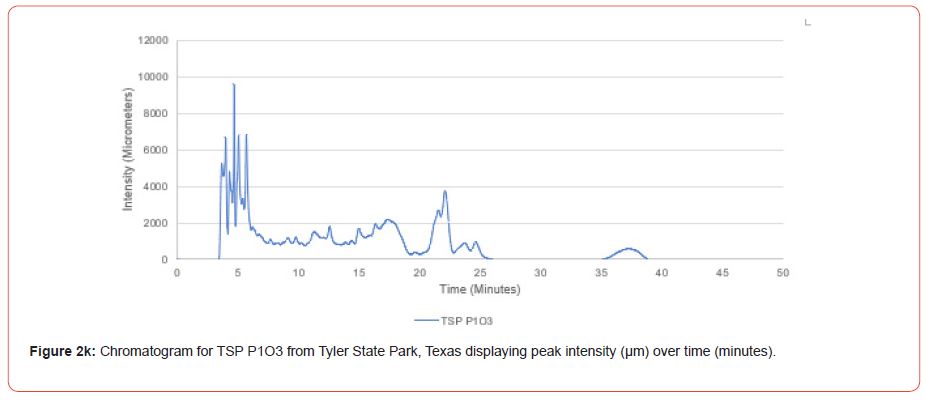
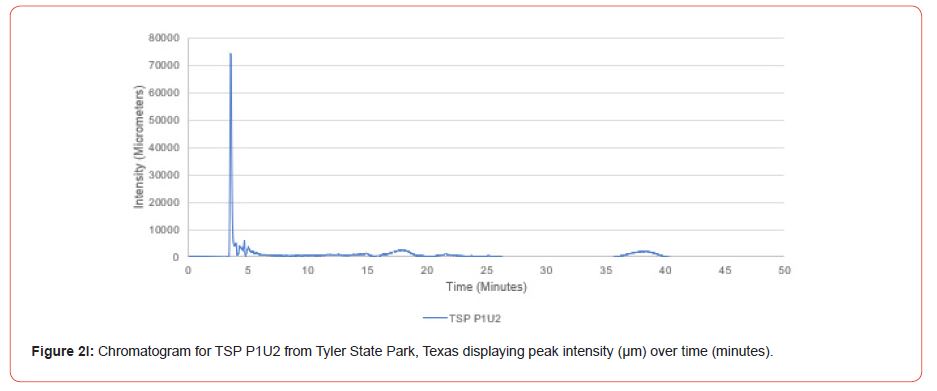
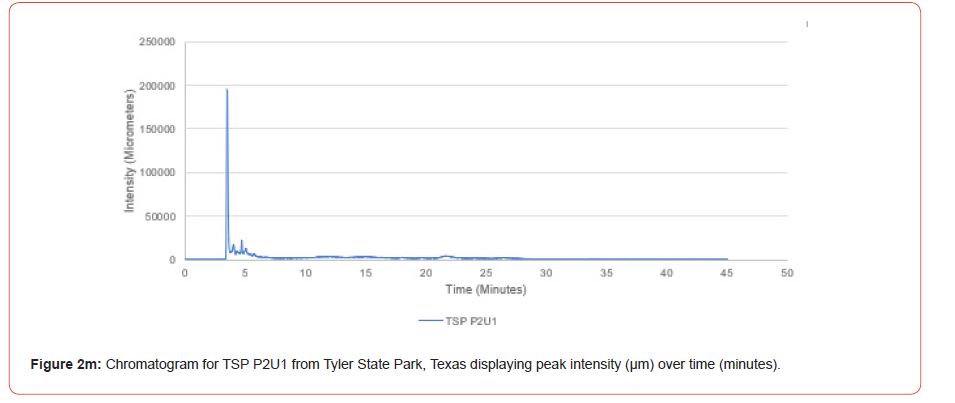
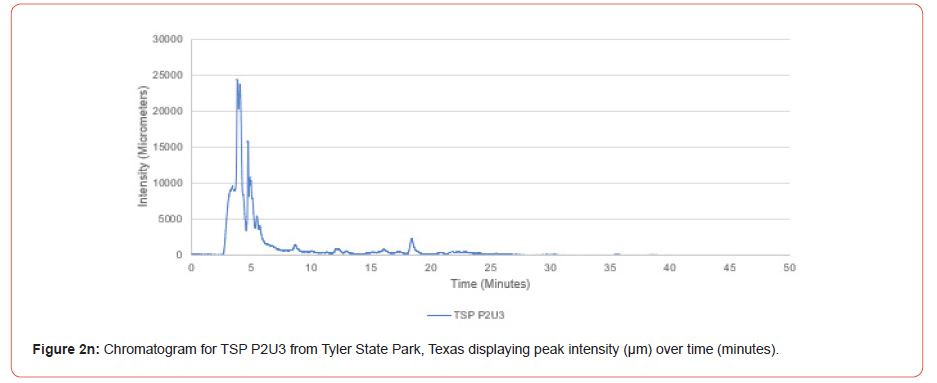
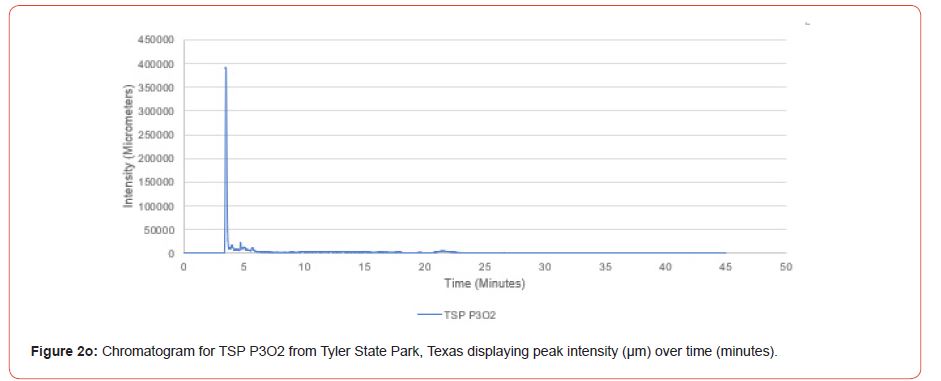
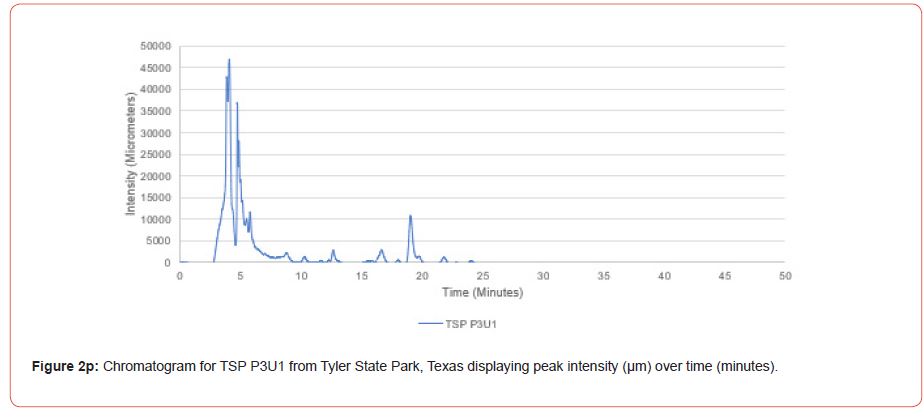
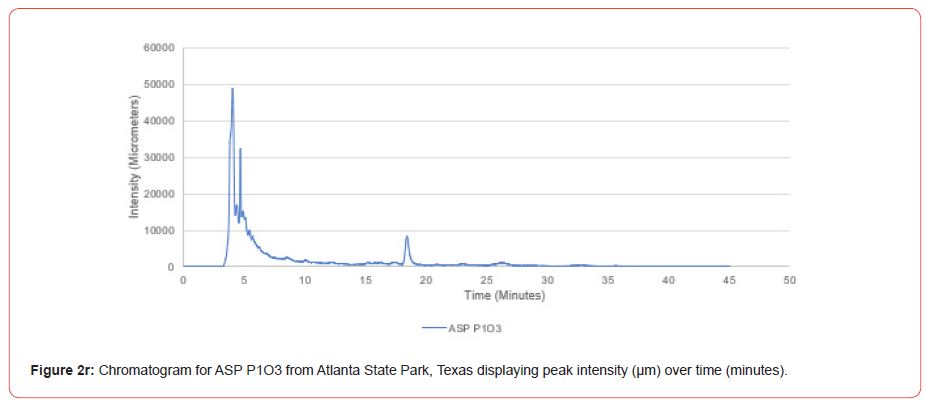
Chromatograms from the Jasco 4000 HPLC system located in the Chemistry Laboratory at Stephen F. Austin State University were displayed in the Igor Pro software (Wavemetrics, Inc., Lake Oswego, OR), and were analyzed for peak retention time and peak intensity. Peak intensity was quantified with the measuring tool within Igor Pro, with peaks greater than 1,000 μm being considered a compound absorption event. Peaks below 1,000 μm were considered equipment noise. At each measured peak node, the retention time was recorded from the x-axis of the chromatogram display.
All statistical analyses were conducted using SAS 9.4 (Statistical Analysis Software, SAS Institute, Cary, NC) and significance was determined at p-value <0.05. To determine if differences occurred for peak intensities between the overstory and advanced regeneration strata sampled, a t-test was conducted for each site using the grouping of peak intensities as continuous variables. Two-way analysis of variance (ANOVA) tests was conducted for each peak to test the effects of the two factors of site and species class for the dependent variable of peak intensity. ANOVA results were then examined with multiple comparisons analysis to compare the difference among species means and among site locations by using post-hoc Tukey HSD tests. Simple linear regression for each peak was then used to determine if a relationship between needle length and peak intensity was present, with peak intensity as the dependent variable, and needle length as the independent variable.
The GPS coordinates recorded during field sampling were entered into ArcGIS ArcMap 10.6.1 for georeferencing each observation. The peak intensities representing chemical signature tags for each individual were entered into a database to create map products displaying threshold points in species occurrence, and hybridization level by forest strata across the natural ranges of the species in East Texas. Spatial interpolation was conducted for each peak using the inverse distance weighted (IDW) method to spatially interpolate chromatogram peak intensity at a broader scale (Power = 2, 12 points used).
Results
Needles were found to have needle lengths ranging from 7.9 cm to 18.5 cm. From these measurements, six samples were determined to be putative shortleaf pines, seven samples were determined to be putative loblolly pines, and 11 were determined to be putative shortleaf x loblolly pine hybrids (Table 1).
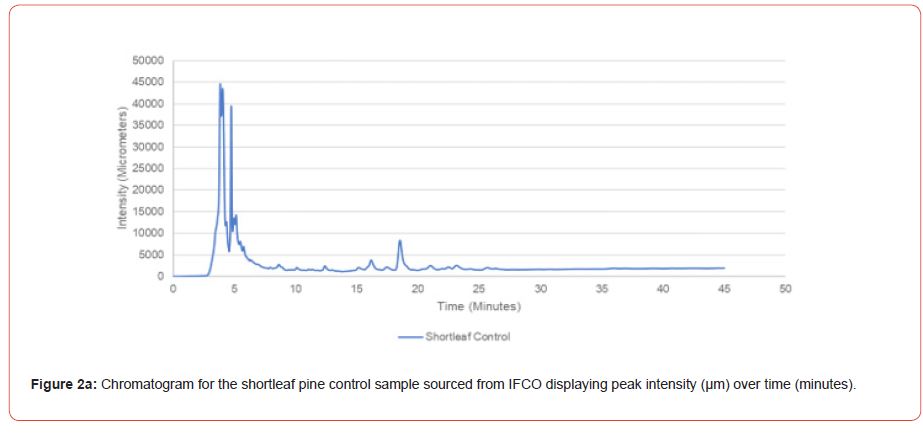
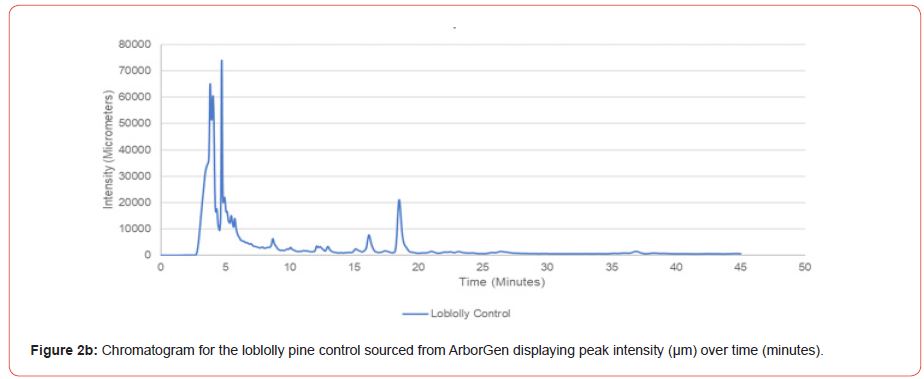
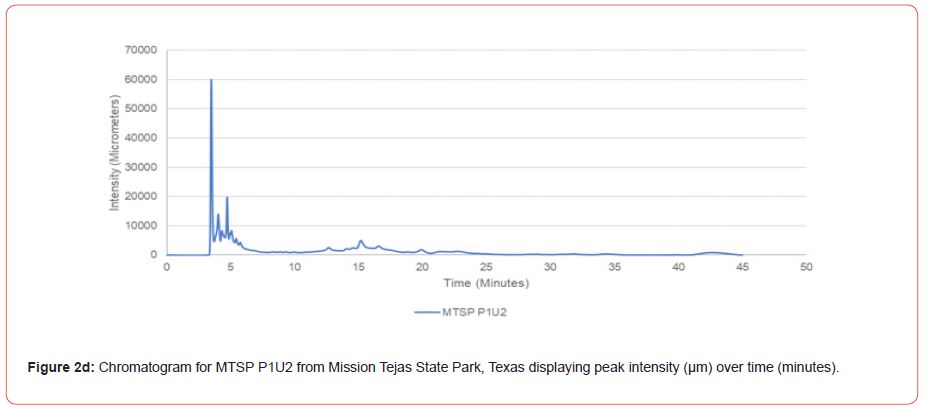
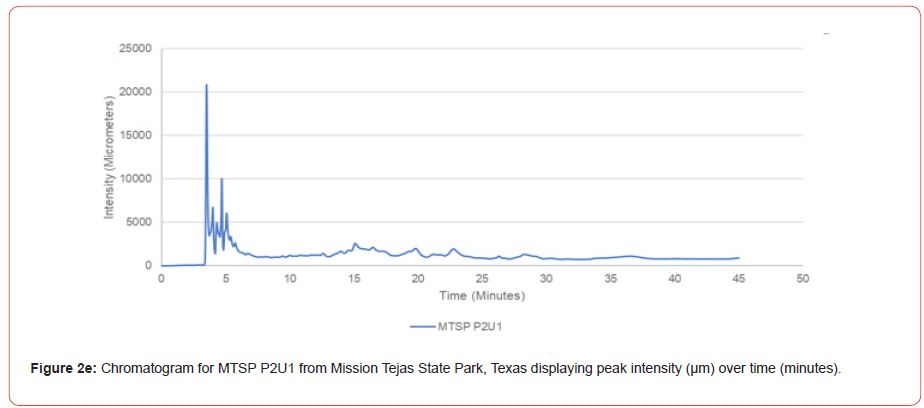
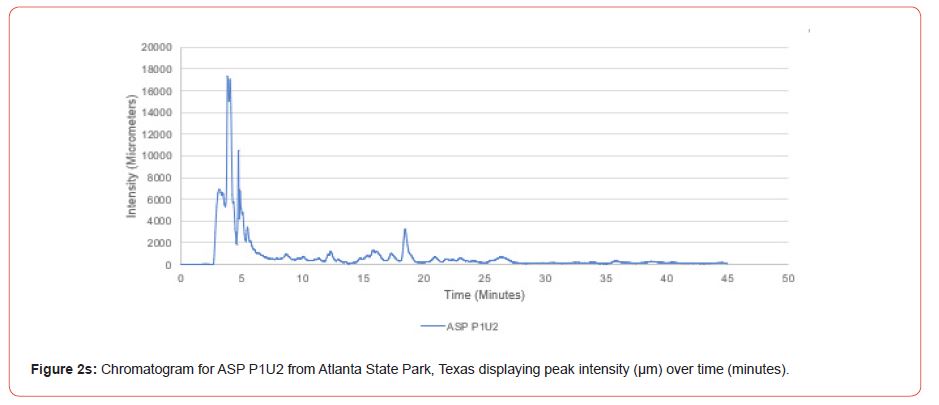
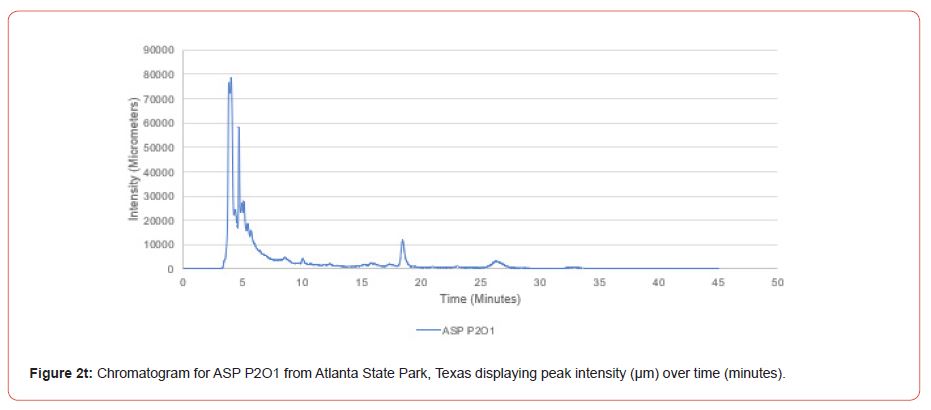
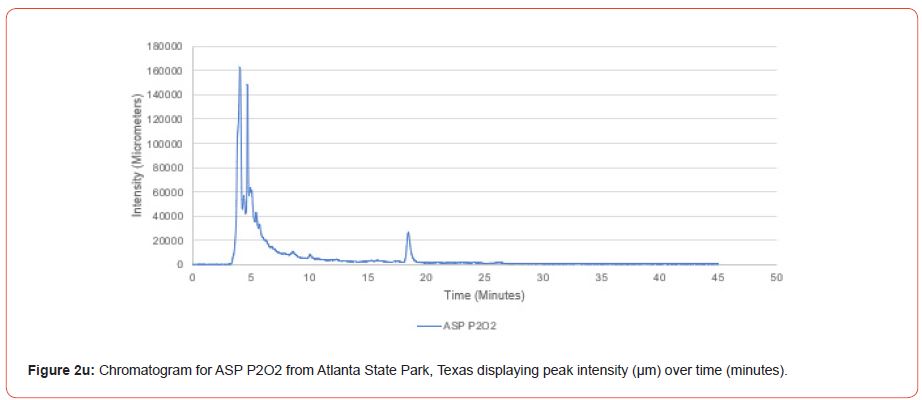
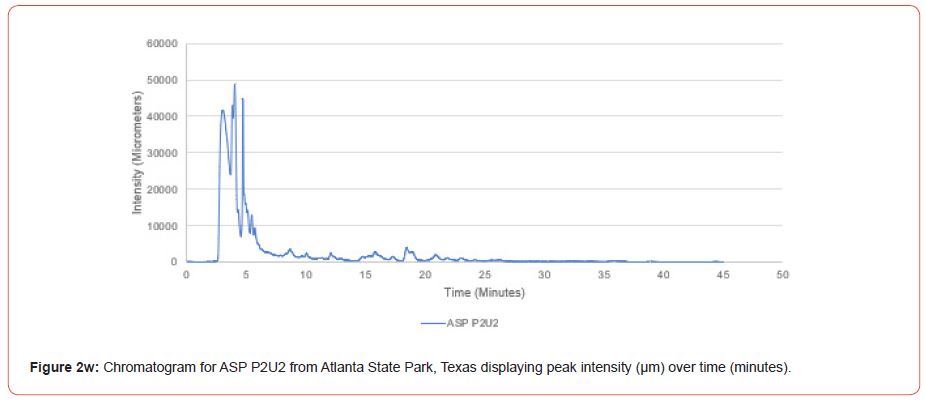
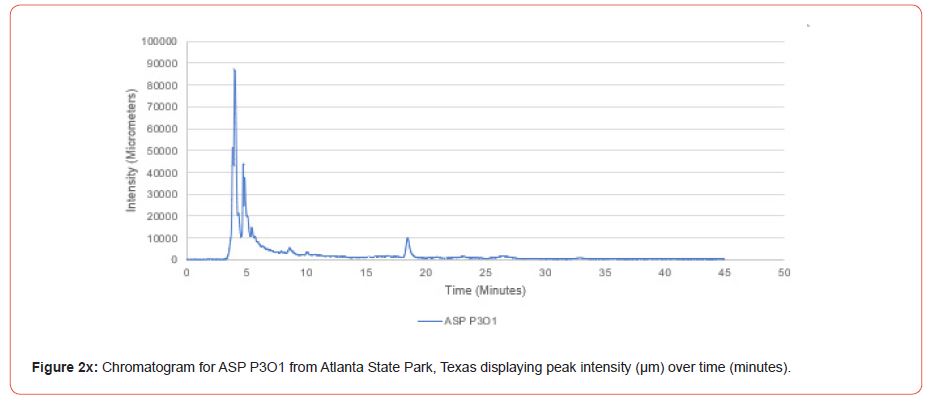
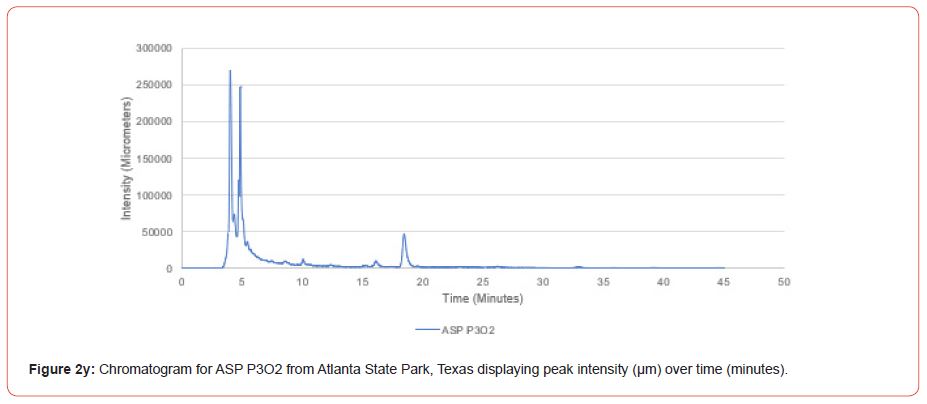
The optimal time frame for analyzing chromatogram peak values was between 0 – 25 minutes (Figure 2); shorter, minor peaks detected outside of this range were classified as erroneous noise as their intensities were minute (< 1,000 μm). For species differentiation. a total of 14 peaks with intensity values ≥ 1,000 μm were used at retention times of 3.50, 3.83, 4.03, 4.35, 4.72, 4.92, 5.11, 5.44, 5.73, 8.64, 10.04, 14.39, 16.14, and 18.60 minutes, and are hereafter labeled as Peak Retention time (e.g. Peak3.83). Due to similarity in peak width, e peak intensity was used as the basis for chromatogram quantification and comparison; not every chromatogram contained all 14 peaks. Due to peaks representing compound absorption, peak presence was considered as a detection of characterizing compound. Between Peak3.50 and Peak5.44 there was consistency in samples expressing absorption, although differences were noted (Table 2). Following Peak5.44, subsequent peaks are characterized by sporadic absorption.
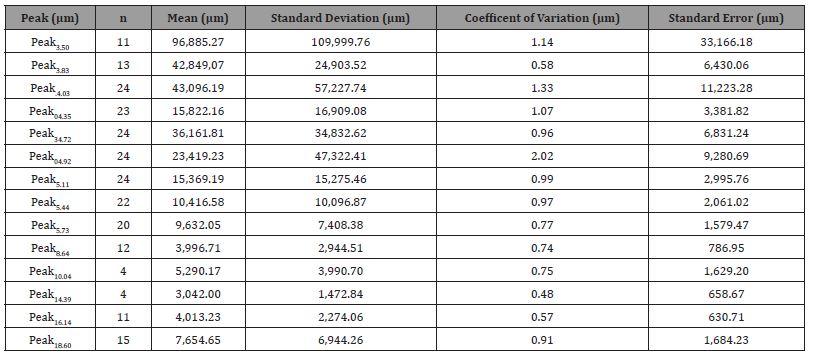
Descriptive statistics were calculated, with an overall peak intensity standard deviation of 40,787.32 μm, overall coefficient of variation of 1.76 μm, and an overall standard error of 2,549.21 μm (Table 3). T-test results found no statistical differences in total peak intensities between the overstory and advanced regeneration strata for any study site (Atlanta State Park, p = 0.08; Tyler State Park, p = 0.9; Mission Tejas State Park, p = 0.2). Therefore, ANOVA was completed with overstory and advanced regeneration pooled.
Table 1: Needle lengths in centimeters (cm) and putative identification for pine samples (n= 24) collected from Tyler State Park (TSP), Mission Tejas State Park (MTSP), and Atlanta State Park (ASP) in East Texas.
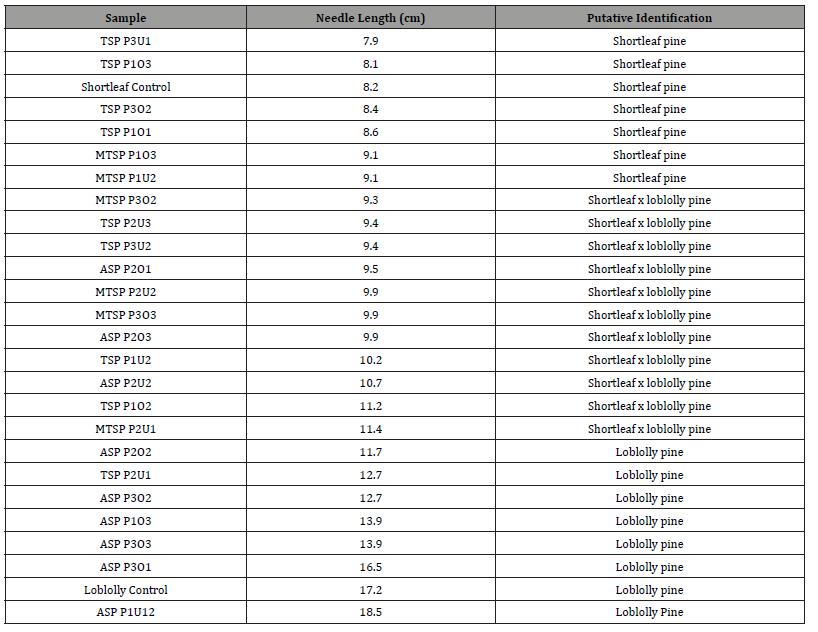
Table 2: Peak intensity values in micrometers (μm) for 14 peaks identified among sampled East Texas pines from Atlanta State Park (ASP), Tyler State Park (TSP), and Mission Tejas State Park (MTSP) (n = 24) compared to control samples.
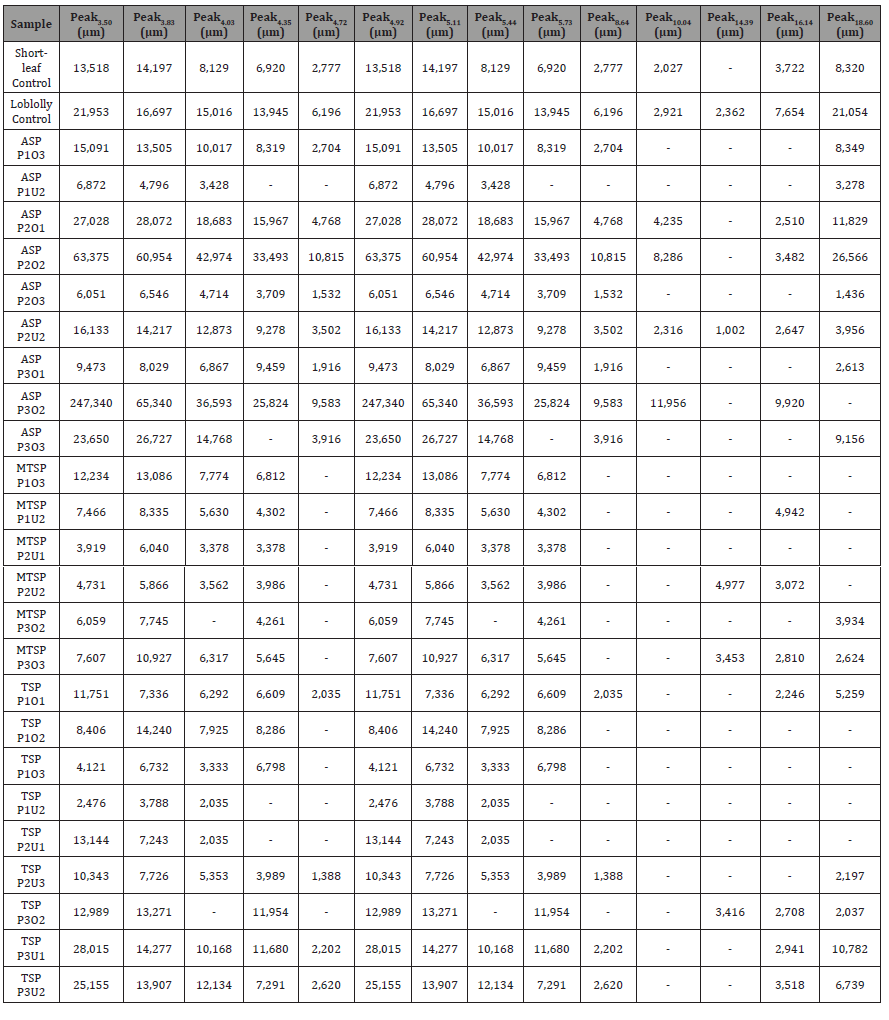
Table 3: Summary statistics for chromatogram peak intensity values recorded for 24 East Texas pines.
ANOVA indicated that five identified peaks within the acquired chromatograms had statistically significant differences in peak intensity among the variable species class (Table 4). Peak5.11, Peak5.44, Peak5.73, Peak8.64, and Peak10.04 indicated statistically significant differences among species class; for these peaks, the intensity value is significantly affected by species class effects. For the site variable, Peak3.83, Peak4.03, Peak5.44, Peak5.73, Peak8.64, and Peak10. indicated statistically significant differences in peak intensity among sites. While overlapping significance of species class and site factors occur for Peak5.44, Peak5.73, Peak8.64, and Peak10.04, the interaction of site and species class factors was not significant for these peaks. The only significant interaction between site and species class factors was found at Peak4.72.
Tukey HSD tests indicated that the primary significant pairwise comparison between species was among shortleaf pine and shortleaf x loblolly pine for Peak4.03, Peak4.35, Peak5.11, Peak5.44, Peak5.73, Peak8.64, and Peak10.04 (Table 5). The only other significant comparison was at Peak5.73, where the comparison of shortleaf x loblolly pine to loblolly pine was significant. The mean difference for the shortleaf pine to loblolly pine comparison was consistently the lowest value, indicating the least significance.
Table 4: ANOVA results for all peaks by site, species, and site x species interaction.
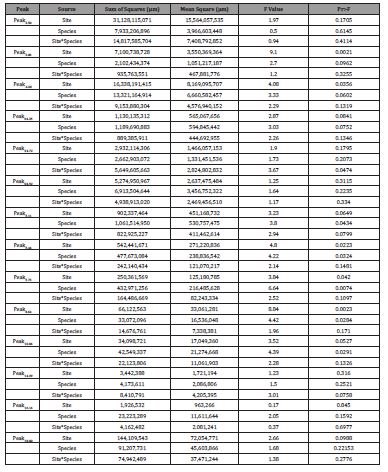
Table 5: Pairwise comparisons of shortleaf pine (A), shortleaf x loblolly pine (B), and loblolly pine (C) using mean difference between groups obtained from Tukey HSD post-hoc test. *Denotes significance.

Results from the simple linear regression found no detectable correlation between average needle length and peak intensity for any peak node, with all R2 values <0.07. These results indicate that a direct comparison of tentative species identity from average needle length measurements and identification through peak intensity is not appropriate for these individuals.
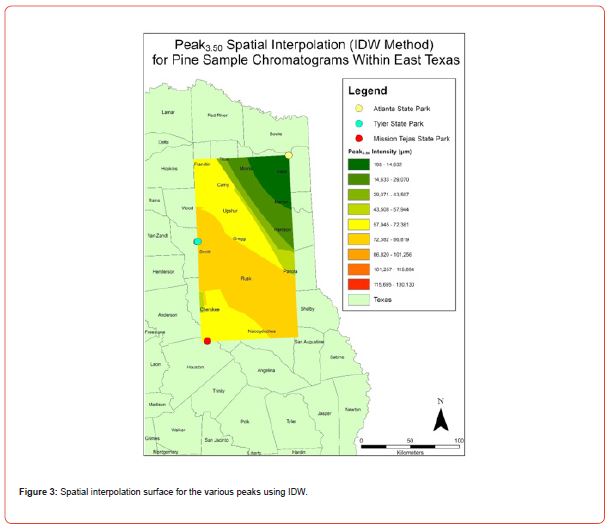
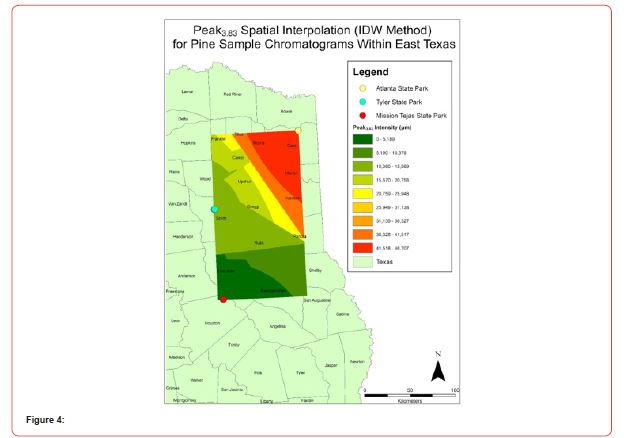
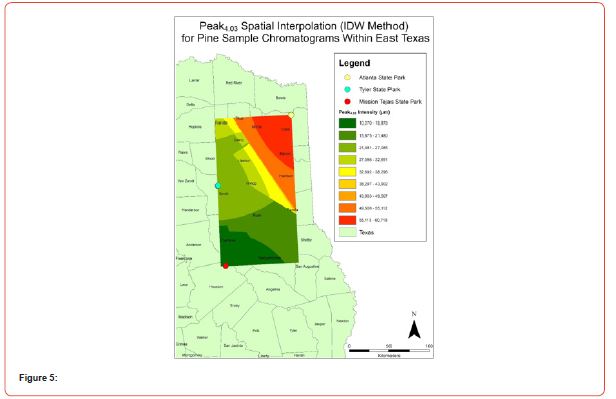
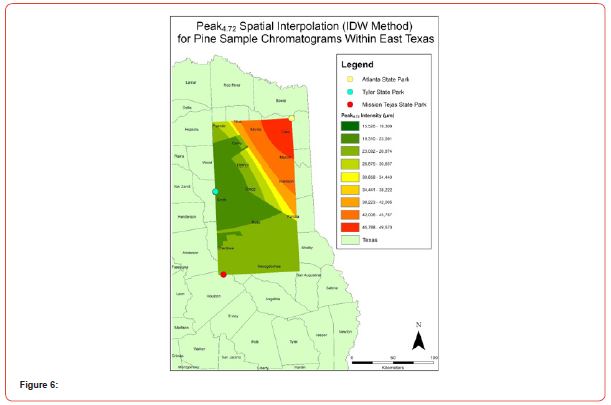
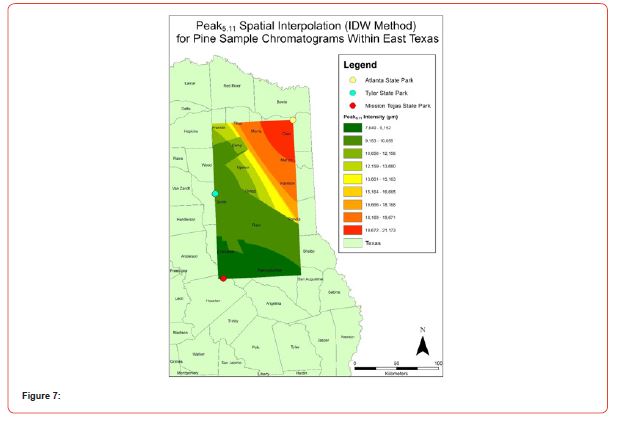
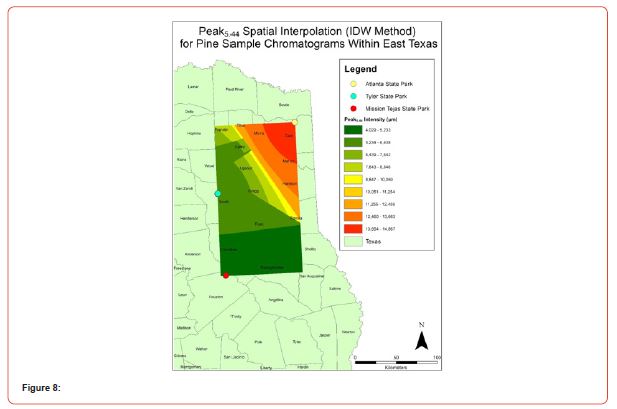
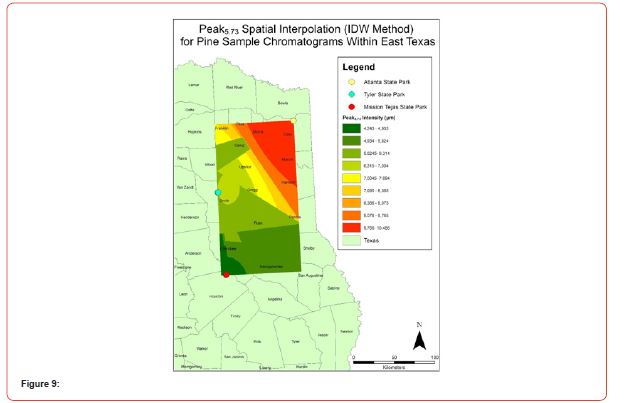
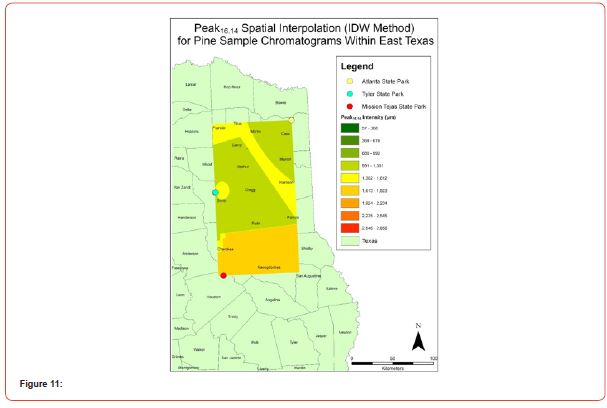
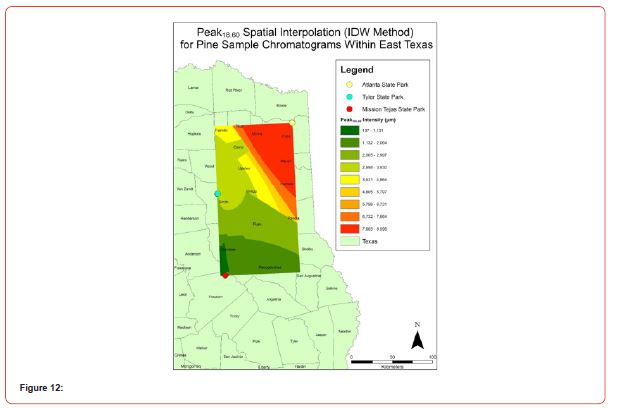
Using GIS, nine classes of intensity values were used for displaying the spatially interpolated surface for each of the 14 peaks. All surfaces produced are presented with the color ramp of green representing lowest values and red representing highest values. From these surfaces, a gradient of peak intensity values was displayed (Figures 2a-2z). Peak intensity was generally shown to be highest at the northeast, with values decreasing when moving toward the southwest, where 79% of peaks displayed this trend. An exception to this pattern is shown in Peak3.50, Peak14.39, and Peak16.14, which had an inverse expression of the prevailing trend.





Discussion
Peak5.11, Peak5.44, Peak5.73, Peak8.64, and Peak10.04 were of special interest due to the significant differences in peak intensities among species classes. Peak5.73 showed the greatest differences between species and was near ubiquitous among samples except for TSP P1U2, TSP P2U1, ASP P3O1, and ASP P1U2, representing northern portions of East Texas. Also noteworthy is the distribution of Peak8.64, represented in Tyler State Park and Atlanta State Park samples exclusively. Furthermore, Peak10.04 was only expressed by the controls and four individual trees from Atlanta State Park. This pattern of peak expression in relation to geography indicates that the presence of compounds could be tied to site effects, especially for more northern and western sites with increased aridity. The link between genomics and terpene composition in relation to adaptability is not well understood, but the effects of environmental stressors on terpene concentration is well documented for pines [30-34].
Separation of samples by species identity was confounded by site variation and the small sample size. Due to the interplay of site effects and terpene concentration, individual-level comparisons of genetic identity are difficult to determine through terpene composition and concentration analysis alone. The pattern of expression appears to be more valuable than relative intensity. There was no clear relationship between peak intensity and putative species identification from needle length, therefore hybridization could not be directly quantified among the entire sample group. Detectable differences in species composition were also not realized between overstory and advanced regeneration strata due to both groups having similar peak distribution and intensities. The sample size presented in this study is relatively small for quantification of species identity, and these species have large geographic distributions, prolific occurrences, and high genetic diversities. Therefore, it is likely that a greater number of peaks would be useful for quantification when a larger subset of the population is analyzed. While a clear pattern indicating a relationship between compound intensity and putative species identity was not realized (e.g. intensity increasing as needle length increases), the data help to reinforce the notion that pine oil chemical constituents, namely terpenes, vary in concentration with geographic variation [35]. The results of the GIS analysis support this further, as clusters of higher intensity values were arranged by location rather than species identity. Perhaps with an increased sample size including a greater number of sites, differences could be quantified between not only sites, but also between the identities of species from these sites.
The identities of the compounds were not quantified, a process that could further help determine species differences. The use of a mass spectrometry system to identify the compounds represented by chromatogram peaks could be implemented to further refine analysis as well.
Conclusion
The use of chromatography in conjunction with GIS analysis shows promise for determining the identity of southern pine species in East Texas. From peak presence and intensity analysis, it is clear that at the broad, regional level, different populations have different concentrations of inheritable terpenes, and thus can be used to supplement morphological measurements. However, hybridization was not able to be quantified at the individual or population scale using the sample size covered in this study. Statistically significant differences between the peak intensities at the species class level indicated that separation could be possible, but assigning a chemical signature to a species or hybrid proved difficult. This may be attributed to the influence of site effects or unequal species class representation. Increasing the sample size and geographic area sampled, along with peak identification through mass spectrometry, could help in establishing a clear north-south hybridization matrix through more accurate chromatogram assignment. Further investigation of the specific peaks and their relation to species identity once compounds are identified is warranted. Also, creating more precise GIS products through a greater number of points for spatial interpolation would further improve upon the results of subsequent research, and aid in determining species identities at a finer scale.
Species identification through chromatography is coarser than that of more detailed DNA analysis methods, but chromatography analysis can be used to provide population level information with the added benefit of being able to quickly assess population responses to environmental stressors. Due to this, further study of the role terpenes play in southern pine site adaption is warranted, and could have important implications for quickly assessing population resilience towards more frequent drought and insect outbreak brought on by climate change. The increasing northward concentrations of the compounds signified by peak intensities potentially represent population response to stress from lower soil nutrient availability or increased aridity, thus further investigation of their role as defensive compounds is necessary.
Informed Consent
The manuscript does not contain any individual person’s data in any form.
Acknowledgement
Funding for this project was provided through the Arthur Temple College of Forestry and Agriculture at Stephen F. Austin State University, and the McIntire-Stennis Cooperative Research Program. We thank Brandon Childers for the permitting necessary for sampling within Texas Parks and Wildlife managed areas, and Texas Parks and Wildlife personnel Gary Coker, Devin Depalermo, Charles Hubbard, and Nicholas Maloukis for their assistance. We also thank Dean Attaway for his assistance at U.S. Army Corps of Engineers managed areas. We also thank Kay McCuller of ArborGen and Justin Floyd of International Forest Company (IFCO) for their aid in collecting samples for species controls. Field and laboratory technicians Ali Battaglia, Jewel Coffey, Augusto Conde de Frankenburg, Gillian Ehrman, Don Hassler, Nick Peckham, Laken Simington, Devin Theisen, and Kellie Wheeler are especially thanked.
Conflict of Interest
No financial interest or conflict of interest exists.
References
-
Gary R White Jr, Brian P Oswald*, Katheryn R Kidd and I Kuai Hung. Loblolly Pine and Shortleaf Pine Hybridization Analysis Using Chromatography and Geographic Information Systems: A Case Study in East Texas. Online J Ecol Environ Sci. 1(2): 2023. OJEES.MS.ID.000509.
-
Liquid chromatography, Loblolly pine, Shortleaf pine, Climate change, Ecological adaptability, Hybridization, Geographic information systems, Solvent extraction system, Chromatograms, Peaks
-

This work is licensed under a Creative Commons Attribution-NonCommercial 4.0 International License.


