 Research Article
Evaluating the Quality of Urban Green Spaces at Residential Urban Morphologies in The Federal District, Brazil
Giovana Sbatista*, Henrique Lroig, Leticia Ksbrito and Romero Gpdasilva
University of Brasilia, Brazil
Giovana Sbatista, University of Brasilia, Brazil
Received Date:February 22, 2024; Published Date:March 26, 2024
Abstract
Green spaces contribute to the reduction of air and noise pollution, temperature control, increase water infiltration and soil structuring and decrease runoff and water erosion rates. Furthermore, green spaces contribute to human well-being in cities. Brasilia, Federal District is the capital of Brazil. The urbanism of the administrative region of Brasilia was planned in the 60’s, but due to the housing needs of the lower income population, suburbs emerged without planning. Brasilia’s suburbs have a characteristic land use occupation of high surface sealing and low presence of green spaces. To evaluate the quantity and quality of urban green spaces, the UVST – Urban vegetation volume methodology was applied in conjunction with two selected Urban Structure Types (USTs). The selected urban morphologies had the purpose to demonstrate the quantity and quality of the amount of vegetation in two distinct types of single-family dwellings one with a high surface sealing (RH1) and the other with a large amount of vegetation and permeable surfaces (RH5). The volume of vegetation per square meter obtained for RH1 was 0.20 m³/m², while for RH5 it was 0.65 m³/m², showing that RH5 has more vegetation volume than RH1. This data can be used to demonstrate that the RH5 has more quantity and quality of urban green spaces in comparison to RH1.
Keywords:Urban Green Spaces; Sustainability; Well; Being
Introduction
Quality of life is highly related to natural environments, including general health, mental health, physical health, social health, and longevity (WARD THOMPSON, 2011).
Methods
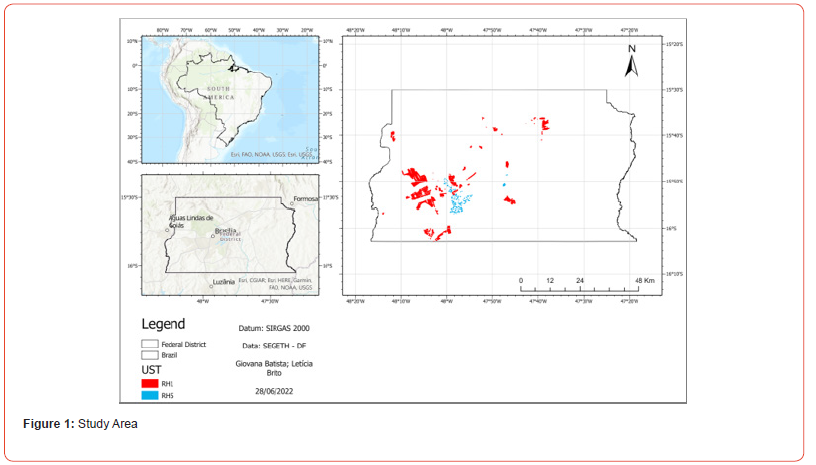
The studied area is situated in the Federal District, Brazil’s capital located in middle-west region, with nearly 3 million inhabitants (Figure 1).

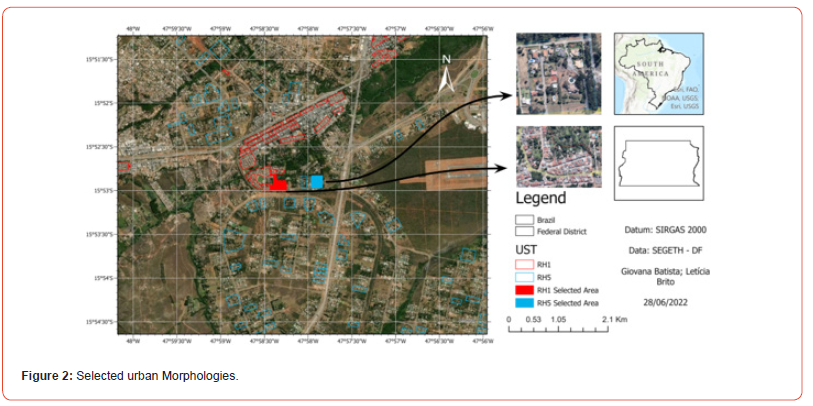
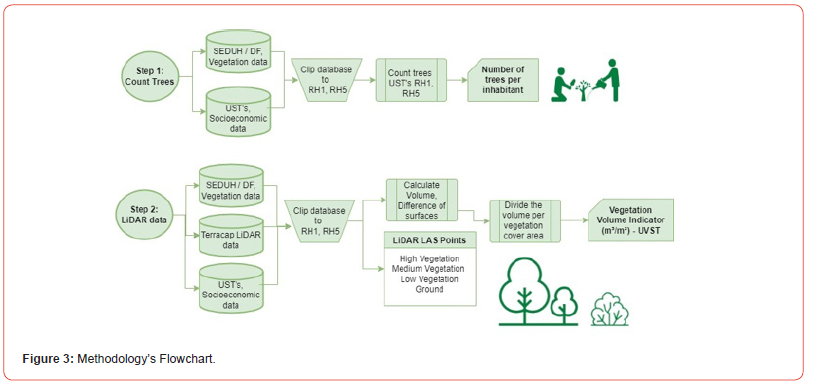
In this region, the climate is tropical with two very defined seasons, being arid from May to September with low precipitation rates and high evaporation rates, and a rainy between October and April, with storms with high rainfall intensity. The average annual precipitation varies at the range of 1,200 to 1,700 mm in a territory of about 6,000 sqkm. The urban morphologies studied are the RH1 – Single family houses with high occupancy rate (allotments with 250 sqm of area) and RH5 – Single family houses with low occupancy rate (allotments with 2000 sqm of area). The RH1 is characteristic of low-income suburbs and the RH5 is normally founded in medium to high income suburbs. The selected Urban morphologies studied are illustrated in (Figure 2). The quantity and quality of the urban green spaces was evaluated in two steps, as can be seen in (Figure 3). First, it was analyzed the number of trees per inhabitant in the two USTs, using the urban vegetation data provided by SEDUH [1] and socioeconomic data provided by Castro [2].


The second step was to assess the volume of vegetation per square meter in these USTs, using the UVST methodology purposed by [3] The method of UVST consists in use LAS (LiDAR) data, that is processed in ArcGIS, being able to visualize the vegetation height, volume, and difference between surfaces, that are divided in ground, high, medium, and low vegetation. With the volume value, it was used the correction factor in 0,33, through the shape of the tree crown. The last step to create the UVST was to divide the volume per vegetation cover area [4-6].
Results

The main results showed that RH5 have a higher volume of vegetation in its green spaces are three times greater than RH1. The volume of vegetation per square meter obtained for RH1 was 0.20 m³/m², while for RH5 was 0.65 m³/m² (Figure 4), showing that RH5 has more vegetation volume than RH1. The number of trees per inhabitant also show the difference between the two USTs. The RH1 has only 0.05 trees per inhabitant, and RH5 has 3.42trees per inhabitant. That shows that RH1, with a high population density, has a lower amount of vegetation, in quantity and quality, than RH5. The RH1, as described above, is a UST characteristic of low-income neighborhoods [7,8].
Conclusion
The two test examples were used to compare two similar areas, both being residential areas. Even in these examples, it was possible to see differences in volume’s vegetation. In (Figure 2) is noticeable that RH1 has less tress and more constructions than RH5, showing that RH5 has a potential of a higher quality life, even if it has the lowest population density [9,10]. The methodology might be applied in different areas of Federal District, to indicate if there is inequality between different USTs related to green spaces. Improving the quantity and quality of urban green spaces is a social justice question. There is a lack in planning and policies in cities to improve these spaces. Their socioeconomic benefits can also be enhanced when the implementation of green spaces is associated with other collective use equipment, such as community centers, health centers, and schools.
References
- (2021) SEDUH - Secretaria de Desenvolvimento Urbano e Habitação do DF. Geoportal: Dados de Vegetação Árvores Isoladas.
- Castro KB, Roig HL, Neumann MRB (2018) Comparação entre diferentes métodos de interpolação zonal para estimativa populacional: estudo de caso das arias urbanas do Distrito Federal. In: Revista Brasileira de Cartografia 71(1): 207-232.
- Mathey J, Hennersdorf J, Lehmann I, Wende W (2021) Qualifying the urban structure type approach for urban green space analysis–A case study of Dresden Germany. In: Ecological Indicators 125(107519): 1-17.
- Wolch Jennifer R, Byrne Jason, Newell, Joshua P (2014) Urban green space public health and environmental justice: The challenge of making cities ‘just green enough’. In: Landscape and urban planning v 125(1): 234-244.
- Sorensen M, Smit J, Barzetti V, Williams J (1997) Good practices for urban greening. Inter-American Development Bank.
- Silva RGP (2018) Cenário dos Espaços Verdes Urbanos no Brasil. Tese (Doutorado em Ciência e Gestão da Sustentabilidade)-Brasília DF: Universidade de Brasília - Centro de Desenvolvimento Sustentá
- (2022) IBGE - Instituto Brasileiro de Geografia e Estatística– Painel de indicadores.
- Anjos RSA dos (2012) Brasília – 50 Anos de Dinâmica Territorial Urbana. Tempo - Técnica – Território 3(1): 1-24.
- Paviani A (2011) Patrimônio Urbano de Brasília: Urbanização com desigualdade socioespacial. In: 9º Seminário Docomo Brasil, Interdisplinariedade e Experiências em Documentação e Preservação do Patrimônio Recente, Brasília – DF.
- Castro KB, Roig HL, Neumann MRB, Rossi MS, Seraphim APACC, et al. (2019) New perspectives in land use mapping based on urban morphology: A case study of the Federal District Brazil. Land Use Policy pp. 87.
-
Giovana Sbatista*, Henrique Lroig, Leticia Ksbrito and Romero Gpdasilva. Evaluating the Quality of Urban Green Spaces at Residential Urban Morphologies in The Federal District, Brazil. Online J Ecol Environ Sci. 2(1): 2024. OJEES.MS.ID.000529.
-
Biosphere; Global Influence; Adequate Mathematical; Earth’s Biosphere; Ecosystems; Temperature; Irreversibility Dates
-

This work is licensed under a Creative Commons Attribution-NonCommercial 4.0 International License.


