 Research Article
Assessment of the Microalgal Communities of Phytoplankton, Epiphytes, and Periphyton using Pigment Based Chemotaxonomy
J William Louda*
Department of Chemistry and Biochemistry and The Environmental Sciences Program, Florida Atlantic University Boca Raton, USA
J William Louda, Department of Chemistry and Biochemistry and The Environmental Sciences Program, Florida Atlantic University Boca Raton, USA.
Received Date:September 11, 2023; Published Date:October 09, 2023
Introduction
Severe Microcystis aeruginosa blooms in Lake Okeechobee Florida occurred in 2016 [1] Oehrle, et al. (2017) Rosen, et al. (2017) and 2018 [2, 3]. Similar harmful algal blooms (HABs) occur worldwide and rapid assessment of phytoplankton communities is needed to trace of the onset, persistence and demise of such events. Additionally, changes in periphyton and epiphyte communities also require temporal and spatial monitoring.
Millie, et al. [4] stated “High-performance liquid chromatography (HPLC) has proven effective in rapidly separating and distinguishing chlorophylls, chlorophyll-degradation products, and carotenoids within monotypic and mixed algal samples. When coupled with absorbance and/or fluorescence spectroscopy, HPLC can accurately characterize phylogenetic groups and changes in community composition and yield information concerning microalgal physiological status, production, trophic interaction, and paleolimnology/ paleoceanography.”
While only in a very few cases can pigment analyses identify sources to the genus or species level (e.g. gyroxanthin diester from Karenia brevis), the identification to the Division level, or in certain cases to Class [5, 6], can be extremely helpful in monitoring ecosystem changes. The present overview is meant as an introduction to the methods and application of pigment-based chemotaxonomy [7].
Materials and Methods
Phytoplankton samples are routinely collected by inserting an inverted 1L amber bottle to 0.5m and rotating it to fill. The bottle is then sealed and placed on ice for transport to the lab. The use of other devices, such a Niskin or beta-water sampler, can be employed to collect samples at other depths for water column profiling.
Seagrass is harvested by hand while free (z<2m) or SCUBA diving. Seagrass blades are cut near their base with scissors and placed into pre-labelled (site, depth, date) large screw-top test tubes in order to capture any epiphytes that may slough off during handling and then are placed om ice for transport to the shore-based laboratory. Blades are measured for width (w) and length (l) to determine area (A cm2={2xw}xl). The blades are then gently scraped individually into an aluminum ‘pie plate’ using a polyethylene tissue lifter. The seagrass blades and the tissue lifter were then rinsed with water containing 3.5% salt (NaCl) by weight. The epiphytes are then collected by filtration as given below. Fake seagrass (epiphytometers) made of mylar strips fastened to weighted PVC piping and having a small piece of closed cell Styrofoam for blade tip flotation to mimic seagrass swaying in currents can be used as well. This allows an epiphyte mass per unit area estimation using total chlorophyll-a as a biomass proxy. Pigment-based chemotaxonomy then yields the community structure assessment [8].
Periphyton samples are very difficult obtain without also gathering/ extracting the host plants. Scrapping and/or sonication may be used. However, a better assessment of the periphyton communities in freshwater marshes can be obtained by using ‘periphytometers’. Basically, these are microscope slides which have been frosted by sanding with 200 or so grit sandpaper. These are then collected, scrapped akin to tat described for epiphytes above, collected, filtered and extracted [7].
Samples, whether environmental or cultured, are filtered through 47mm Whatman GF/F (0.7mm) filters. The filter is folded twice, blotted between paper towels, wrapped in aluminum foil, and frozen at -80oC until extracted within 24-28 hours. Samples are then extracted in a 10mL glass/Teflon homogenizing grinder while holding the tube in ice to minimize frictional heating during grinding. Extraction was with 5.0 mL of a mixture of Methanol, Acetone, Dimethylformamide, water [8].
One (1.00) mL of a crude extract is then mixed with 0.125 mL (125 L) of an ion-pairing solution [10] consisting of 15.0 g of tetrabutyl-ammonium acetate and 77.0 g of ammonium acetate per liter water total volume water. Prepared extracts are then injected using a Rheodyne 7125 injector and RP-HPLC was performed using a 3.9 x 300 mm Waters NovaPak 4-micron C18 column, developed with a ternary gradient [11] at 1.00mL/min. Solvents are delivered with a Thermo-Separations Products Model 4100 quaternary pump, and chromatograms plus absorption spectra are recorded using a Waters 996 PDA with Empower-2 software.
Numerous known chlorophyll and carotenoid pigments (e.g. Sigma-Aldrich{USA}, C14-DHI {Denmark}) and known phytoplankton species (e.g. UTEX, Bigelow Lab, Sigma-Aldrich) were purchased for QA/QC of chromatographic/spectrophotometric analyses. Copper- mesoporphyrin-IX-DME is used as an internal retention time and absorbance response standard as it does not coelute with any of the pigments of interest.
Results
Two samples (Figures 1 & 2) of phytoplankton (microalgal) pigment-based chemotaxonomic assessments are given here. Both are from samples collected in an estuarine environment on the east coast of southern Florida.
Following the reversed phase high performance liquid chromatography (RP-HPLC) separation of the chlorophyll and carotenoid pigments, the analytical software, Waters Empower-2 in the present case, integrates all peaks at user selected wavelengths. Wavelengths used include 440nm for chlorophylls and most carotenoids, 410nm for pheopigments (Mg-free chlorophyll derivatives), 460nm for echinenone if coeluted with chlorophyll-a-epimer, and 664nm for chlorophyll-a-epimer when echinenone is present. It is noted that absorption maxima of many pigments do not fall exactly at 440nm and absorption corrections need to be made for proper quantification with know extinction coefficients. For example, the maximum absorption of the chlorophyll-a Soret band is at about 432nm so a correction of about 1.4x is required for data obtained at 440nm. Alternately CHLa can be measured at 432 or 662nm directly. Similar adjustments and QA/QC trial runs with known pure standard pigments should be made routinely.
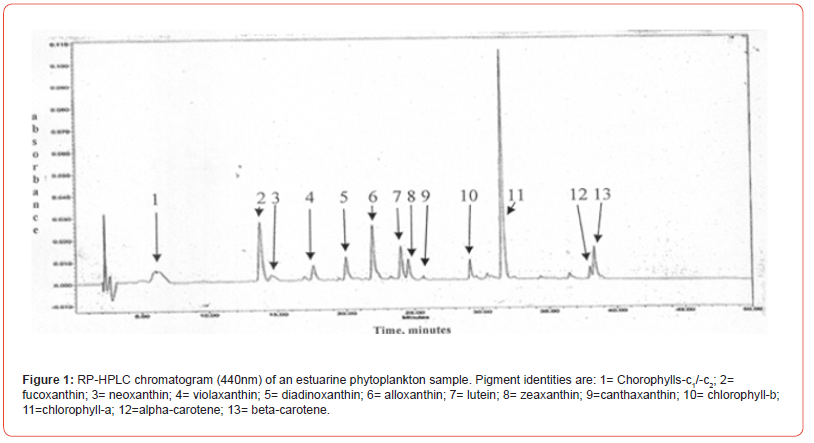
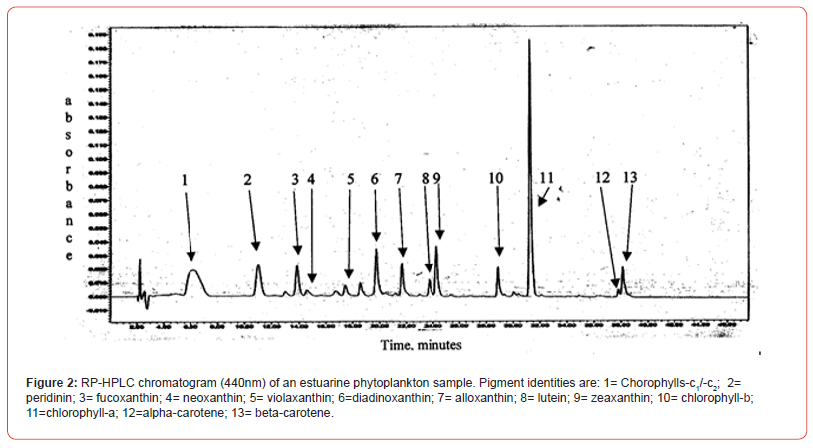
Pigment-based chemotaxonomic taxon (e.g. Division) estimation: Following integration of the peaks, the peak areas (as AU min) are entered into an Excel program for the calculation of pigment yield on both molar and weight bases. Then the amounts of specific biomarker pigments are used to calculate the amount of taxon-specific chlorophyll-a (CHLa). The pigments used for the five divisions considered herein are: zeaxanthin (Zea) for cyanobacteria, chlorophyll- b (CHLb) for chlorophytes, fucoxanthin (Fuco) for diatoms (Chrysophytes), peridinin (Peri) for dinoflagellates, and alloxanthin (Allo) for cryptophytes. It is noted here that the amount of zeaxanthin can be adjusted for minor contributions from other taxa such as chlorophytes. Other estimations may include separating coccoidal from filamentous cyanobacteria by using echinenone for the filamentous types, though many coccoidal types (e.g. Microcystis aeruginosa) also contain echinenone.
The mathematical treatment of pigment data can be performed using the CHEMTAX algorithm [5], the Bayesian Community Estimator [12], or Simultaneous Linear Equations [7, 9, 13]. Expanded details of each method can be found in Louda, et al. [7] and all the references cited therein.
An example of the SLE estimator based here on a molar rather
than weight basis is:
CHLa = (1.1xZEA) + (2.4 x CHLb) + (1.2 x FUCO) + (1.5 x
PERI) + (3.8 x ALLO)
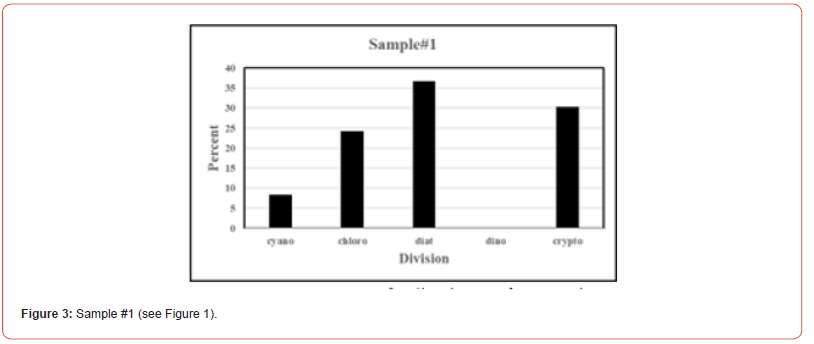
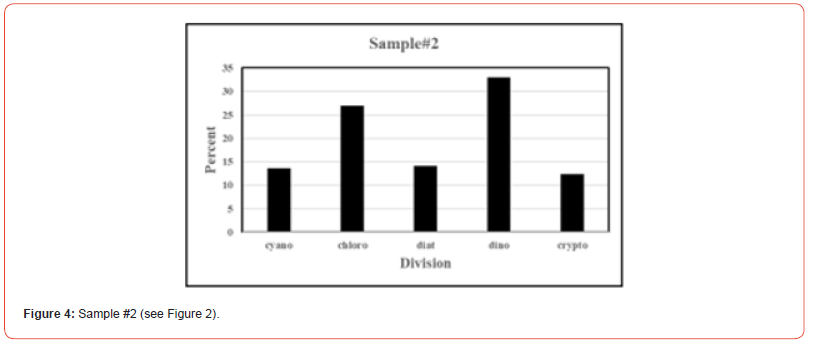
Following such an estimation, a check on the efficiency of taxon- specific CHLa calculation can be made by comparing the estimated taxon CHLa with the total CHLa found in the RP-HPLC run. The output of the SLE estimation is given as percent (%) for each taxon, Divisions in the present case.
Table 1:

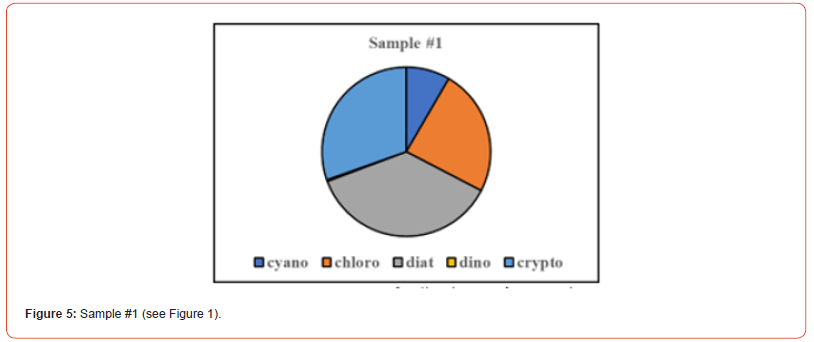
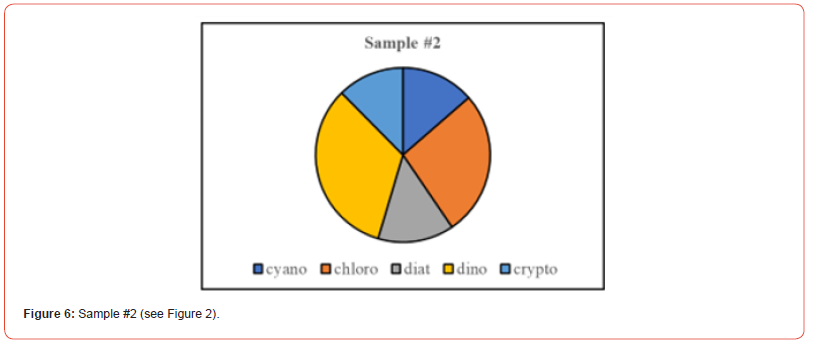
Once the percent taxa (Divisions) are calculated, various visual displays can obviously be made. This includes intera alia charts (Figures 3 & 4) and pie charts (Figures 5 & 6).
Discussion
Pigment-based chemotaxonomy for the rapid assessment of microalgal communities was introduced and reveiwed. The HPLC determination of pigments for the assessment of microalgal, notably phytoplankton, community structure see Chakraborty and Lohrenz, 2015 [7, 9, 14-16], Mackey, et al. (1986) [4,6,10,17-20], Detailed information on the pros and cons of microscopy versus HPLC pigment analyses for community assessment can be found in Havskum, et al. [21]. Certain caveats affecting this methodology need to be considered. The effect of varying light conditions which alter pigment ratios should be considered when assessing a microalgal community [22-24]. Pigment breakdown occurring during cellular senescence-death and/or heterotrophic processing (e.g. zooplankton feeding/fecal pellets) can alter observed ratios. This applies especially to chlorophyll-a itself [11, 25, 26] and therefore integration of the chromatogram at 410nm to calculate the amount of ‘pheopigments’ should be performed. Total CHLa should include chlorophyll-a, chlorophyll-a-epimer, chlorophyll-a-allomers, chlorophyllide- a and pyrochlorophyllide-a. The chlorophyllides are included here since the extract of viable diatoms can active their efficient chlorophyllase enzymes which cleave the phytol side chain.
Conclusion
Pigment-based chemotaxonomy has been shown to be an efficient methodology for the rapid assessment of phytoplankton (see Discussion above), epiphytes [8] and periphyton [7]. This method is especially adaptable to spatial/temporal monitoring and adaptive management scenarios [27].
Acknowledgement
Past (1995-1998, 2003-2011) and present (2018-2025) support of these studies by the South Florida Water Management District is noted and appreciated. External philanthropic donations, both anonymous and known (4Ocean.com), to this research are also noted and appreciated.
Conflict of Interest
No conflict of interest.
References
- Kramer BJ, Davis TW, Meyer KA, Rosen BH, Goleski JA, et al. (2018) Nitrogen limitation, toxin synthesis potential, and toxicity of cyanobacterial populations in Lake Okeechobee and the St. Lucie River Estuary, Florida, during the 2016 state of emergency event. Plos One 13(5): e0196278.
- Dang ED, Arias ME, Tarabih O, Phlips EJ, Ergas SJ, et al. (2023) Modeling temporal and spatial variations of biogeochemical processes in a large subtropical lake: Assessing alternative solutions to algal blooms in Lake Okeechobee, Florida. J Hydrol: Regional Studies 47: 101441.
- Krimsky l, Phlips E, and Havens KE (2018) A response to frequently asked questions about the 2018 Lake Okeechobee, Caloosahatchee and St. Lucie Rivers and Estuaries Algal Blooms EDIS-2018(4): UF/IFAS.
- Millie DF, Paerl HW and Hurley JP (1993) Microalgal pigment assessments using high-performance liquid chromatography: a synopsis of organismal and ecological applications. Can J Fish Aquat Sci 56: 251 3-2527.
- Mackey MD, Mackey DJ, Higgins HW, Wright SW (1996) Chemtax-a program for estimating class abundances from chemical markers: application to HPLC measurements of phytoplankton. Mar Ecol Prog Ser 144:265-283.
- Wright SW, Jeffrey SW, Mantoura RFC, Llewellyn CA, Bjørnland T, et al. (1991) Improved HPLC method for the analysis of chlorophylls and Carotenoids from marine phytoplankton. Mar Ecol Prog Ser 77: 183-196.
- Louda JW, Grant C, Browne J, Hagerthey SE (2015) Pigment-based chemotaxonomy and its application to Everglades periphyton. In: JA Entry, K Jayachandrahan, AD Gottlieb and A Ogram (Eds.) Microbiology of the Everglades Ecosystem. Science Publishers. Chapter 13; pp. 287-347 plus appendices, pp.455-468) and color plate (pp.485). (ISBN 9781498711838)
- Louda JW, Singh-White AG, and Brooks AML (2021) Pigment-based chemotaxonomy of seagrass epiphyte communities; Variables to consider and uses in ecosystem assessment and monitoring. Exam. Mar Biol Oceanogr (EIMBO) ISSN: 2578-031X.
- Hagerthey SE, Louda JW, Mongkronsri P (2006) Evaluation of pigment extraction methods and a recommended protocol for periphyton chlorophyll a determination and chemotaxonomic assessment. J Phycology 42: 1125-1136.
- Mantoura RFC, Llewellyn CA (1983) The rapid determination of algal chlorophyll and carotenoid pigments and their breakdown products in natural waters by reverse-phase high performance chromatography. Anal Chim Acta 151: 297-314.
- Louda JW (2008) Pigment-Based Chemotaxonomy of Florida Bay Phytoplankton; Development and Difficulties. J Liquid Chromatogr Rel Tech 31: 295-323.
- Vanden Meersche K, Soetaert K, Jack J Middelburg JJ (2008) A Bayesian compositional estimator for microbial taxonomy based on biomarkers. Limnol. Oceanogr Methods 6: 190-199.
- Uitz J, Claustre H, Morel A, Hooker SB (2006) Vertical distribution of phytoplankton communities in open ocean: Assessment based on surface chlorophyll. J Geophys Res: oceans 111: CO8005.
- Descy JP, Metens A (1996) Biomass-pigment relationships in potamoplankton. J Plankton Res 18: 1557-1566.
- Descy JP., Sarmento H, Higgins HW (2009) Variability of phytoplankton pigment ratios across aquatic environments. Eur J Phycol 44: 319-330.
- Havens KE, Steinman AD, Carrick HJ, Louda JW, Baker EW (1999) A Comparative analysis of periphyton communities in a subtropical lake using HPLC pigment analysis and microscopic cell counts. Aquatic Sci 61: 307-322.
- Pisani O, Louda JW, Jaffe R (2013) Biomarker assessment of spatial and temporal changes in the composition of flocculent material (floc) in a subtropical wetland. Environ Chem 10: 424-436.
- Schlüter L, Møhlenberg F, Havskum H, Larsen S (2000) The use of phytoplankton pigments for identifying and quantifying phytoplankton groups in coastal areas: testing the influence of light and nutrients on pigment/chlorophyll a ratios. Mar Ecol Prog Ser 192: 49-63.
- Steinman A, Havens KE, Louda JW, Winfree NM, Baker EW (1998) Characterization of the Photoautotrophic Bacterial Communities in a Sub-Tropical Lake (Lake Okeechobee, Florida). Can J Fish Aquat Sci 55: 206-219.
- Wachnika A, Browder J, Jackson T, Louda JW, Kelbe C, et al. (2019) Hurricane Irma’s Impact on Water Quality and Phytoplankton Communities in Biscayne Bay (Florida, USA). Estuaries and Coasts 43: 1217-1234.
- Havskum H, Schlüter L, Scharek R, Berdalet E, Jacquet S (2004) Routine quantification of phytoplankton groups-microscopy or pigment analyses? Mar Ecol Prog Ser 273: 31-42.
- Carnicas E, Jimenez C and Niell FX (1999) Effects of changes of irradiance on the pigment composition of Gracilaria tenuistipitata var. liui Zhang et Xia J Photochem. Photobiol B: Biol 50(2-3): 149-158.
- Demers S, Roy S, Gagnon R, Vignault C (1991) Rapid light-induced changes in cell fluorescence and in xanthophyll-cycle pigments of Alexandrium excavatum (Dinophyceae) and Thalassiosira pseudonana (Bacillariophyceae): a photo-protection mechanism. Mar Ecol Prog Ser 76: 185-193.
- Grant CS, Louda JW (2010) Microalgal pigment ratios in relation to light intensity–Implications for chemotaxonomy. Aquatic Biology 11: 127-138.
- Louda JW, Loitz JW, Rudnick DT, Baker EW (2000) Early diagenetic alteration of chlorophyll-a and bacteriochlorophyll-a in a contemporaneous marl ecosystem. Org Geochem 31 (12): 1561-1580.
- Louda JW, Liu L, Baker EW (2002) Senescence-and death-related alteration of chlorophylls and carotenoids in marine phytoplankton. Org Geochem 33: 1635-1653.
- Eker Develi E, Berthon JF, van der Linde D (2008) Phytoplankton class determination by microscopic and HPLC-CHEMTAX analyses in the southern Baltic Sea. Mar Ecol Prog Ser 359: 69-87.
-
J William Louda*. Assessment of the Microalgal Communities of Phytoplankton, Epiphytes, and Periphyton using Pigment Based Chemotaxonomy. Online J Ecol Environ Sci. 1(3): 2023. OJEES.MS.ID.000513.
-
Chemotaxonomy, High-performance liquid chromatography, Spectroscopy, paleoceanography, paleolimnology, Periphyton, Aluminum foil, Phytoplankton, Chemotaxonomic taxon, Fucoxanthin, Diatoms
-

This work is licensed under a Creative Commons Attribution-NonCommercial 4.0 International License.


