 Research Article
Analysis of the Burden of Cardiovascular Morbidity in Countries with High and Low Levels of Daily Food Consumption
Lyudmila Alexandrovna Radkevich* and Dariya Andreyevna Radkevich
Center for Theoretical Problems of Physicochemical Pharmacology, Russian Academy of Sciences, Russia
Lyudmila Alexandrovna Radkevich, Center for Theoretical Problems of Physicochemical Pharmacology, Russian Academy of Sciences, Moscow, Russia.
Received Date:February 26, 2021; Published Date:March 19, 2021
Abstract
Obesity, like a pandemic, is taking over the world and is a risk factor for many non-communicable chronic diseases (NCD).
Purpose: To evaluate the effect of total daily food consumption (TDC) in different countries on predictors of metabolic syndrome (MS) and the burden of cardiovascular disease in men and women.
Methods and Results: a comparative Mann-Whitney U-criterion analysis of two groups of countries (25 countries per group) with maximum and minimum TDC was performed. It was established:
1. Group 1 countries compared to Group 2 had 5 times higher TDC (p≤0.0001) and 7-18 times higher levels of 7 product groups in TDC (p≤0.0001). The percentages of the 7 product groups in TDC differed between two groups. In Group 1 AP was 12% higher, AB was 8% higher (p≤0.0001). In Group 2 CV was 28% higher (p≤0.0001) and F was 2% higher (p≤0.02).
2. All indicators of the 7 predictors of metabolic syndrome (MS) for men and women were 1.5 to 5-fold higher in the 1st group than in the 2nd group (p≤0.001). The gradient of MS predictors between the 1st and the 2nd group was greater in men than in women.
3. The burden of total cardiovascular morbidity was 2.0 times lower in men (p≤0.007) and 4 times lower in women (p≤0.0001) in group 1 than in group 2. In men, the burden of individual types of cardiovascular diseases (Hypertensive heart disease, Coronary heart disease, Cerebrovascular heart disease, Rheumatoid heart disease, and Inflammatory heart disease) was statistically significantly lower in both men and women in Group 1 compared to Group 2 (p≤0.001). Thus, the burden of all types of cardiovascular diseases in men and women was higher in Group 2. There were definite gender differences in all types of cardiovascular diseases. Moreover, gender differences were clearly visible in Group 1, but practically absent in Group 2.
Conclusion: TDC is a risk factor for MS disorders and the burden of cardiovascular disease in men and women.
Keywords:Food consumption levels; Nutritional structure; Predictors of the Metabolic Syndrome; Burden of cardiovascular diseases
Abbreviations:AB: Alcoholic Drinks; AP: Animal Products; BMI: Body Mass Index, BP: Blood Pressure; C: Cancer; CD: Communicable Maternal Perinatal Diseases; Chol: Blood Cholesterol; CL: Consumption of Selected Foods; D: Disease; EEI: Ecological Efficiency Index; FAO: Food and Agriculture Organization of the United Nations; COPD: Chronic Obstructive Pulmonary Disease; FS: Fruits and Sweeteners; GDP: Domestic Gross Product; Glu: Blood Glucose; HPI: Happiness Index; IHD: Index of Human Development; LPA: Low Physical Activity; M: Male; NCD: Non Communicable Diseases; P: Person; CV: Cereals and Vegetables; RE: Rating Educations; TDC: Total Daily Consumption; UV: Ultraviolet Level
Introduction
Obesity is a risk factor for a number of diseases, including cardiovascular diseases. An endogenous selective estrogen receptor modulator (SERM) hydroxycholesterol (27HC) has been found to be a missing link in the obesity-target organ chain [1]. Hypertension, cardiovascular diseases, stroke, diabetes, heart failure, lung diseases, and obesity have been shown to predispose to increased COVID-19 mortality [2]. Obesity is positively correlated with blood pressure and C-reactive protein HS-CRP [3]. Cardiovascular diseases are the cause of death in patients with nonalcoholic fatty liver disease, which is closely related to insulin resistance, obesity, and diabetes [4]. Since 1948, The Framingham Heart Study has been studying the third generation of participants. These studies put forward two groups of CHD risk factors: non-modifiable and modifiable. Modifiable risk factors: hypertension, hyperlipidemia, diabetes mellitus, obesity, smoking, poor diet, sedentary lifestyle, and stress. Mortality data from 1969 to 2014 concluded that by 2020 the number of cardiovascular diseases will decrease by 21.3% in men and 13.4% in women [5].
Obesity in the United States has become synonymous with heart disease, diabetes, and early death [6]. Inflammation plays a major role in the development of atherosclerotic cardiovascular diseases [7]. Understanding the relationship between diet, stress, mood, and behavior can contribute to the treatment of mental disorders associated with stress and obesity [8]. A contradiction has been found between COVID-19 and vascular diseases and hypertension in sub-Saharan Africa [9]. Heart failure is a complex heterogeneous disease for which pathophysiological understanding remains limited and specific prevention and treatment strategies are lacking [10]. Aging is a major risk factor for many chronic diseases. The exact mechanisms underlying the aging process are not fully elucidated. However, there is increasing evidence that several pathways, such as insulin-like growth factor, autophagy, and nuclear factor play a crucial role in the regulation of aging [11]. Risk factors for COVID-19 with adverse outcomes include obesity, diabetes mellitus, cardiovascular disease, and hyperinsulinemia [12]. About 30% of the U.S. population has hypertension. Hypertension risk factors can be largely controlled by the DASH diet [12]. Obesity is associated with a significant etiologic risk factor for type 2 diabetes, hypertension, cancer, and coronary heart disease. The increase in these diseases has been dramatic, especially in the last 20 years [13]. Obesity negatively affects immune function and the body’s defense against external factors [14]. Intermittent fasting can have an effect through multiple pathways, including reducing oxidative stress, optimizing circadian rhythms and ketogenesis [15]. Insulin resistance is defined as an impaired biological response to insulin stimulation of target tissues, primarily liver, muscle, and adipose tissue. Insulin resistance impairs glucose utilization [16].
Inflammation is a protective reaction activated in response to harmful stimuli by inflammasomes, which are thought to be sensors and receptors of the innate immune system [17]. Obesity is associated with chronic low-grade inflammation and immune dysregulation [18]. COVID-19 infection can lead to hyperinflammatory response through excessive cytokine release — “cytokine storm”. Coronary microvascular dysfunction plays a pathogenetic role in cardiac and systemic microvascular angina [19]. Thus, obesity turns out to be a risk factor for many chronic diseases that lead to aging and reduced life expectancy. Purpose: To evaluate the effect of total daily food consumption (TDC) in different countries of the world on predictors of Metabolic Syndrome (MS) and the burden of cardiovascular diseases in men and women.
Material and Method
Research design
Observation statistical analysis
For the purpose of this work, a database of the total burden of NCDs and cardiovascular diseases (ICD-10 codes), was generated for 25 countries with the maximum daily food consumption rate (TDC) — group 1, and 25 countries with the minimum food consumption rate (TDC) — group 2 countries. Disease burden of disease (DALY) data for men and women (all ages) in 25 countries, standardized by sex and age per 100,000 population, were selected from the 2004 GBD database [20]. A number of indicators were used to characterize “quality of life” (QOL) in countries: per capita income or gross domestic product (GDP) in 2008 (US dollars per person per day) [21]; geographical location of countries by latitude and the level of ultraviolet radiation in the capital (UV) (J/m2 2004) [22]; life expectancy for men (LE) [23]; access to good health care, clean water and clean air [24]; Index of Happiness (IH), or the Internal Gross Happiness in 2016 [25]. Body Mass Index (BMI) ≥25 kg / m2 and ≥30 kg / m2 have been studied as predictors of metabolic syndrome (MSP) — the percentage of men in the country with overweight and obesity; and the percentage of men with blood cholesterol (Chol ≥ 5.0 mmol / l and ≥ 6.2 mmol / l); blood glucose (Glu ≥ 7.0 mmol / l); blood pressure (BP ≥ 140/90 mmHg); with low physical activity (LPA) ≤ 60 min/day walking [26]. Daily Food Consumption Level (TDC) (g / person / day) (47 types of products) for each country was selected from the FAO database for 2003- 2005 [27] (Figure 1).
The nutrition structure (NS) of the countries is presented in the form of 4 blocks in absolute and in percentage of (NS): 1 — products of animal origin (AP); 2 — cereals and vegetables (CV); 3 — fruits and sweeteners (FS); 4 — alcoholic beverages (AB); 5 — vegetable oils (VO); 6 — fish (F). The composition of macro-elements was also analyzed [27].
Statistical analysis of the study results was performed using Mann-Whitney-Wilcoxon U-criterion and Multiple Linear Regression Analysis for Independent Samples (MRA). U is the numerical value of the Mann-Whitney Criterion. The central trend in data distribution in the sample was represented by the median. The dispersion of data in the samples was estimated by means of the quartile range (QR) between the first and the third quartiles, that is between the 25th and 75th percentiles. Level of statistical significance that reflects the degree of confidence in the conclusion about the differences between indicators of 1 and 2 groups of countries. Two levels of accuracy were assessed: (1) p≤0.01 — error probability 1%; (2) p≤0.05 — error probability 5%. All calculations were performed using Stat Soft software.
Result
Analysis of the quality of life in countries with high and low levels of food consumption
Economic-geographic and socio-demographic characteristics of the countries
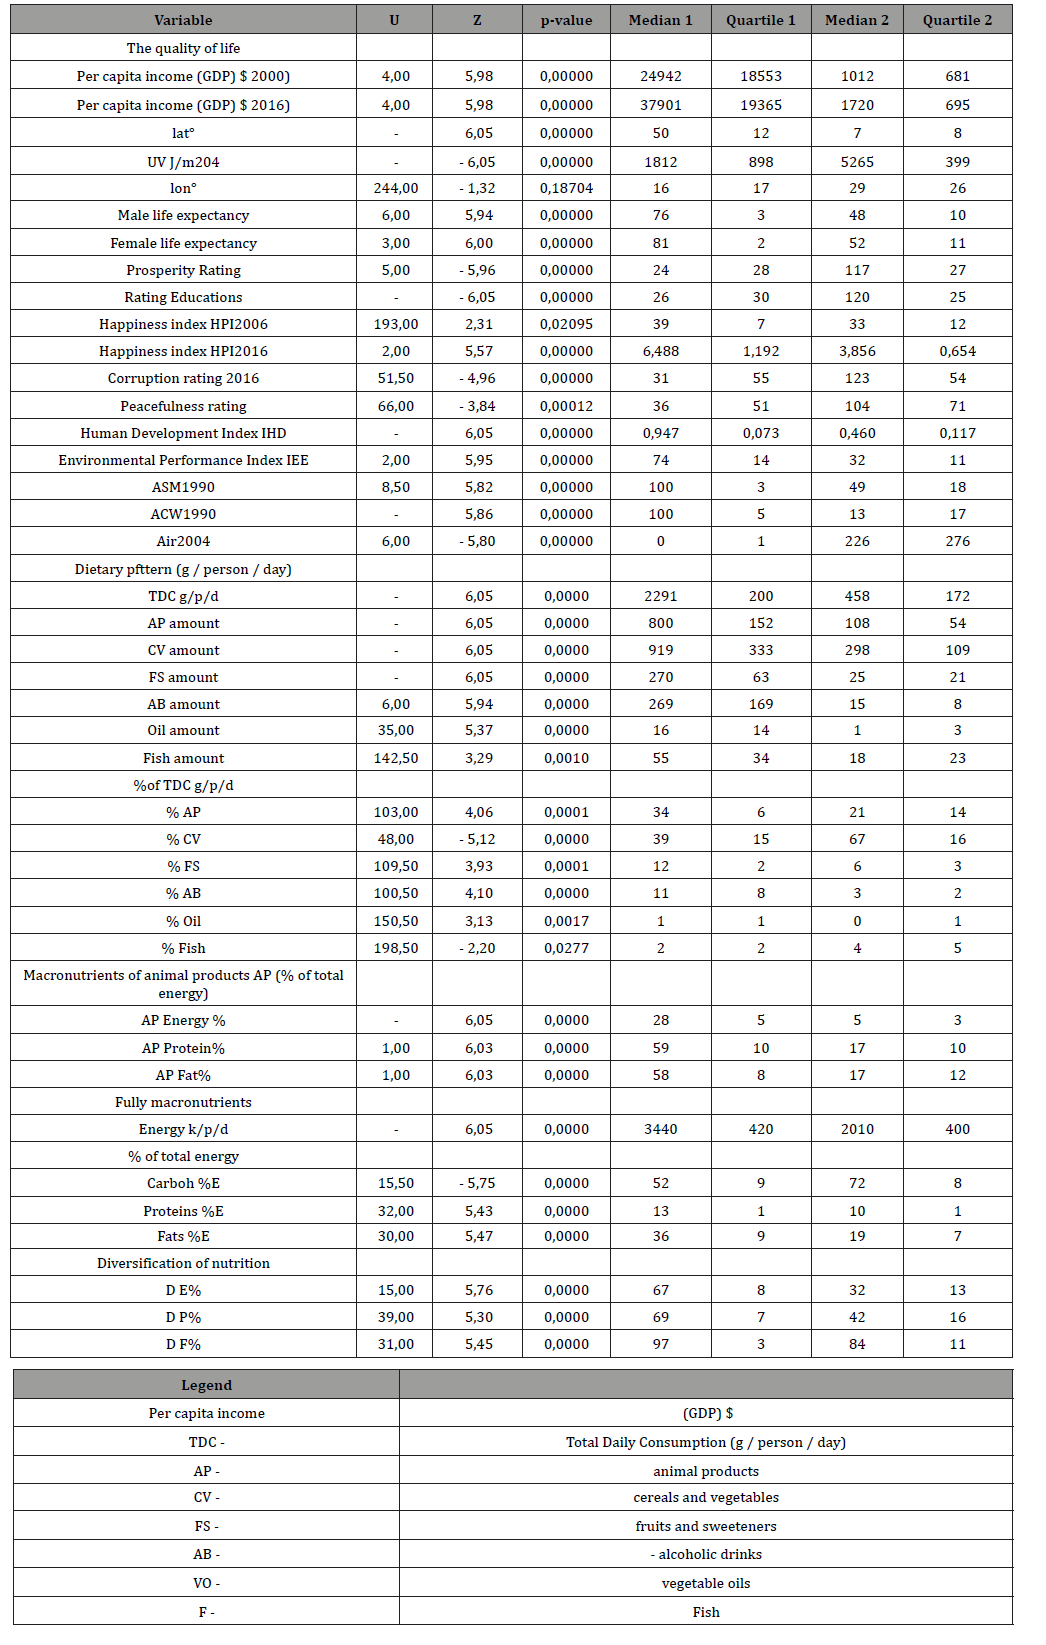
In the 1st group per capita income in 2000 and 2016 was 22 times higher than in the 2nd group (p≤0.0001) (Table 1). Group 1 was 40° north of Group 2 (p≤0,0001). In Group 1 UV level was 2 times lower than in Group 2 (p≤0,0001). Life expectancy (LE) for men and women was 1.6 times higher in Group 1 (p≤0,0001).
The Prosperity Rank and Happiness Index in Group 1 were 4.9 and 1.2 times higher than in Group 2, (p≤0.0001) and (p≤0.021) respectively. The Human Development Index (HDI) and Environmental Performance Index (EPI) were 2 times higher in Group 1 (p≤0.0001). However, the ranks of corruption and peacefulness were 4 and 3 times higher in Group 2 (p≤0.0001). In Group 1 there was 3 times higher access to health care (p≤0.0001), 8 times higher access to clean water (p≤0.0001), and significantly higher access to clean air (p≤0.0001).
Levels of food consumption
Group 1 had 5 times higher total daily food consumption (TDC) (p≤0.0001) (Table 1). Group 1 had 7 times higher consumption of animal products (AP) (p≤0.0001), 3 times higher consumption of cereals and vegetables (CV) (p≤0.0001), 11 times higher consumption of fruits and sweeteners (FS) (p≤0, 0001), 18 times higher consumption of alcoholic beverages (AB) (p≤0.0001), 16 times higher consumption of vegetable oils (VO) (p≤0.0001) and 3 times higher consumption of fish (F) (p≤0.001). Thus, the maximum differences between Group 1 and Group 2 were in the consumption of alcoholic beverages and vegetable oils. However, the percentages in terms of the levels of consumption of individual products differed significantly between Group 1 and Group 2. Thus, Group 1 had on average a 2-fold higher percentage of consumption of animal products, fruits and sweeteners, alcoholic beverages, and vegetable oils (p≤0.0001). Group 2 had a higher percentage of consumption of grains and vegetables and a higher level of fish consumption, (p≤0.0001) and (p≤0.03), respectively (Figure 2).
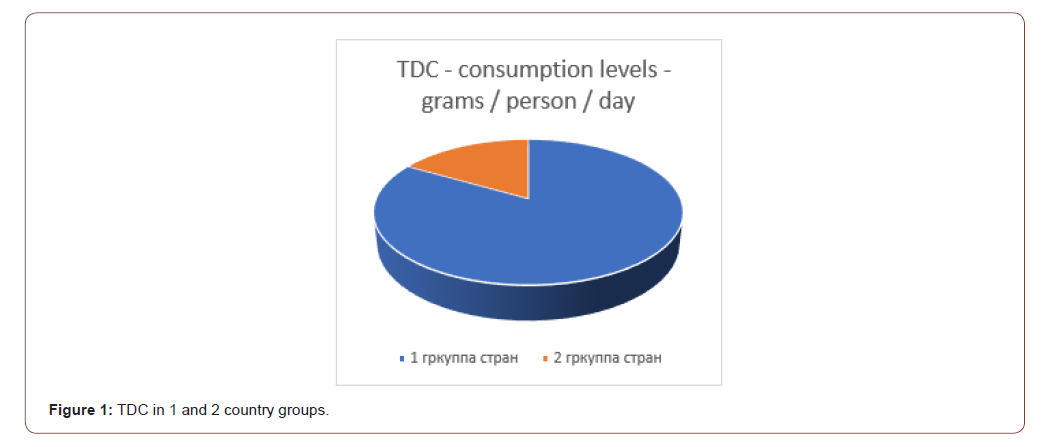
Table 1: Comparative analysis of quality of life and dietary patterns, including nutrients in groups 1 and 2 of countries differing in TDC levels (Manna Whitney U-criterion).
Macro and Micronutrients
Group 1 had 4.6 times higher energy levels of animal products (AP) (p≤0.0001) and 2.5 times higher protein and fat levels of animal products (AP) (p≤0.0001). Group 1 had 1.7 times higher total energy level (p≤0.0001), 1.4 times lower total carbohydrate level (p≤0.0001), 1.3 times higher total protein level p≤0.0001), and 1.9 times higher total fat level (p≤0.0001) than group 2. Group 1 had 5-fold higher levels of micronutrients such as iron of animal products (p≤0.0001), and 1.2-fold higher levels of vitamin A (p≤0.0001). Plant iron levels had no statistical differences between Group 1 and Group 2 (p≤0.0001). Group 1 had on average twice the diversification of total energy, total protein, and total fat compared with Group 2 (p≤0.0001) (Table 1).
Analysis of predictors of metabolic syndrome in countries with high and low levels of food consumption
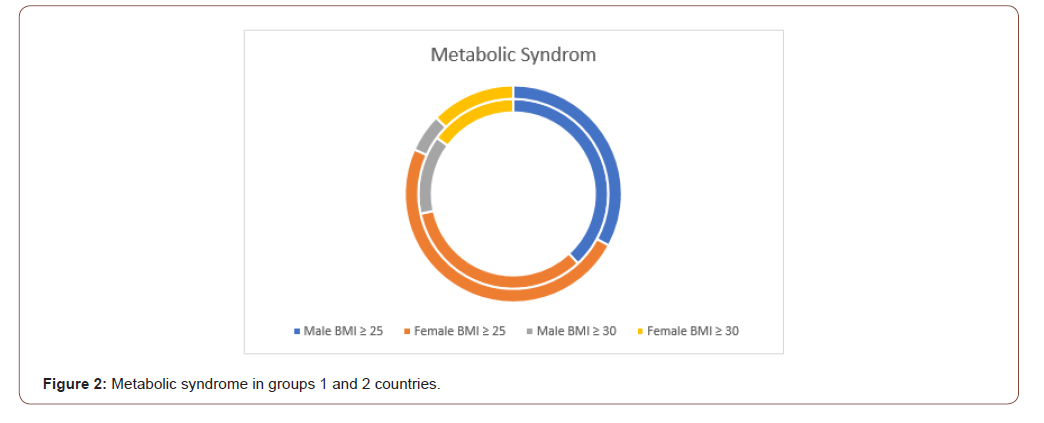
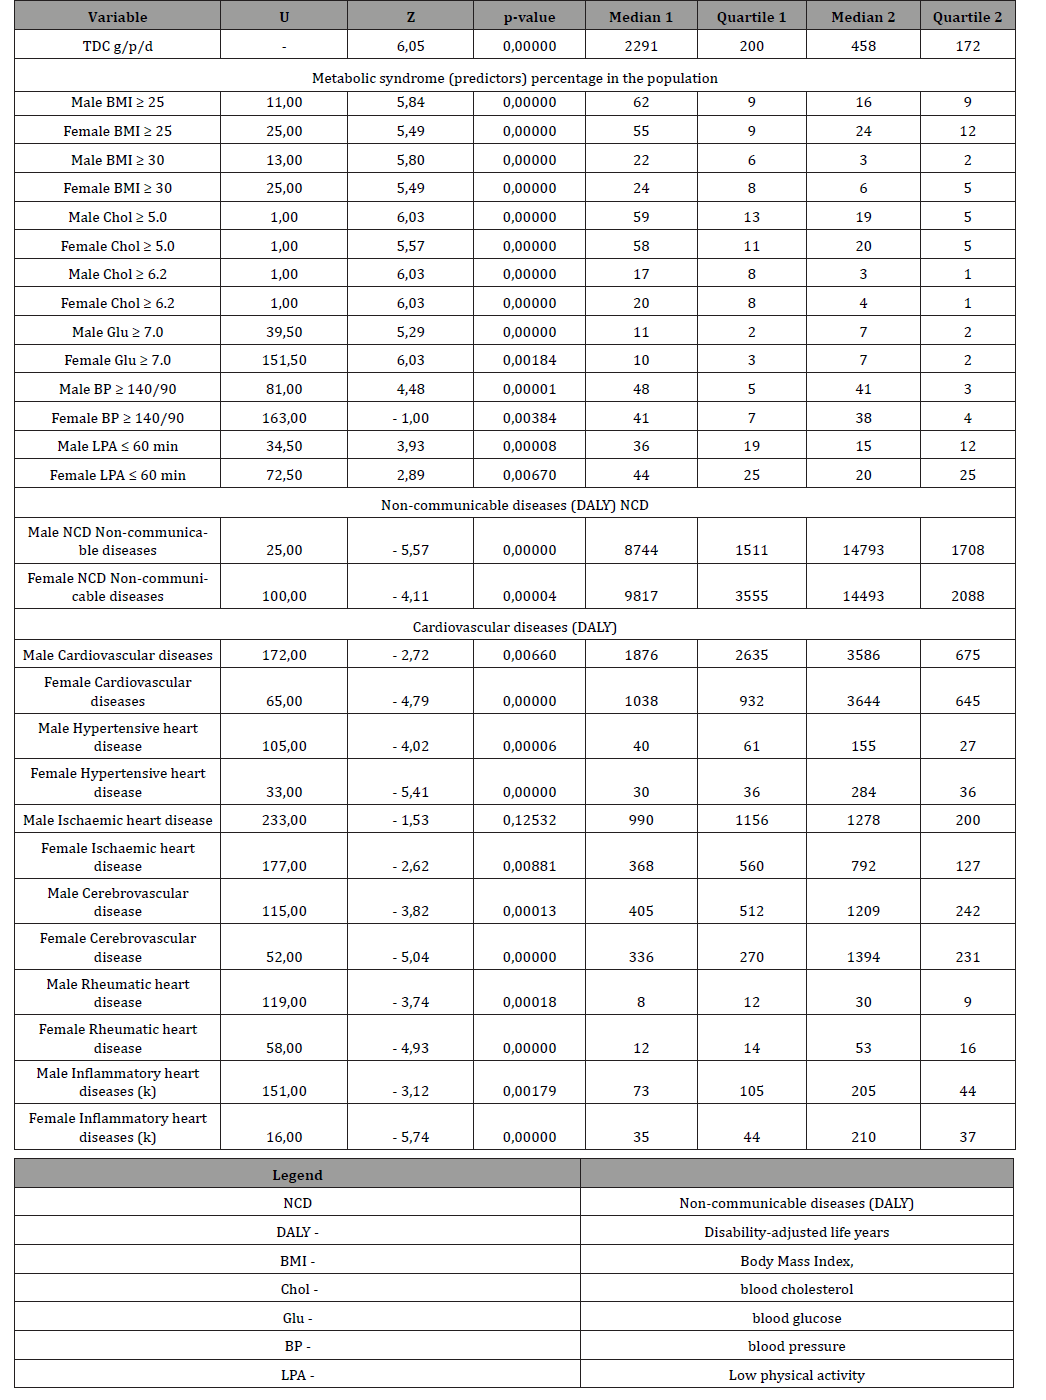
In group 1 there were 4 times as many men and 2 times as many women with overweight (BMI≥25) as in group 2 (p≤0.0001) (Table 2). In group 1 there were 7 times as many men and 4 times as many women with obesity (BMI≥30) as in group 2 (p≤0.0001). In group 1 there were 3.2 times as many men and 2.9 times as many women with hyperlipidemia (Chol. ≥ 5.0) as in group 2 (p≤0.0001). In group 1 there were 5.7 times as many men and 5.0 times as many women with hyperlipidemia (Chol. ≥ 6.2) as in group 2 (p≤0.0001). In group 1 there were 1.6 times as many men and 1.4 times as many women with hyperlipidemia (Chol. ≥ 7.0) as in group 2 (p≤0.0001) and (p≤0,002) respectively. In group 1 there were 1.2 times as many men and 1.1 times as many women with high blood pressure (BP ≥140/90) as in group 2 (p≤0.0001) and (p≤0,004) respectively. In group 1 there were 2.4 times as many men and 2.2 times as many women with low phisical activity (LPA ≤ 60 min) as in group 2 (p≤0.0001) and (p≤0,007) respectively. Thus, for all indicators of predictors of metabolic syndrome, the proportion of men in the populations of Group 1 was higher than in Group 2. The proportion of women in Group 1 populations was also higher than in Group 2. But the gradient of MS predictors between countries in groups 1 and 2 was steeper for men than for women. Therefore, the proportion of MS predictors in women was slightly higher in group 2 than in men in group 2 (6 out of 7). We can conclude that the 5-fold difference in TDC between the 1 and 2 groups of countries had a greater effect on MS for men than for women (Table 2).
Table 2: Comparative analysis of MS predictors and the burden of cardiovascular morbidity in groups 1 and 2 of countries with different levels of TDC (Manna Whitney U-criterion).
Analysis of the burden of cardiovascular morbidity in countries with high and low TDC
The burden of non-communicable chronic diseases (NCD) was 1.5 times lower in men and 1.7 times lower in women in Group 1 than in Group 2 (p≤0.0001) (Table 2). The burden of total cardiovascular diseases was 1.9 times lower in men (p≤0.007) and 3.5 times lower in women (p≤0.0001) in Group 1 compared with Group 2. The burden of hypertensive heart disease was 3.9 times lower in men (p≤0.0001) and 9.5 times lower in women (p≤0.0001) in group 1 compared with group 2. The burden of coronary heart disease was 1.3 times lower in men (p≤0.1) and 2.2 times lower in women (p≤0.009) in group 1 compared with group 2. The burden of Cerebrovascular Heart Disease was 3.0 times lower in men (p≤0.0001) and 4.2 times lower in women (p≤0.0001) in group 1 compared with group 2. The burden of Rheumatoid Heart Disease was 3.8 times lower in men (p≤0.0001) and 4.4 times lower in women (p≤0.0001) in group 1 compared with group 2. The burden of inflammatory heart disease was 2.8 times lower in men (p≤0.002) and 6.0 times lower in women (p≤0.0001) in group 1 compared with group 2. In group 1, the burden of disease in all types of cardiovascular disease was on average 2 times higher in men than in women. In group 2 countries, the burden of disease in all types of cardiovascular disease was on average similar in men and women (Table 2). Thus, the burden of all types of cardiovascular disease in men and women is higher in group 2. For all types of cardiovascular diseases, there are pronounced gender differences. Moreover, gender differences are pronounced in Group 1, but practically absent in Group 2.
Discussion
According to the UN, 836 million people in the world were undernourished in 2015. But 500 million people are obese [28]. Due to population growth, food production will increase by 60% by 2050 [28]. This will lead to a significant increase in the burden of four types of diseases: cardiovascular, respiratory, type 2 diabetes, and cancer [28]. A joint meeting of the UN and WHO in 2014 adopted a declaration on the need to reduce the burden of NCD by one third by 2030 [29]. Obesity covers more than 40% of the population in high-income countries. Most studies and reviews in recent years have focused on obesity, its impact on inflammation processes, NCD, life expectancy, and even COVID-19 [30-34, 39,40, 43-48]. The results of our research showed that in 25 high-income countries the maximum total daily food consumption (TDC) was 5 times higher than the minimum level in 25 low-income countries in 2002-05. Quality of life indicators of the 1st group of countries, on average, were 2 times higher than in the 2nd group of countries. But per capita income in Group 1 was 23 times higher than in Group 2. In general, all MS predictors for both men and women were 2-5 times higher in Group 1 compared to Group 2. Moreover, the severity of MS predictors was lower in women than in men. At the same time more than 50% of men and women in the 1st group had overweight (BMI ≥ 25). More than 20% of population in 25 countries of the 1st group had obesity. Hyperlipidemia (Chol. ≥ 5.0) covered 58% of both men and women in Group 1 (Table 3) (Figure 3).
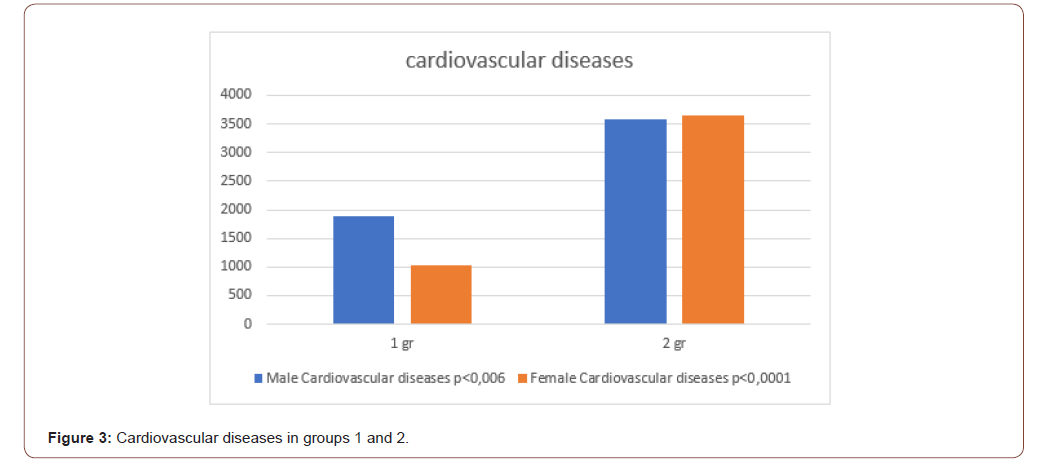
Table 3: Groups of countries 1 and 2.
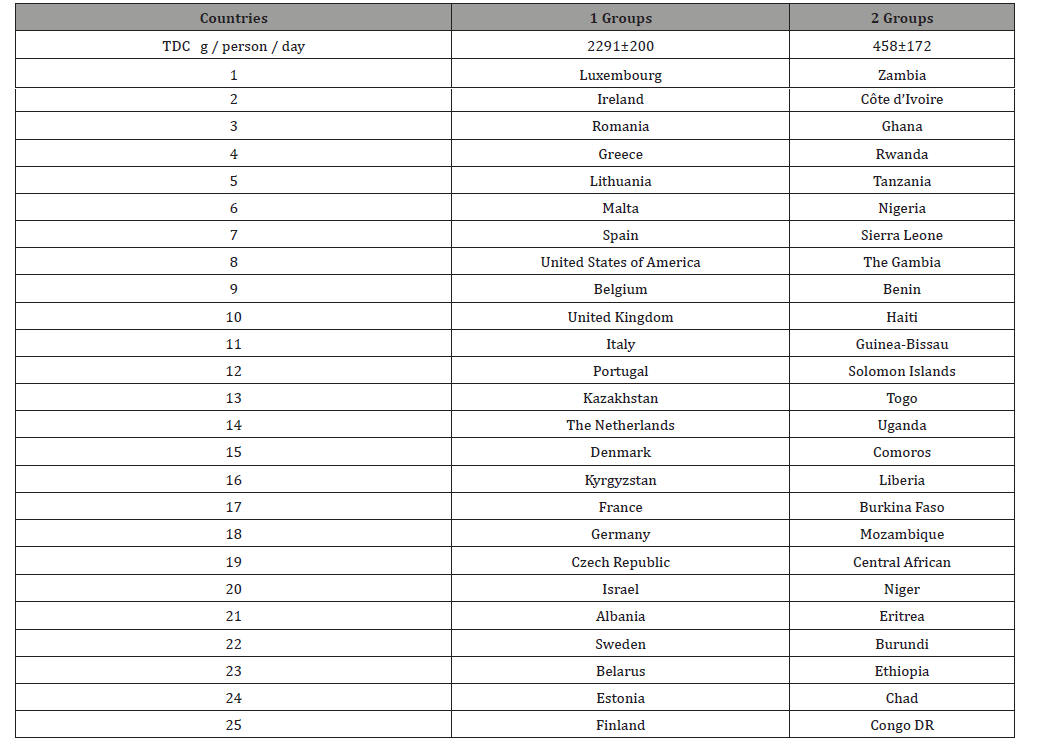
However, both the overall NCD burden and the overall cardiovascular disease burden were 2-fold higher in men and 4-fold higher in women statistically significantly in group 2 with low TDC, virtually with no overweight (20% vs 60%), obesity (4% vs 23%) and other MS predictor disorders in these low-income countries. Thus, high burden of Cardiovascular diseases (Coronary, Hypertensive, Cerebrovascular, Rheumatoid, and Inflammatory heart disease) is significantly higher in low-income countries with low TDC.
We believe that risk factors for a high burden of Cardiovascular disease were low per capita income, poor access to health care, clean water and clean air, high corruption, aggressiveness, and a low Happiness Index. TDC in these countries was meager (460 gr in group 2 vs. 2290 gr in group 1). The TDC of the 2nd group of countries was at 67% carbohydrate (p≤0.0001) and only 10% protein and 16% fat (p≤0.0001). Using linear multiple regression analysis, we found that a decrease in per capita income (independent variable) by $1 in countries reduced TDC (dependent variable) by 2% (p≤0.0001) [49]. An increase in UV (independent variable) in countries by 1 J/m, reduces TDC (dependent variable) by 0.3% (p≤0.0001) [50]. If TDC (independent variable) is increased by 1 J/m, the burden of Hypertensive heart disease (DALY) (dependent variable) is reduced by 5.8% (p≤0.0001) [50].
Thus, TDC decreases in countries according to decreasing per capita income and approaching the equator. We conclude that the observed changes in the burden of the 5 types of cardiovascular disease as well as the 6 predictors of MS in our study occur not only as a result of a fivefold difference in TDC between groups 1 and 2, but also as a result of differences in the dietary patterns in these countries. The COVID-19 pandemic has revealed new aspects of cardiovascular, premorbid diseases, and obesity that have yet to be studied [2, 9, 12, 35, 38, 41, 42].
Conclusion
There are 1.5-5-fold differences in MS predictors and the burden of cardiovascular diseases with gender differences in men and women in the countries with five times difference in TDC.
Acknowledgement
The authors are grateful for the valuable advice on statistical analysis of experimental data to Alexander V. Nemtsov PhD, Head of the Department, Moscow Research Institute of Psychiatry, Russia.
Conflict of Interest
No conflict of interest.
References
- Asghari A, Umetani M (2020) Obesity and Cancer: 27-Hydroxycholesterol, the Missing Link. Int J Mol Sci 21(14): 4822.
- Ahmed S, Gasparyan AY, Zimba O (2021) Comorbidities in rheumatic diseases need special consideration during the COVID-19 pandemic. Rheumatol Int 41(2): 243-256.
- Sabrina Alves Ramos, Adriano de Paula Sabino, Daniela Corrêa Ferreira, Jacqueline Isaura Alvarez-Leite (2012) Obesity with no metabolic syndrome and adipose tissue expansion based solely on risk factors and inflammatory marker of coronary heart disease in premenopausal women. Arch Latinoam Nutr 62(3): 267-274.
- Arslan U, Yenerçağ M (2020) Relationship between non-alcoholic fatty liver disease and coronary heart disease. World J Clin Cases 8(20): 4688-4699.
- Brown JC, Gerhardt TE, Kwon E (2020) Risk Factors For Coronary Artery Disease. In: StatPearls [Internet]. Treasure Island (FL): StatPearls Publishing.
- Benalcazar DA, Cascella M (2020) Obesity Surgery Pre-Op Assessment And Preparation. In: StatPearls [Internet]. Treasure Island (FL): StatPearls Publishing.
- Bigeh A, Sanchez A, Maestas C, Gulati M (2020) Inflammatory bowel disease and the risk for cardiovascular disease: Does all inflammation lead to heart disease. Trends Cardiovasc Med 30(8): 463-469.
- Bremner JD, Moazzami K, Wittbrodt MT, Nye JA, Lima BB, et al. (2020) Diet, Stress and Mental Health. Nutrients 12(8): 2428.
- Chakafana G, Mutithu D, Hoevelmann J, Ntusi N, Sliwa K (2020) Interplay of COVID-19 zand cardiovascular diseases in Africa: an observational snapshot. Clin Res Cardiol 109(12): 1460-1468.
- Cuijpers I, Simmonds SJ, van Bilsen M, Czarnowska E, González Miqueo A, et al. (2020) Microvascular and lymphatic dysfunction in HFpEF and its associated comorbidities. Basic Res Cardiol 115(4): 39.
- Cao L, Lee SG, Lim KT, Kim HR (2020) Potential Anti-Aging Substances Derived from Seaweeds. Mar Drugs 18(11): 564.
- Cooper ID, Crofts CAP, DiNicolantonio JJ, Malhotra A, Elliott B, et al. (2020) Relationships between hyperinsulinaemia, magnesium, vitamin D, thrombosis, and COVID-19: rationale for clinical management. Open Heart 7(2): e001356.
- Challa HJ, Ameer MA, Uppaluri KR (2020) DASH Diet To Stop Hypertension. In: StatPearls [Internet]. Treasure Island (FL): StatPearls Publishing.
- Gutiérrez-Spillari L, Palma MG, Aceituno-Melgar J (2020) Obesity, Cardiovascular Disease, and Influenza: How Are They Connected. Curr Trop Med Rep 6: 1-6.
- Dong TA, Sandesara PB, Dhindsa DS, Mehta A, Arneson LC, et al. (2020) Intermittent Fasting: A Heart Healthy Dietary Pattern. Am J Med 133(8): 901-907.
- Freeman AM, Pennings N (2020) Insulin Resistance. In: StatPearls [Internet]. Treasure Island (FL): StatPearls Publishing.
- Fusco R, Siracusa R, Genovese T, Cuzzocrea S, Di Paola R (2020) Focus on the Role of NLRP3 Inflammasome in Diseases. Int J Mol Sci 21(12): 4223.
- Korakas E, Ikonomidis I, Kousathana F, Balampanis K, Kountouri A, et al. (2020) Obesity and COVID-19: immune and metabolic derangement as a possible link to adverse clinical outcomes. Am J Physiol Endocrinol Metab 319(1): E105-E109.
- Konst RE, Guzik TJ, Kaski JC, Maas AHEM, Elias-Smale SE (2020) The pathogenic role of coronary microvascular dysfunction in the setting of other cardiac or systemic conditions. Cardiovasc Res 116(4): 817-828.
- World Health Organization (2008) The global burden of disease: 2004 update. Geneva.
- United Nations Department of Economic and Social Affairs / Population Division (2009) World Population Prospects.
- World Health Organization (2004) Average daily ambient ultraviolet radiation (UVR) level.
- (2008) Indicator Metadata Registry List Average daily ambient ultraviolet radiation (UVR) level World Population Prospects United Nations.
- Bhaven N Sampat (2009) Academic Patents and Access to Medicines in Developing Countries. Am J Public Health 99 (1): 9-17.
- Gross National Happiness Commission (2019) Royal Government of Bhutan.
- Global Health Observatory (GHO) data (2008) Indicator and Measurement Registry version 1.7.0 BMI≥25; total cholesterol ≥ 5.0; blood glucose≥7.0; insufficiently active. 2008 // WHO (World Health Organization) Percentage of defined population Program.
- Food and Agriculture Organization of the United Nations (2020) Food Balance Sheets 2003-05.
- (2015) Climate change and food security: risks and responses.
- (2018) Global Health Estimates 2016: Disease burden by Cause, Age, Sex, by Country and by Region, 2000-2016. Geneva, World Health Organization.
- Li B, Xia Y, Hu B (2020) Infection and atherosclerosis: TLR-dependent pathways. Cell Mol Life Sci 77(14): 2751-2769.
- Magadum A, Kishore R (2020) Cardiovascular Manifestations of COVID-19 Infection. Cells 9(11): 2508.
- Masood W, Annamaraju P, Uppaluri KR (2020) Ketogenic Diet. In: StatPearls [Internet]. Treasure Island (FL): StatPearls Publishing.
- Martelli A, Testai L, Colletti A, Cicero AFG (2020) Coenzyme Q (10): Clinical Applications in Cardiovascular Diseases. Antioxidants (Basel) 9(4): 341.
- Magdy Beshbishy A, Hetta HF, Hussein DE, Saati AA, C Uba C, et al. (2020) Factors Associated with Increased Morbidity and Mortality of Obese and Overweight COVID-19 Patients. Biology (Basel) 9(9):280.
- Monti CB, Codari M, De Cecco CN, Secchi F, Sardanelli F, et al. (2020) Novel imaging biomarkers: epicardial adipose tissue evaluation. Br J Radiol 93(1113): 20190770.
- Mohammad S, Aziz R, Al Mahri S, Malik SS, Haji E, et al. (201) Obesity and COVID-19: what make obese host so vulnerable. Immun Ageing 18(1): 1.
- Mottola FF, Verde N, Ricciolino R, Di Mauro MD, Migliaccio MG, et al. (2020) Cardiovascular System in COVID-19: Simply a Viewer or a Leading Actor. Life (Basel) 10(9): 165.
- Michalakis K, Ilias I (2020) SARS-CoV-2 infection and obesity: Common inflammatory and metabolic aspects. Diabetes Metab Syndr 14(4): 469-471.
- Naimo GD, Gelsomino L, Catalano S, Mauro L, Andò S (2020) Interfering Role of ERalpha on Adiponectin Action in Breast Cancer. Front Endocrinol (Lausanne) 11: 66.
- Packer M, Lam CSP, Lund LH, Maurer MS, Borlaug BA (2020) Characterization of the inflammatory-metabolic phenotype of heart failure with a preserved ejection fraction: a hypothesis to explain influence of sex on the evolution and potential treatment of the disease. Eur J Heart Fail 22(9): 1551-1567.
- Porzionato A, Emmi A, Barbon S, Boscolo-Berto R, Stecco C, at.al. (2020) Sympathetic activation: a potential link between comorbidities and COVID-19. FEBS J 287(17): 3681-3688.
- Sato S, Mukai Y (2020) Modulation of Chronic Inflammation by Quercetin: The Beneficial Effects on Obesity. J Inflamm Res 13: 421-431.
- R Scaglione, G Parrinello, S Corrao, A Ganguzza, T Di Chiara, et al. (1997) Prevalence of obesity and ischaemic heart disease in hypertensive subjects. Eur Rev Med Pharmacol Sci 1(1-3): 69-75.
- Uusitupa HM, Rasinkangas P, Lehtinen MJ, Mäkelä SM, Airaksinen K, et al. (2020) Bifidobacterium animalis subsp. lactis 420 for Metabolic Health: Review of the Research. Nutrients 12(4): 892.
- Wang D, Zhang Y, Shen C (2020) Research update on the association between SFRP5, an anti-inflammatory adipokine, with obesity, type 2 diabetes mellitus and coronary heart disease. J Cell Mol Med 24(5): 2730-2735.
- Yang J, Stack MS (2020) Lipid Regulatory Proteins as Potential Therapeutic Targets for Ovarian Cancer in Obese Women. Cancers (Basel) 12(11): 3469.
- Radkevich LA, Radkevich DA (2018) Dietary Patterns and Oncological Morbidity in European and Mediterranean Countries. Clin Oncol Res 1(2): 1006.
- Radkevich LA, Radkevich DA (2018) Ecological Determinants of the Happiness Index, Life Expectancy, Incidence and Dietary Patterns in Different Countries. Journal of Obesity and Chronic Diseases 2(1): 26-36.
- Lyudmila Alexandrovna Radkevich, Dariya Andreyevna Radkevich (2020) Study of Non-Communicable Chronic Diseases Structure and Risk Factors in European and Mediterranean Countries. (Population Study) EC Pharmacology and Toxicology 8(12): 32-46.
- Radkevich LA, Radkevich DA (2020) C Comparative Analysis of Economic, Geographic, Social and Nutritional Risk Factors 4 Types of Non-Communicable Chronic Diseases (Melanoma, Multiple Sclerosis, Diabetes Mellitus and Hypertensive Heart Disease) in the Mediterranean and Caribbean Countries (Population Study). J Obes Chronic Dis 4(2): 51-58.
-
Lyudmila Alexandrovna Radkevich, Dariya Andreyevna Radkevich. Analysis of the Burden of Cardiovascular Morbidity in Countries with High and Low Levels of Daily Food Consumption. On J Cardio Res & Rep. 5(1): 2021. OJCRR.MS.ID.000604.
-
Chronic diseases, Metabolic syndrome, Cardiovascular diseases, Hypertensive heart disease, Coronary heart disease, Cerebrovascular heart disease, Rheumatoid heart disease, Inflammatory heart disease, Food consumption levels, Nutritional structure, Blood glucose, Stroke, Diabetes, Heart failure, Lung diseases, Blood pressure, Hypertension
-

This work is licensed under a Creative Commons Attribution-NonCommercial 4.0 International License.


