 Research Article
Analysis of Dietary Patterns and Economic and Geographic Risk Factors for the Burden of Cardiovascular Disease
Lyudmila Alexandrovna Radkevich* and Daria Andreevna Radkevich
Center for Theoretical Problems of Physicochemical Pharmacology, Russian Academy of Sciences, Russia
Lyudmila Alexandrovna Radkevich, Center for Theoretical Problems of Physicochemical Pharmacology, Russian Academy of Sciences, Moscow, Russia.
Received Date:March 25, 2021; Published Date:April 08, 2021
Abstract
The global epidemic of obesity is on the rise and is a risk factor for many non-communicable chronic diseases (NCD).
Purpose: To examine risk factors for the burden of cardiovascular disease (CVD) in men in 50 countries with minimum and maximum morbidity.
Methods and Results: Using the Mann-Whitney U-criterion, a comparative analysis of risk factors in two groups of countries (25 countries per group) with the minimum and maximum burden of CVD in 2004 was performed.
Quality of life: Group 1 had 6 times higher per capita income (p≤0.0001) compared to Group 2. There were no statistically significant differences between Group 1 and Group 2 for geographic latitude (p≥0.7), longitude (p≥0.4), and ultraviolet level (UV) (p≥0.3). Prosperity, health care, education, clean water and air, life expectancy, corruption, happiness, etc. indicated the success of Group 1 countries compared to Group 2 (p≤0.0001).
Burden of CVD morbidity: Group 1 compared to Group 2 had 4 times lower burden of coronary disease (p≤0.0001); 4.5 times lower burden of cerebrovascular disease (p≤0.0001) and 6 times lower burden of hypertension (p≤0.0008). Group 1 had a 2.5-fold lower burden of cirrhosis (p≤0.0008) and no statistical difference in the burden of diabetes mellitus (p≥0.2).
Metabolic syndrome (MS): in Group 1 compared to Group 2 there were 1.2 times higher proportion (%) of men with overweight: (BMI ≥ 25) (p≤0.004); 1.4 times higher proportion (%) of men with obesity: (BMI ≥30) (p≤0.01); 1.6 and 2.0 times higher proportion (%) of men with hyperlipidemia: (Chol. ≥ 5.0) (p≤0.0001), and (Chol. ≥ 6.2) (p≤0.0001); 1.6 times higher proportion (%) of men with low physical activity: (NFA≤ 60 min) (p≤0.01). However, the proportion (%) of men with hyperglycemia (Glu > 7.0) and high blood pressure (BP≥140/90 mm/Hg) were not statistically different in Group 1 and Group 2 (p≥0.8).
Dietary patterns: Group 1 had 1.2 times higher consumption of animal products (AP) (p≥0.02); consumption of cereals and vegetables (CV) was not statistically different (p≥0.2); Group 1 had 2.3 times higher consumption of fruits (FS) (p≤0.0001); 3.5 times higher consumption of alcoholic beverages (AB). Consumption of macronutrients (energy, carbohydrate, protein, and fat) corresponded to food consumption levels. The diversification of nutrients was higher in Group 1.
Conclusion: despite high income rate, high levels of overweight and obesity in Group 1, the burden of CVD and cirrhosis was 4 times higher in low-income countries. The burden of diabetes mellitus was not statistically different between Groups 1 and 2.
Keywords:Food consumption levels; Dietary patterns; Predictors of Metabolic Syndrome; Burden of cardiovascular diseases; Diabetes; Cirrhosis
Abbreviations:AB: Alcoholic Beverages; AP: Animal Products; BMI: Body Mass Index; BP: Blood Pressure; CVD: Cardiovascular Disease; CD: Communicable maternal perinatal Diseases Chol - blood cholesterol; CL: Consumption Level of selected foods; EEI: Ecological Efficiency Index; FAO: Food and Agriculture Organization of the United Nations; FS: Fruits and Sweeteners; GDP: Gross Domestic Product; Glu: Blood Glucose; HPI: Happiness Index; IHD: Index of Human Development; LPA: Low Physical Activity; M: Male; NCD: Non-Communicable Diseases: P: Person; CV: Cereals and Vegetables; RE: Rating Educations; TCL: Total Daily Consumption; Type 2 diabetes: T2DM; UV: Ultraviolet level
Introduction
Cardiovascular diseases (CVD) are the main cause of death worldwide. The prevalence of CVD is increasing in both developing and developed countries [1]. Currently, almost one third of the world’s population is physically inactive, which poses a public health problem by the growing evidence of the link between lifestyle and the increasing prevalence of obesity, CVD, and diabetes [2]. Treatment of obesity and CVD is one of the complex problems of our time. Weight reduction is proposed as a therapy for metabolic syndrome (MS). Among various diets, ketogenic diets, lowcarbohydrate, and high-fat and/or high-protein diets have become popular in the fight against obesity, MS, and CVD [3]. A statement from the American Heart Association points to the influence of risk factors for CVD as early as in childhood, including obesity, hypertension, and type 2 diabetes mellitus [4]. CVD continues to be the leading cause of death among women in the United States [5]. Obesity reaches epidemic proportions and affects all socioeconomic and ethnic groups. Increased fat mass is considered an important risk factor for CVD and type 2 diabetes. However, there is variation in predicting cardio-metabolic diseases (CMD) risks for fat mass. Adipose tissue mass is important for visceral fat mass, a determinant of CMD [6-8]. The high prevalence of vitamin D deficiency in the population and the identification of the vitamin D receptor in the heart and blood vessels had generated interest in the potential cardiovascular effects of vitamin D. However, vitamin D supplementation has not been associated with a lower risk of CVD [9-15]. The economic status and accessibility of medical services are important in the incidence and mortality of CVD [16-19].
Purpose
Study of quality of life, including dietary patterns and predictors of metabolic syndrome, in two groups of countries (25 countries per group) with minimal and maximal burden of CVD.
Material and Method
Research design: observation statistical analysis.
For the purpose of this work, a database of the total burden of infectious diseases (ID), non-communicable diseases (NCD), and cardiovascular diseases: coronary heart disease, cerebrovascular heart disease, hypertensive heart disease, rheumatoid heart disease, and inflammatory heart disease (ICD-10 codes) was formed for 25 countries with a minimum morbidity, and for 25 countries with a maximum morbidity. In addition, premorbid diseases were examined: diabetes mellitus and liver cirrhosis. Disease burden (DALY) data for men (all ages) in 25 countries, standardized by sex and age per 100,000 population, were selected from the GBD 2004 database [20]. A number of indicators were used to characterize “quality of life” (QOL) in countries: per capita income or gross domestic product (GDP) in 2008 (US dollars per person per day) [21]; geographical location of countries by latitude and the level of ultraviolet radiation in the capital (UV) (J/m2 2004) [22]; life expectancy for men (LE) [23]; access to good health care, clean water and clean air [24]; Index of Happiness (IH), or the Internal Gross Happiness in 20s [25]. Body Mass Index (BMI) ≥25 kg / m2 and ≥30 kg / m2 have been studied as predictors of metabolic syndrome (MSP) — the percentage of men in the country with overweight and obesity; and the percentage of men with blood cholesterol (Chol ≥ 5.0 mmol / l and ≥ 6.2 mmol / l); blood glucose (Glu ≥ 7.0 mmol / l); blood pressure (BP ≥ 140/90 mmHg); with low physical activity (LPA) ≤ 60 min/day walking [26]. Daily Food Consumption Level (TDC) (g / person / day) (47 types of products) for each country was selected from the FAO database for 2003- 2005. [27].
The nutrition structure (NS) of the countries is presented in the form of 4 blocks in absolute and in percentage of (NS): 1 — products of animal origin (AP); 2 — cereals and vegetables (CV); 3 — fruits and sweeteners (FS); 4 — alcoholic beverages (AB); 5 — vegetable oils (VO); 6 — fish (F). The composition of macro-elements was also analyzed [27].
Statistical analysis of the study results was performed using Mann-Whitney-Wilcoxon U-criterion and Multiple Linear Regression Analysis for Independent Samples (MRA). U is the numerical value of the Mann-Whitney Criterion. The central trend in data distribution in the sample was represented by the mediana.
The dispersion of data in the samples was estimated by means of the quartile range (QR) between the first and the third quartiles, that is between the 25th and 75th percentiles. Level of statistical significance that reflects the degree of confidence in the conclusion about the differences between indicators of 1 and 2 groups of countries. Two levels of accuracy were assessed: (1) p≤0.01 — error probability 1%; (2) p≤0.05 — error probability 5%.
Result
Quality of life
Group 1 had 6 times higher per capita income (p≤0.0001) compared to Group 2. There were no statistically significant differences between Group 1 and Group 2 for geographic latitude (p≥0.7), longitude (p≥0.4), and ultraviolet level (UV) (p≥≤0.3) Table 1. The level of prosperity and peacefulness was 3 times higher in Group 1 (p≤0.0001). The level of corruption was 5 times lower in Group 1 (p≤0.0001). Group 1 had 1.3 times higher Human Development Index (HDI) and Environmental Efficiency (EE) (p≤0.0001). Group 1 had 15% better health care, access to clean water and clean air (p≤0.0001) Table 1. Group 1 had 12 years higher life expectancy (LE) for men and 9 years higher for women (p≤0.0001). Consequently, Group 1 had a 3-year lower gender difference between male and female life expectancy Table 1. The Happiness Index in Group 1 increased from 12% to 25% from 2006 to 2016 compared to Group 2 (p≤0.008) and (p≤0.0001), respectively Table 1. Thus, countries in Group 1 were more successful than in Group 2.
The burden of cardiovascular and premorbid diseases
Group 1 had an 11-fold lower total burden of infectious diseases (ID) than Group 2 (p≤0.0001) Table 1 & Figure 1. Group 1 had 1.8 times lower total burden of non-communicable diseases (NCD) (p≤0.0001). Group 1 had a 4-fold lower overall burden of cardiovascular diseases (p≤0.0001) compared to Group 2 Table 1. Group 1 had 4 times lower burden of coronary heart disease (p≤0.0001); 4.5 times lower burden of cerebrovascular heart diseases (p≤0.0001); 6 times lower burden of hypertensive heart disease (p≤0.0001); 7 times lower burden of rheumatoid heart disease (p≤0.0001) and 4 times lower burden of inflammatory heart disease (p≤0.0001) compared to Group 2. Diabetes mellitus and liver cirrhosis were chosen as the pre-morbid conditions Table 1. The burden of diabetes mellitus was not statistically different in Group 1 and Group 2 (p≥0.2). Group 1 had a 2.5-fold lower burden of cirrhosis (p≤0.0008) Table 1. Thus, the burden of CVD and premorbid conditions in Group 1 was 2-4 times lower than in Group 2.
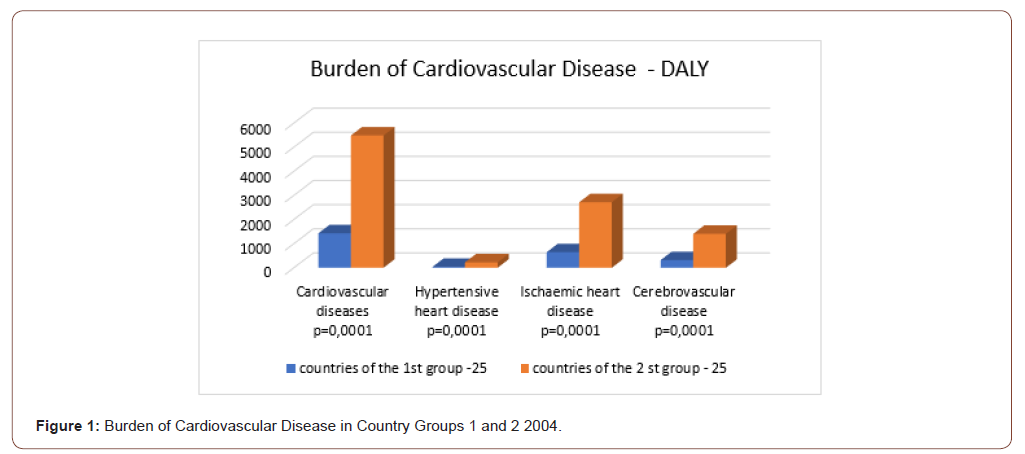
Table 1: Comparative analysis of quality of life and the burden of cardiovascular diseases, diabetes mellitus, liver cirrhosis and MS predictors groups 1 and 2 of countries differing (Manna Whitney U-criterion).
Metabolic syndrome
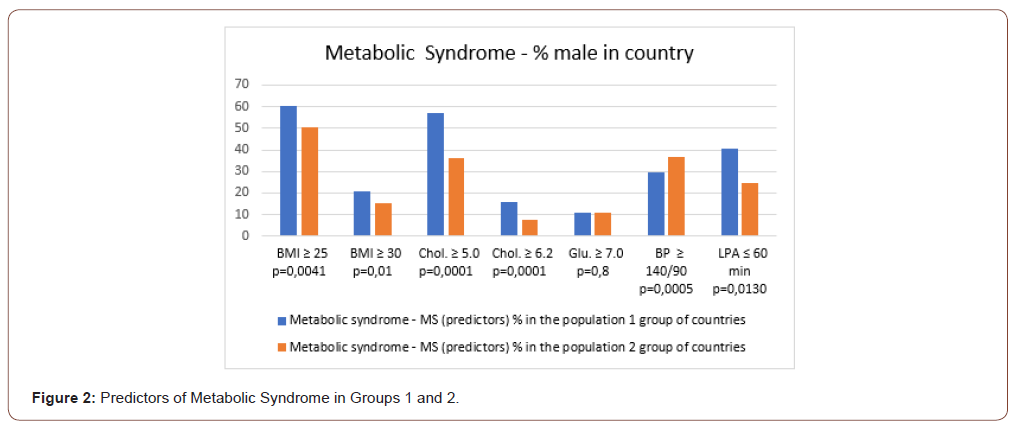
There were 1.2 times higher proportion (%) of overweight men in Group 1 compared with Group 2: (BMI ≥25) (p≤0.004); 1.4 times higher proportion (%) of men with obesity: (BMI ≥30) (p≤0.01); 1.6 times and 2.0 times higher proportion (%) of men with hyperlipidemia: (Chol. ≥ 5.0) (p≤0.0001) and (Chol. ≥ 6.2) (p≤0.0001). Group 1 had a 1.6-fold higher proportion (%) of men with low physical activity: (LPA≤60 min) (p≤0.01) Table 1, Figure 2. However, the proportion (%) of men with hyperglycemia (Glu ≥7.0) and elevated BP (BP≥140/90 mm/Hg) were not statistically different in Group 1 and Group 2 (p≥0.8) and (p≥0.2), respectively Table 1. So, predictors of MS were mostly higher in Group 1: BMI, hyperlipidemia, and LPA. However, BP and hyperglycemia predictors were statistically similar in the 1st and the 2nd country groups Table 1.
Dietary patterns
Consumption levels
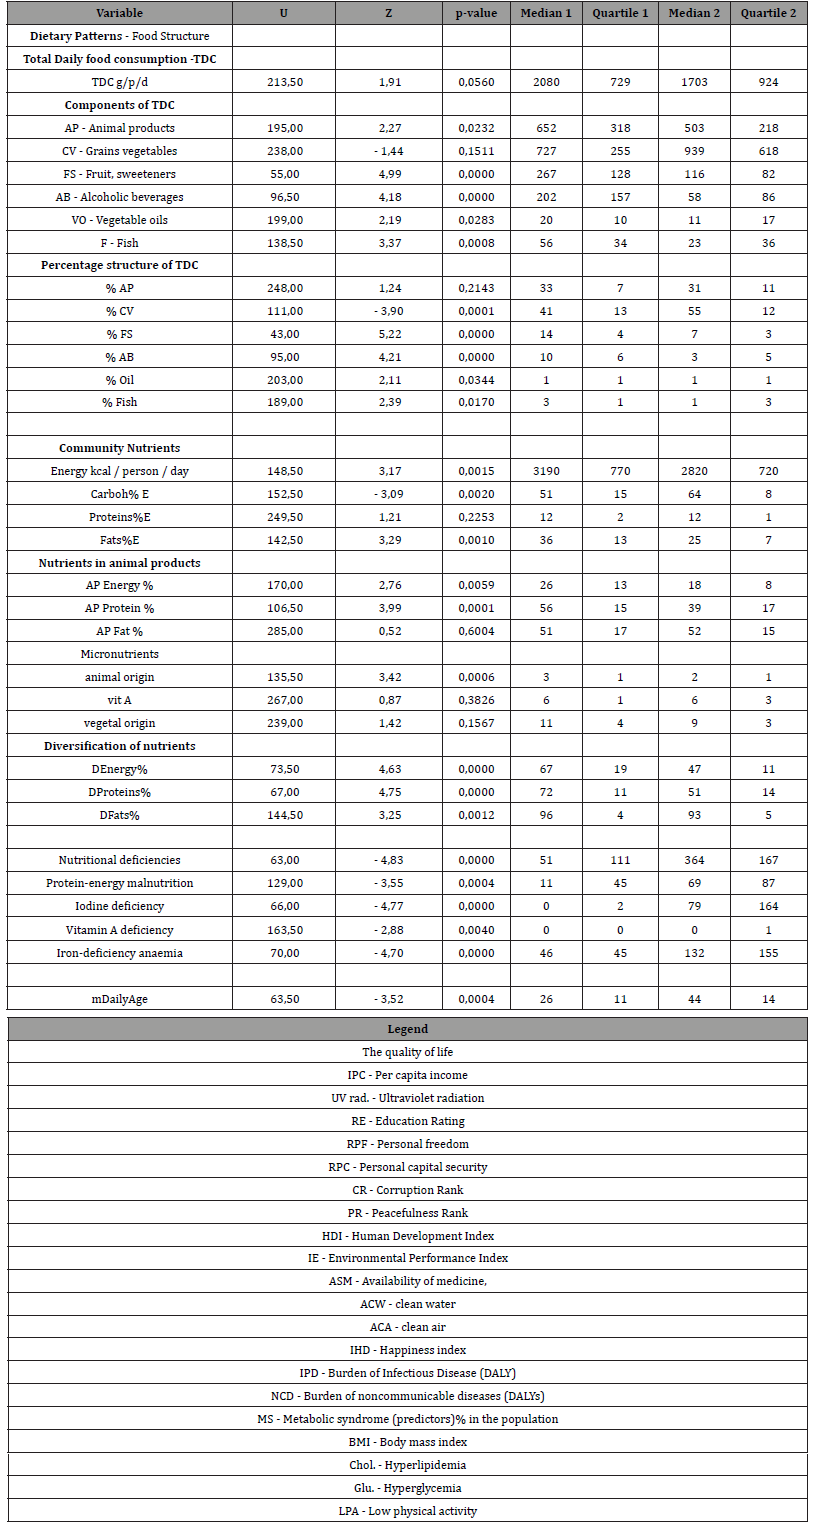
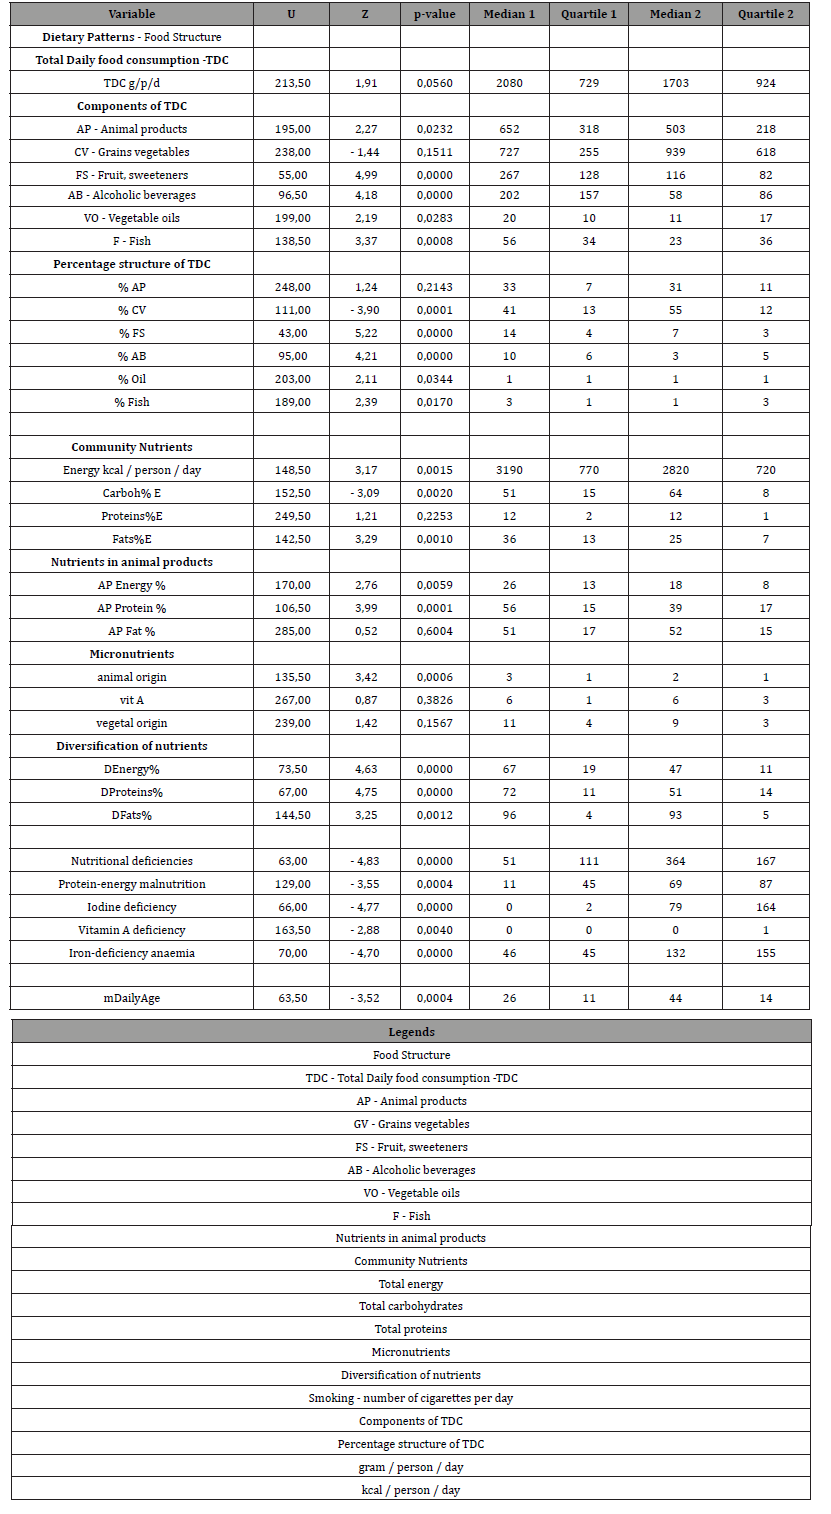
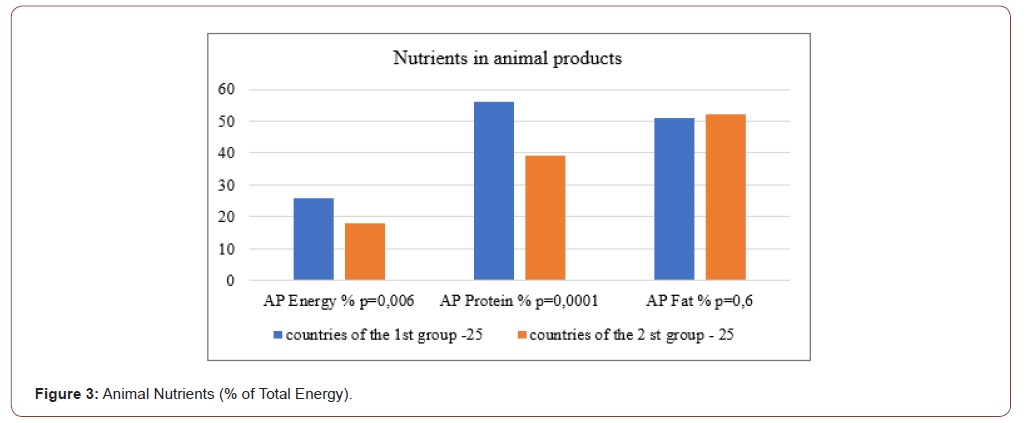
There was no statistically significant difference in TDC (p≥0.06) in Group 1 compared to Group 2 Table 2 & Figure 3. Group 1 compared to Group 2 had 1.2 times higher consumption of animal products (AP) (p≤0.02); 1.3 times lower consumption of cereals and vegetables (CV), but statistically insignificant (p≥0.2); 2.3 times higher consumption of fruits and sweeteners (FS) (p≤0.0001); 3.5 times higher consumption of alcoholic beverages (AB); 1.8 times higher consumption of vegetable oils (VO) (p≤0.03); 2.4 times higher fish consumption (F) (p≤0.0008) Table 2. Thus, the consumption of AP, FS, AB, VO and F was higher in Group 1. At the same time, TDC and CV were the same in Group 1 and Group 2. The percentage of TDC was significantly different in Group 1 compared to Group 2, with the exception of % of AP, which was not statistically different between two groups of countries. Group 1 had 1.5-fold lower consumption of cereals and vegetables and 2 times higher consumption of fruits and alcoholic beverages.
Table 2: Comparative analysis of dietary patterns, levels of food and nutrient consumption in groups 1 and 2 of countries (Manna Whitney U-criterion).
Nutrients
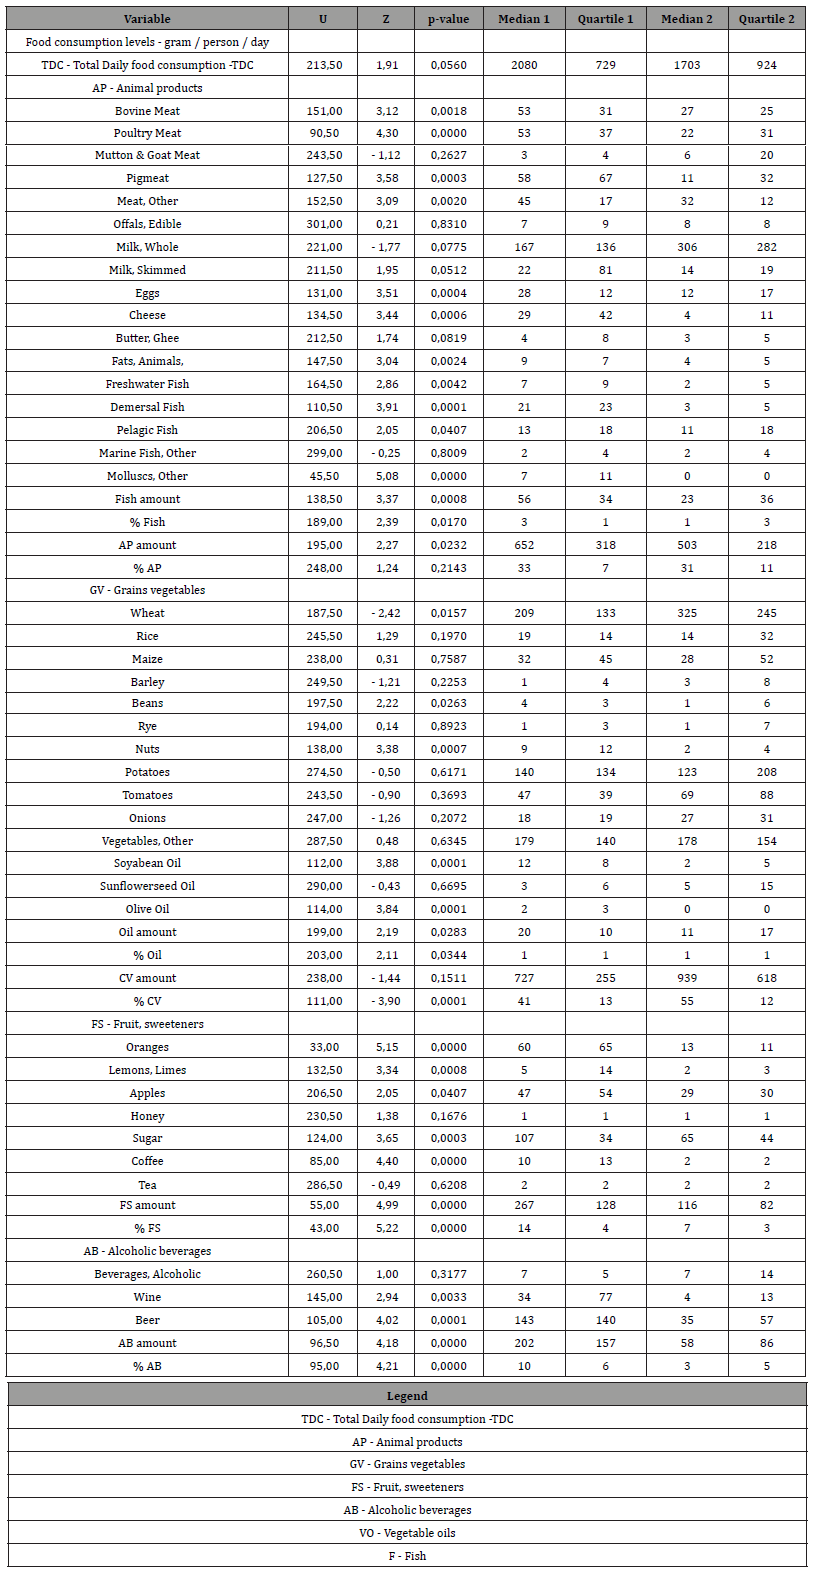
Group 1 had 1.13 times higher total energy (p≤0.002); 1.25 times lower total carbohydrate (p≤0.002); no statistically different total protein level (p≥0.05); and 1.44 times higher total fat level (p≤0.001) Table 2 & Table 3. Group 1 had 1.4 times higher level of animal product’s energy (p≤0.006); 1.5 times higher level of animal proteins (p≤0.0001) and no statistically different level of animal fats (p≥0.5) compared to Group 2. Group 1 had 1.6 times higher level of iron of animal products (p≤0.0006). Group 1 had 1.3 times higher level of diversification of total energy, proteins and fats (p≤0.01). Group 1 had 1.6 times higher level of iron of animal products (p≤0.001). So, Group 1 compared to Group 2 had the same total daily consumption (TDC) and the level of consumption of grains and vegetables (CV). However, all other parts of TDC (AP, FS, AB, VO, F) was higher than in Group 2 by 2 times in average. The percentages of TDC parts were different between Group 1 and Group 2. The greatest difference between country groups was in alcohol consumption (AB). In Group 1 consumption of AB was 3.5 times higher than in Group 2.
Table 3: Diet structure - Consumption levels of selected food items in country groups 1 and 2 (Manna Whitney U-criterion).
Discussion
Obesity is taking over the world like a pandemic and it is a risk factor for many non-communicable chronic diseases (NCD). NCDs and NCD-related deaths cause large financial losses in high-, middle-, and low-income countries. Health care costs associated with NCD vary by country, region, and type of NCD. The cost of treatment increases with the severity of the disease. Little information is available on the true economic burden of NCD in low- and middleincome countries (LMI) [28, 29]. Recent population-based studies demonstrate an increasing burden of cardiovascular diseases (CVD) and related risk factors in sub-Saharan Africa [30]. Weight changes are accompanied by an imbalance between caloric intake and expenditure. The different components of energy balance are dynamically linked. Weight loss is counteracted by equilibrium of physiological processes.
Low-carbohydrate diets have been proposed to increase energy expenditure and promote fat loss. Energy expenditure (26 kcal/ day) and fat loss (16 g/day) were higher with low-fat diets [31]. The results of ketogenic diets regarding the effect of diets on CVD risk factors are inconsistent [3]. Circadian rhythms have been noted in the prevalence of some cardiac and cerebrovascular events [32- 39]. Mediterranean diet and intermittent fasting reduce CVD and increase control of body weight and dyslipidemia [40]. Studying the role of melatonin opens new ways to reduce obesity and risk of CVD [41-43]. The discovery of the genetic basis (14 genes) of circadian rhythms (Nobel Prize 2017) has expanded the knowledge and possibilities of their regulation [44-52].
Our results showed that the burden of overweight, obesity and hyperlipidemia was 1.4 times higher in countries with a high quality of life than in countries with 6 times lower income. Consumption of animal products (AP), fruits (FS), vegetable oils (VO), including olive oil, and alcoholic beverages (AB) was 2.5 times higher in high-income countries. In addition, the ratio of parts of daily consumption (TDC) was different in the two groups of countries. However, the burden of CVD was 2-4 times lower in Group 1 than in Group 2 (low-income countries). Despite high rates of overweight and obesity, the burden of CVD and cirrhosis was 4 times higher in lower-income countries. And the burden of diabetes was not statistically different between Group 1 and Group 2. We observed that samples of 30 to 10 countries in the groups with minimum and maximum burden of CVD are always statistically different in income, but do not differ in latitude, longitude, or UV. The burden of diabetes mellitus, regardless of the number of countries in these samples is always not statistically different between the 1st and the 2nd country groups.
Conclusion
Despite high rates of income and obesity in Group 1, the burden of CVD and cirrhosis was 4 times higher in low-income countries. The burden of diabetes mellitus was not statistically different between Groups 1 and 2.
Acknowledgement
The authors are grateful for the valuable advice on statistical analysis of experimental data to Alexander V. Nemtsov PhD, Head of the Department, Moscow Research Institute of Psychiatry, Russia.
Conflict of Interest
No conflict of interest.
References
- Balakumar P, Maung UK, Jagadeesh G (2016) Prevalence and prevention of cardiovascular disease and diabetes mellitus. Pharmacol Res 113(Pt A): 600-609.
- Arocha Rodulfo JI (2019) Sedentary lifestyle a disease from xxi century. Clin Investig Arterioscler 31(5): 233-240.
- Kosinski C, Jornayvaz FR (2017) Effects of Ketogenic Diets on Cardiovascular Risk Factors: Evidence from Animal and Human Studies. Nutrients 9(5): 517.
- Shakira F Suglia, Karestan C Koenen, Renée Boynton-Jarrett, Paul S Chan, Cari J Clark, et al. (2018) Childhood and Adolescent Adversity and Cardiometabolic Outcomes: A Scientific Statement From the American Heart Association. Circulation 137(5): e15-e28.
- Garcia M, Mulvagh SL, Merz CN, Buring JE, Manson JE (2016) Cardiovascular Disease in Women: Clinical Perspectives. Circ Res 118(8): 1273-1293.
- Stefan N (2020) Causes, consequences, and treatment of metabolically unhealthy fat distribution. Lancet Diabetes Endocrinol 8(7): 616-627.
- O'Neill S, O'Driscoll L (2015) Metabolic syndrome: a closer look at the growing epidemic and its associated pathologies. Obes Rev16(1): 1-12.
- Ribeiro AL, Duncan BB, Brant LC, Lotufo PA, Mill JG, et al. (2016) Cardiovascular Health in Brazil: Trends and Perspectives. Circulation 133(4): 422-433.
- Manson JE, Cook NR, Lee IM, Christen W, Bassuk SS, et al. (2019) Vitamin D Supplements and Prevention of Cancer and Cardiovascular Disease. VITAL Research Group. N Engl J Med 380(1): 33-44.
- Zittermann A, Pilz S (2019) Vitamin D and Cardiovascular Disease: An Update. Anticancer Res 39(9): 4627-4635.
- Wang TJ (2016) Vitamin D and Cardiovascular Disease. Annu Rev Med 67: 261-272.
- Pilz S, Verheyen N, Grübler MR, Tomaschitz A, März W (2016) Vitamin D and cardiovascular disease prevention. Nat Rev Cardiol 13(7): 404-417.
- Skaaby T, Thuesen BH, Linneberg A (2017) Vitamin D, Cardiovascular Disease and Risk Factors. Adv Exp Med Biol 996: 221-230.
- Al Mheid I, Quyyumi AA (2017) Vitamin D and Cardiovascular Disease: Controversy Unresolved. J Am Coll Cardiol 70(1): 89-100.
- Apostolakis M, Armeni E, Bakas P, Lambrinoudaki I (2018) Vitamin D and cardiovascular disease. Maturitas 115: 1-22.
- Nitsa A, Toutouza M, Machairas N, Mariolis A, Philippou A, et al. (2018) Vitamin D in Cardiovascular Disease. In Vivo 32(5): 977-981.
- Mehta SR, Wood DA, Storey RF, Mehran R, Bainey KR, et al. (2019) Complete Revascularization with Multivessel PCI for Myocardial Infarction. Engl J Med 381(15): 1411-1421.
- Dadgar I, Thor Norström (2020) Is there a link between cardiovascular mortality and economic fluctuations. Scand J Public Health 48(7): 770-780.
- Poole K, Couper K, Smyth MA, Yeung J, Perkins GD (2018) Mechanical CPR: Who? When? How? Crit Care 22(1): 140.
- World Health Organization (2004) The global burden of disease: 2004 update. WHO, Geneva.
- (2019) United Nations Department of Economic and Social Affairs / Population Division.
- World Health Organization (2004) Average daily ambient ultraviolet radiation (UVR) level. World Health Data Platform / GHO /. Indicator Metadata Registry List. Average daily ambient ultraviolet radiation (UVR) level.
- (2017) World Population Prospects United Nations. 2005-2010.
- Bhaven N Sampat (2009) Academic Patents and Access to Medicines in Developing Countries. Am J Public Health 99(1): 9-17.
- (2021) Gross National Happiness Commission. Royal Government of Bhutan.
- (2008) Global Health Observatory (GHO) data; Indicator and Measurement Registry version 1.7.0 BMI≥25; total cholesterol ≥0; blood glucose≥7.0; insufficiently active.
- (2020) Food and Agriculture Organization of the United Nations. Food Balance Sheets 2003-2005.
- Perkins GD, Ji C, Deakin CD, Quinn T, Nolan JP, et al. (2018) A Randomized Trial of Epinephrine in Out-of-Hospital Cardiac Arrest. PARAMEDIC2 Collaborators. N Engl J Med 379(8): 711-721.
- Muka T, Imo D, Jaspers L, Colpani V, Chaker L, et al. (2015) The global impact of non-communicable diseases on healthcare spending and national income: a systematic review. Eur J Epidemiol 30(4): 251-277.
- Sampson UK, Amuyunzu-Nyamongo M, Mensah GA (2013) Health promotion and cardiovascular disease prevention in sub-Saharan Africa. Prog Cardiovasc Dis 56(3): 344-355.
- Hall KD (2017) Obesity Energetics: Body Weight Regulation and the Effects of Diet Composition. Gastroenterology 152(7): 1718-1727.e3.
- Li G, Marlin MC (2015) Rab family of GTPases. Methods Mol Biol 1298: 1-15.
- Quyyumi AA (1992) Circadian rhythms in cardiovascular disease. Am Heart J 120(3): 726-733.
- Detry JM, M Vincent (1992) Circadian rhythms in cardiovascular disease: the crucial hours. J Hum Hypertens. 1: S3-S8.
- Kozák M (2003) Circadian rhythms in cardiovascular diseases--ischemic heart disease. Vnitr Lek 49(4): 302-307.
- Crnko S, Du Pré BC, Sluijter JPG, Van Laake LW (2019) Circadian rhythms and the molecular clock in cardiovascular biology and disease. Nat Rev Cardiol 16(7): 437-447.
- Zisapel N (2018) New perspectives on the role of melatonin in human sleep, circadian rhythms and their regulation. Br J Pharmacol 175(16): 3190-3199.
- Firsov D, Bonny O (2018) Circadian rhythms and the kidney. Nat Rev Nephrol 14(10): 626-635.
- Tho sar SS, Butler MP, Shea SA (2018) Role of the circadian system in cardiovascular disease. J Clin Invest 128(6): 2157-2167.
- Boivin DB, Boudreau P (2014) Impacts of shift work on sleep and circadian rhythms. Pathol Biol (Paris) 62(5): 292-301.
- Chellappa SL, Vujovic N, Williams JS, Scheer FAJL (2019) Impact of Circadian Disruption on Cardiovascular Function and Disease. Trends Endocrinol Metab 30(10): 767-779.
- Dong TA, Sandesara PB, Dhindsa DS, Mehta A, Arneson LC, et al. (2020) Intermittent Fasting: A Heart Healthy Dietary Pattern. Taub Am J Med 133(8): 901-907.
- Voigt RM, Forsyth CB, Green SJ, Engen PA, Keshavarzian A (2016) Circadian Rhythm and the Gut Microbiome. Int Rev Neurobiol 131: 193-205.
- Sylvie Tordjman, Sylvie Chokron, Richard Delorme, Annaëlle Charrier, Eric Bellissant, et al. (2017) Melatonin: Pharmacology, Functions and Therapeutic Benefits. Curr Neuropharmacol 15(3): 434-443.
- Francesca Baschieri, Pietro Cortelli (2019) Circadian rhythms of cardiovascular autonomic function: Physiology and clinical implications in neurodegenerative diseases. Auton Neurosci 217: 91-101.
- Huang W, Ramsey KM, Marcheva B, Bass J (2011) Circadian rhythms, sleep, and metabolism. J Clin Invest 121(6): 2133-2141.
- Stenvers DJ, Scheer FAJL, Schrauwen P, la Fleur SE, Kalsbeek A (2019) Circadian clocks and insulin resistance. Nat Rev Endocrinol 15(2): 75-89.
- Depner CM, Stothard ER, Wright KP (2014) Metabolic consequences of sleep and circadian disorders. Curr Diab Rep 14(7): 507.
- Qian J, Scheer FAJL (2016) Circadian System and Glucose Metabolism: Implications for Physiology and Disease. Trends Endocrinol Metab 27(5): 282-293.
- Larcher S, Benhamou PY, Pépin JL, Borel AL (2015) Sleep habits and diabetes. Diabetes Metab 41(4): 263-271.
- Meyhöfer S, Wilms B, Oster H, Schmid SM (2019) Importance of sleep and circadian rhythm for energy metabolism. Internist (Berl) 60(2): 122-127.
- Lemmer B, Oster H (2018) The Role of Circadian Rhythms in the Hypertension of Diabetes Mellitus and the Metabolic Syndrome. Curr Hypertens Rep 20(5): 43.
-
Lyudmila Alexandrovna Radkevich and Daria Andreevna Radkevich. Analysis of Dietary Patterns and Economic and Geographic Risk Factors for the Burden of Cardiovascular Disease. On J Cardio Res & Rep. 5(2): 2021. OJCRR.MS.ID.000607.
-
Food consumption levels, Dietary patterns, Predictors of Metabolic Syndrome, Burden of cardiovascular diseases, Diabetes, Cirrhosis, Cardio-metabolic diseases, Coronary heart disease, Liver cirrhosis, Infectious diseases, Blood glucose, Blood pressure
-

This work is licensed under a Creative Commons Attribution-NonCommercial 4.0 International License.


