 Research Article
Relationship Between Food Plant Knowledge and Health of Rural Dwellers: A Case Study of Kampung Peninjau Lama, Bau District, Sarawak, Malaysia
Andrew Kiyu1, Alexander K Sayok2* and Ulrich Teucher3
1Faculty of Medicine and Health Sciences, University of Malaysia Sarawak, Malaysia
2Institute of Biodiversity and Environmental Conservation, University of Malaysia Sarawak, Malaysia
1University of Saskatchewan, Saskatoon, Canada
Alexander K Sayok, Institute of Biodiversity and Environmental Conservation, University of Malaysia Sarawak, Malaysia.
Received Date: September 10, 2018; Published Date: October 31, 2018
Abstract
In the early days, most rural communities had limited access to towns and thus treated nearby forests as supermarkets for collection and gathering their needed materials including food. As such, their diet was predominantly forest-based. Presently, with ready access to markets, most food are bought and hsd been processed. Many studies showed that such changes in diet source had caused some adverse impacts on health. This study was undertaken in Kampong Peninjau Lama, a rural village, in Bau District, Sarawak to see if there is any change in their health through their change of diet source and mode of nutrition. The households were interviewed on the composition of their diet and sources of food components while the health status of the population in this village were documented. The study shows that there was a gradual change in the diet among the older folks (≥50 years) from predominantly plant-based and forest-derived food to meat-based and market-derived processed food. The health status of the population in this village, however, cannot be considered as the result of the change in food plant knowledge and practice. It was probably due to the parallel result of globalisation and its effects on diets and lifestyle, and on health status. The reason could be because this study was carried in a village which had been accessible to towns almost 60 years ago.
Introduction
This study is part of a bigger pilot project entitled “Food plants diets among villagers in Kampong Peninjau, Bau District and relationships with health”, which aims “to document the broad range of disappearing indigenous local food plant knowledge among the Bidayuh in Bau District. The general objective of this subset study is to determine the health status of the people in Kampong Peninjau, Bau District and to see if there is any relation to the main study.
Definitions of health
The most widely cited definition of health is the one in the 1948 Preamble to the Constitution of the World Health Organization (WHO) where health was defined as “a state of complete physical, mental, and social well-being and not merely the absence of disease or infirmity” WHO 1948 [1]. In 1986 [2] the WHO, in the Ottawa Charter for Health Promotion, said that health is “a resource for everyday life, not the objective of living. Health is a positive concept emphasizing social and personal resources, as well as physical capacities.”
Definition of health status
Health status is not an easy thing to measure. The following four abstracts on health status give an idea of the complexity of the concept of health status of individuals and whole populations, as well as the difficulties of trying to measure it.
Health is a multi-dimensional concept that is usually measured in terms of:
• Absence of physical pain, physical disability, or a condition that is likely to cause death,
• Emotional well-being
• Satisfactory social functioning
There is no single “standard” measurement of health status for individuals or population groups. Individual health status may be measured by an observer (e.g., a physician), who performs an examination and rates the individual along any of several dimensions, including presence or absence of life-threatening illness, risk factors for premature death, severity of disease, and overall health. Individual health status may also be assessed by asking the person to report his/her health perceptions in the domains of interest, such as physical functioning, emotional wellbeing, pain or discomfort, and overall perception of health. Although it is theoretically attractive to argue that the measurement of health should consist of the combination of both an objective component plus the individual’s subjective impressions, no such measure has been developed.
The health of an entire population is determined by aggregating data collected on individuals. The health of an individual is easier to define than the health of a population. Once the definition of optimum health for the individual is agreed upon, health status can be placed along a continuum from perfect health to death. No comparable scale exists for whole populations. What is the population-level equivalent of death? (Keep in mind that it is unusual for entire populations to die.) What is the population-level equivalent of optimum health? In the absence of comprehensive or absolute measures of the health of a population, the average lifespan, the prevalence of preventable diseases or deaths, and availability of health services serve as indicators of health status. Judgments regarding the level of health of a particular population are usually made by comparing one population to another, or by studying the trends in a health indicator within a population over time [3].
Difficulties in the measurement of health status
“An operational definition of health is essential before the health level or health status of an individual or population can be assessed. Arriving at such a definition has become increasingly difficult as the emphasis of medical and health care has shifted from decrease in mortality and increase in longevity to improvement in the healthrelated quality of life. Length of life is the ultimate measure of health status where acute illnesses that are potentially fatal are concerned. But in chronic illnesses, where palliative therapies or therapies that may prevent further deterioration are concerned, the relevant measure of health status is likely to include domains of health other than length of life” [4].
Current measures of health status
“Today, despite extensive analytic efforts to assess health more accurately, measures available to evaluate the health of populations continue to be morbidity, mortality, and disability. Summary measures are employed to attempt to assess overall health status of a population. These measures usually combine morbidity, mortality, and disability data but can also reflect perceived quality of life or functional status” [5].
“Summary measures of population health can be categorized into two major groups. The first major group of measures is called health expectancy (HE) and includes measures such as disabilityfree life expectancy (DFLE) and healthy life expectancy (HLE). The second major group, which measures health gaps, includes health measures such as disability-adjusted life expectancy (DALY). … Summarizing health is made considerably more complex by the need for multiple measures and the need to look at healthy life as measured in both years and as a percentage of remaining life spent in the healthy state. This evidence supports the conclusion that there are no simple measures of health” [6].
Measures of health status used in the current study
In this village, measures of mortality are not suitable as indicators of population health status as the absolute numbers are very low, and diseases associated with poor sanitation and hygiene are no longer prevalent here. Instead, the adult population are exposed to risk factors for chronic diseases and lifestyle. So, we seek to measure the prevalence of diabetes, hypertension and cardiovascular diseases among them as well as body mass index (BMI) and waist circumference.
For children, we have chosen to use anthropometry of children below 5 years old as proxy indicators of their health status. In doing so, we have to bear in mind the following interpretation and use of anthropometry:
“… causes of growth failure are generally age−specific; … Different factors affecting infant and child growth need to be borne in mind. At birth, infant weight and length are determined by maternal factors − including nutrition − and gestational age, i.e. whether the infant is full term. Interpretation of birth weight must take these into account. During the first 4 to 6 months, infant feeding practices and maternal health (and ability to take care of the baby) are the main influences on growth; growth failure at this early stage, less common than later, must be interpreted in this light. From about 4-6 months through two years of age, weaning practices and exposure to infectious disease have a major effect. As the age of the child increases, household access to food may have more importance.
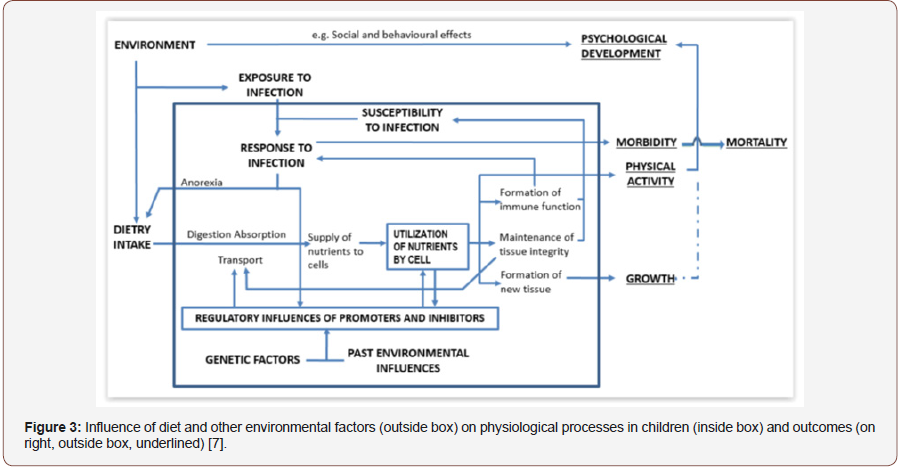
In summary, three biological considerations have major impact upon the use and interpretation of anthropometric indices. The first principle is that interpretation of length varies with age of the subject. In very young children (particularly in the first year but perhaps through the first two years of life) achieved size (length) may reflect a process of failing to grow. After about two years it is likely to reflect a state of having failed to grow. The state of having failed to grow continues to mark risk of detrimental outcomes (morbidity, mortality, psychological development, etc.) but no longer suggests that interventions will improve growth status. The second principle is that indices of weight in relation to length reflect current under− or over−nutrition (relative thinness or fatness) regardless of age. Major deficits in weight−for−length are suggestive of short−term risk of morbidity or mortality; in this case, the anthropometric index is likely to respond to immediate intervention. The third principle is that achieved size may be seen as a marker of the environment in which growth failure occurred and, as such, a marker of other risks associated with that environment” [7].
Specific Objectives of the Study
The specific objectives of this study are to
• Describe the sociodemographic profile of the population of the village
• Determine the number of deaths occurring in the village in the past one year prior to the survey
• Determine the prevalence of diagnosed diabetes, hypertension and cardiovascular diseases among adults in the village
• Determine the proportion of the adult population who have normal body weight or who are obese, based on their body mass index
• Determine the proportion of adult population whose waist circumference is greater than 80 centimetres
• Determine the nutritional status of children 0 to 4 years based on theirs weight and length/height
Methodology
A simple format was prepared to guide the interviewers as well as for recording the basic demographic and health data. This format is a simplified version of the questionnaires that we used for previous community surveys.
Data was collected by three assistant environmental health officers who were led by Mr Jitos Gubes who was very experienced in carrying out community surveys and who was very familiar with the data recording format. At the end of each morning and afternoon data gathering sessions the forms would be checked for clarity of the entries as well as for completeness. If any parts of the format were missing or unclear, the person who did the interview would clarify the data or go back to the household for it.
The field work was carried out on 10 to 13 December 2013, during the day- time. If any house was empty during the first visit the team would revisit the house the following day. They started the interview at the house of the village headman. All the houses in the village were included in the survey.
The inclusion criteria for anyone to be included in the survey were:
• They must be full time resident of the village, which is defined as anyone who does not spend the night away from the village for more than 2 weeks on a regular basis and
• they were in the village during any of the three days of the field work.
The exclusion criteria were
• Anyone who is originally from the village but who now stays in Kuching town and anywhere else for longer than two weeks on a regular basis,
• Visitors to the village.
The dates of birth of the respondents were obtained from the identity cards or from the child health cards (in the case of children).
Whether an adult respondent (defined as anyone 18 years and above in age) had ever been diagnosed as having diabetes, hypertension or cardiovascular disease were obtained by going through their home-based health cards. Their weight was measured using an Omron digital bathroom-type weighing scale, to the nearest 0.1 kg. Their heights were measured to the nearest 0.1 cm, using a cloth measuring tape that was taped to a wall of the house. Their waist circumference was measured against their skin with a cloth measuring tape.
For children, their weights and lengths (or heights) were obtained from the latest measurements recorded in their child health cards.
Data entry was done in Microsoft Excel. Simple calculations like means and their confidence intervals were done using Microsoft Excel.
The BMI was calculated using standard formula, i.e., by dividing weight in kilograms by height in metres squared [8]. The cutoff points for BMI were based on the World Health Organization (1998) standards so that the findings can be compared with the findings of the Malaysian Adult Nutrition Survey of 2009 [9]. For waist circumference, the cut-off point was taken as 80 cm for both men and women based on the recommendations of the study by Wildman et al. [10].
For children 0 to 4 years old their z scores for weight-for-age, weight-for-height and height-for-age were obtained using the World Health Organization [11] WHO Anthro for Personal Computers programme. For children 5-19 years old, the nutritional status was calculated using the WHO [12] Anthro Plus for personal computers.
Results
Environmental determinants of health
Kampong Peninjau Lama consisted of 37 doors (houses) that were mostly at ground level and not on stilts as was typical of Bidayuh houses in the past. All the houses had treated piped water supply and all had sanitary latrines. Most of them used liquefied petroleum gas (LPG) for cooking. They village also had regular refuse collection by the Local Council.
Demography and education
The total population was 243 and the average number of persons per house was six. The overall male to female ratio was 1.1:1. Children 0-4 years old formed 8.3% of the population, preschoolers (5-6 years old) 2.5%, primary school age group (7-12 years old) 12.8% and secondary school age group (13-19 years old) 11.5%.
The 55 women of child-bearing age (15-45 years old) formed 22.6 % of the total population and 47.0 % of the female population. About half of them (27) were married; none were widowed or divorced.
The ratio of working age group (19-60 years old) to elderly (61 years and older) and to those below 19 years old were 10:1 and 1.7:1 respectively. Among the 54 women who ever married, the gravida and para increased with older age groups ranging from 0 to 12 for gravida and from 0 to 11 for para (Table 1). The mean (and median) for both gravida and para were four (Table 1).
Table 1: Distribution of ever-married females by age group and gravida and para, Kampung Peninjau Lama, December 2013.

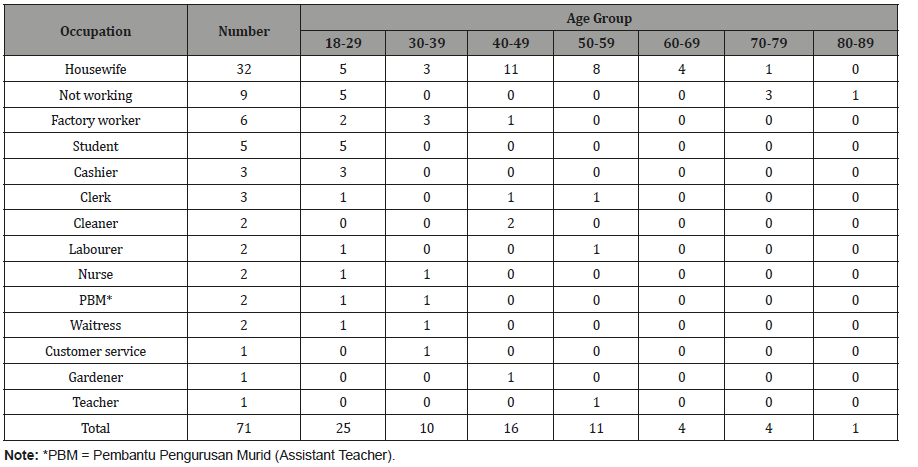
Both males and females between 7 to 39 years old had at least primary school education. Among those 40 years and above, 5% of males and 33.3% of females never went to school. The number of males and females who reached tertiary education were both seven (Table 2). Nearly half of the adult females were housewives, and nearly half of adult males were either laborer’s or factory workers (Table 2-4).
Table 2: Distribution of the population by gender, age group and level of schooling, Kampung Peninjau Lama, December 2013.
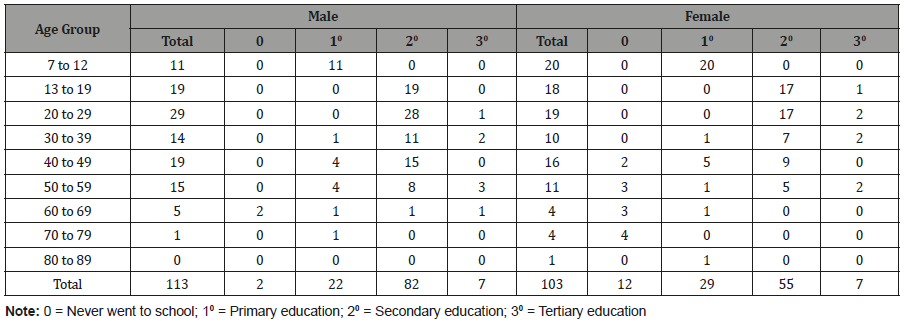
Table 3: Distribution of adult males by occupation and age groups, Kampung Peninjau Lama, December 2013.
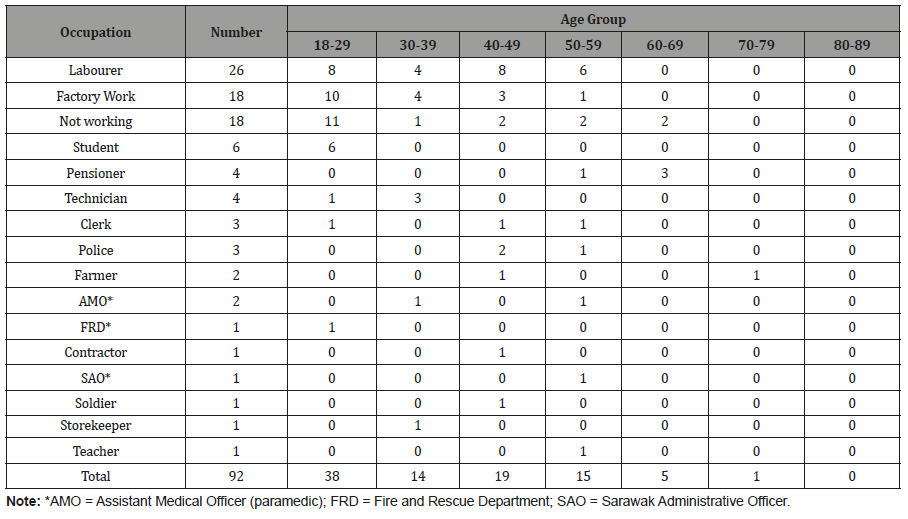
Table 4: Distribution of adult females by occupation and age groups, Kampung Peninjau Lama, December 2013.
Health status indicators
Mortality: There were two deaths in the village in the past one year. One was an 80-year old male who died from “old age” and the other was a 64-year-old male who died from cardiovascular disease.
Morbidity: Of the 84 adult males, 53 (63.1%) had Government Outpatient Department Clinic (OPD) cards and out of the 65 adult females, 55 (84.6%) had OPD cards. The OPD cards are homebased in the sense that they are not kept in the clinics but are kept by the patients. The percentages of adults who had OPD cards increased with age groups and the percentages are consistently higher in females in all age groups, compared to males (Table 5). From the OPD cards, only one male out of 54 was recorded to have hypertension giving a prevalence of 1.8% (95% confidence interval, CI 0.3%-9.8%). No adult male with OPD cards had diabetes or cardiovascular diseases recorded in those cards giving a prevalence of 0% (95% CI 0.0%-6.6%).
The finding among females was similar, with five females out of 56 having records of hypertension only and two females having records of both diabetes and hypertension. Thus, the prevalence of hypertension among females was 12.5% (95% CI 6.2% - 23.6%), and the prevalence of diabetes was 3.6% (95% CI 1.0% - 12.1%) (Table 5&6).
Table 5: Distribution of adults by gender, age group, availability of Government Outpatient Department Clinic card and presence of diabetes, hypertension and diabetes, Kampung Peninjau Lama, December 2013.
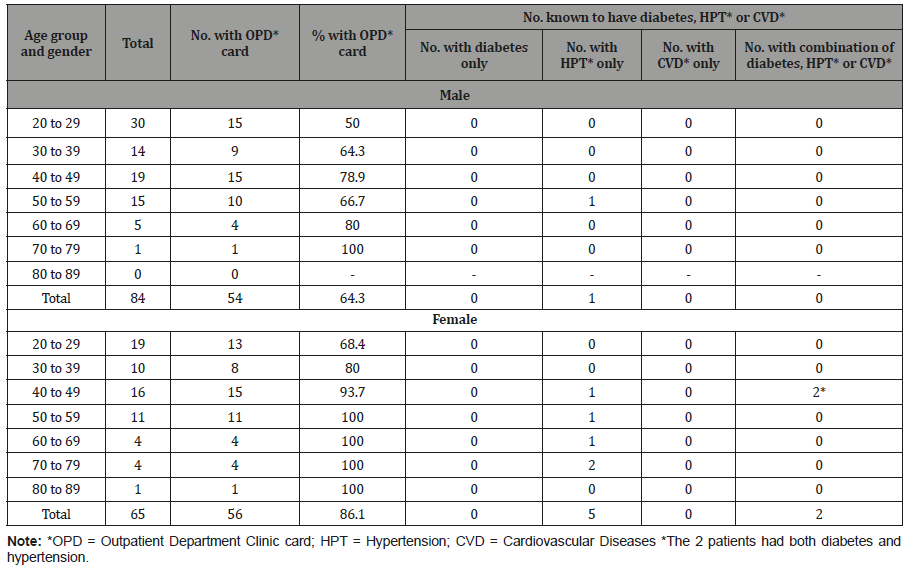
Table 6: Comparison of prevalence of diabetes, hypertension and cardiovascular diseases among adults in Kampung Peninjau Lama (KPL) December 2013 and results from the Third National Health and Morbidity Survey (NHMS III) 2006.

Cardiovascular diseases risk factors:The average height of adult males in the village was 162.1 cm and the average weight was 65.5 kg. Males were 12.2% taller and 9.6% heavier on average than females. The average waist size for males was 87.1 cm compared to 90.7 cm for females. The average body mass index (BMI) was similar for both males and females at 24.8 kg/m2. The variation in the height was small (coefficient of variation or CV of 5%) for both males and females, higher for waist circumference and highest for body weight, but they were similar for both sexes. The variation in BMI was higher in females (CV 23.7%) compared to males (CV 17.7%) (Table 7).
Table 7: Distribution of the population by gender, age group and level of schooling, Kampung Peninjau Lama, December 7013.

Obesity classification for adults:Around half of both adult males and females were of normal weight and 10 per cent of the adult females were underweight. Nearly one-third of both adult males and females were overweight and over 10 per cent of both sexes were obese.
Table 8: Distribution of the population by gender, age group and level of schooling, Kampung Peninjau Lama, December 8013.
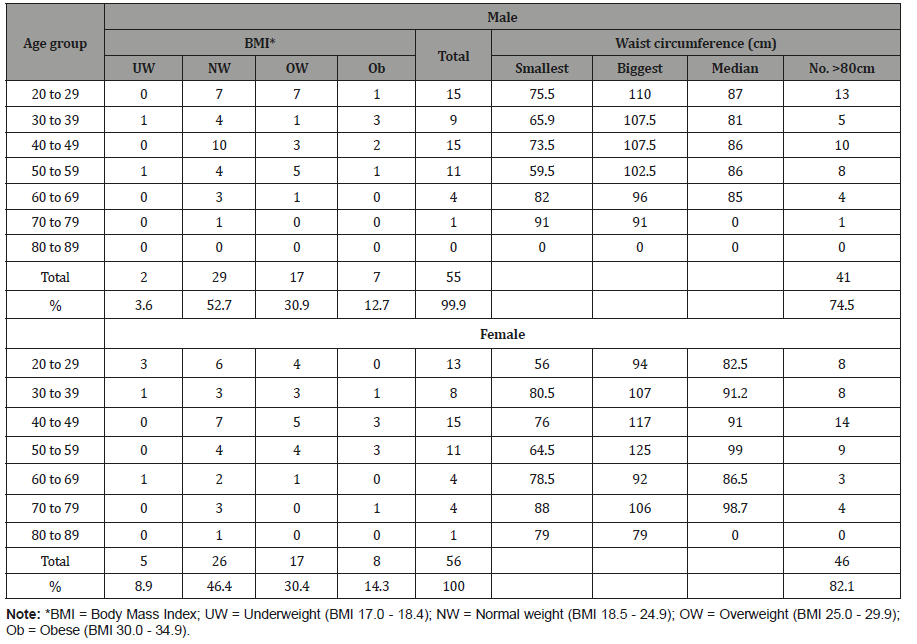
Seventy-two per cent of adult males and 80 percent of adult females had waist circumferences above the recommended 80 cm (Table 8).
Body mass index for children 5 to 18 years old:Over threequarters of both male and female children between 5 and 18 years old have normal weight. Eleven per cent of boys were underweight compared to girls, while the reverse happened for overweight (Table 9).
Normal weight, wasting and stunting for children 4 years old and below:Thirteen out of 18 (77.8%) of children 4 years and below were of normal weight. The other five were underweight (4) and severely underweight (1). None of them were overweight (Table 10).
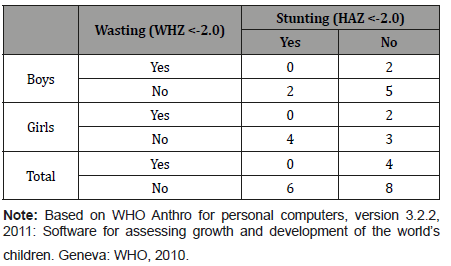
Based on their weight-for-age and height-for-age, eight of the 18 children (44.0%) were neither stunted nor wasted. Six (33.3%) were stunted only and the other four were wasted only; no child was both stunted and wasted (Table 11).
Table 9: Distribution of the population by gender, age group and level of schooling, Kampung Peninjau Lama, December 9013.
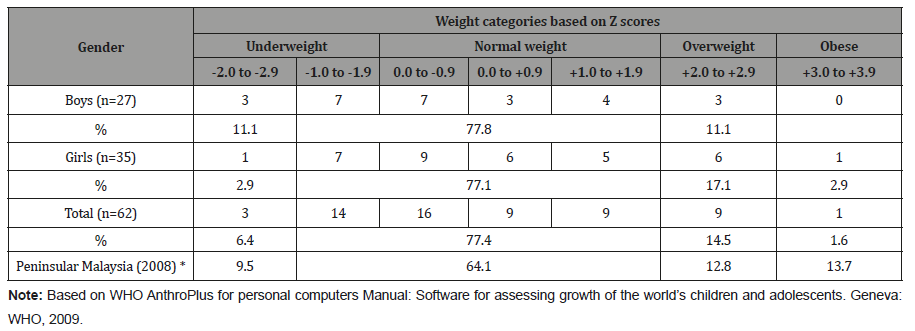
Table 10: Distribution of the population by gender, age group and level of schooling, Kampung Peninjau Lama, December 10013.

Table 11: Distribution of the population by gender, age group and level of schooling, Kampung Peninjau Lama, December 2013.
Discussion
The village is peri-urban and in the context of Sarawak, it lies somewhere along the middle of the socio-economic status continuum. The health and health status of the villagers are influenced less by poor water supply, sanitation and hygiene found in traditional villages but more by lifestyle factors. The measurement of the health status of the villagers in this study has two major limitations. First, summary measure of population health was beyond the scope of this study. Second, determining the prevalence of diabetes, hypertension and cardiovascular diseases among the adults based on the records in the outpatient department clinic cards appeared to have underestimated the prevalence of those conditions when compared to the results of the National Health and Morbidity Survey (NHMS III) 2006.
The point prevalence of diabetes, hypertension and cardiovascular diseases were lower (especially among males) in this study compared to the figures from the NHMS III in 2006 [13,14]. Based on the national average prevalence, there should be three to eight cases of diabetes and six cases of hypertension among the males in the village and one case each of cardiovascular diseases among both males and females. We may have to do a health screening for diabetes (testing for levels of fasting blood sugar using finger prick) and hypertension (using a blood pressure set) among adults in the village, especially among those 35 years of age and above [15].
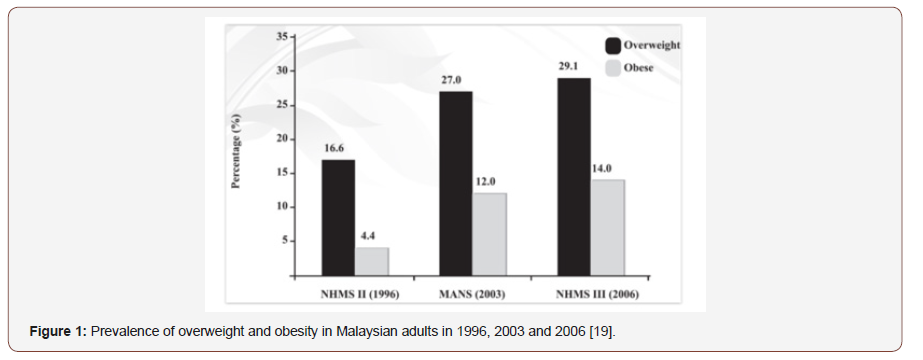
The mean body weight of males (65.5 kg) and females (55.9 kg) in Kampung Peninjau Lama were both less than the national average of 66.6 kg and 58.4 kg respectively as reported during the Malaysian Adult Nutrition Survey in 2003 [9]. The proportion of adult males who were overweight (30.9%) and obese (12.7%) and the proportion of adult females who were overweight (30.4%) and obese (14.3%) were similar to the national figures as recorded during the National Health and Morbidity Survey III, 2006 (Figure 1).
However, the average waist circumference of males (87.1 cm) and females (90.7 cm) were both larger than the national average of 83.4 cm and 79.4 cm respectively, as recorded during the National Health and Morbidity Survey III, 2006 [16]. Indeed, the proportion of adult males and females whose waist circumference exceeded 80 cm were 74.5% and 82.1% respectively. Having waist circumference greater than 80 cm puts a person at high risk of having multiple cardiovascular risk factors such as higher mean systolic blood pressure, diastolic blood pressure, total cholesterol, LDL-cholesterol, and triacylglycerol values, and lower values of protective HDL-cholesterol [10].
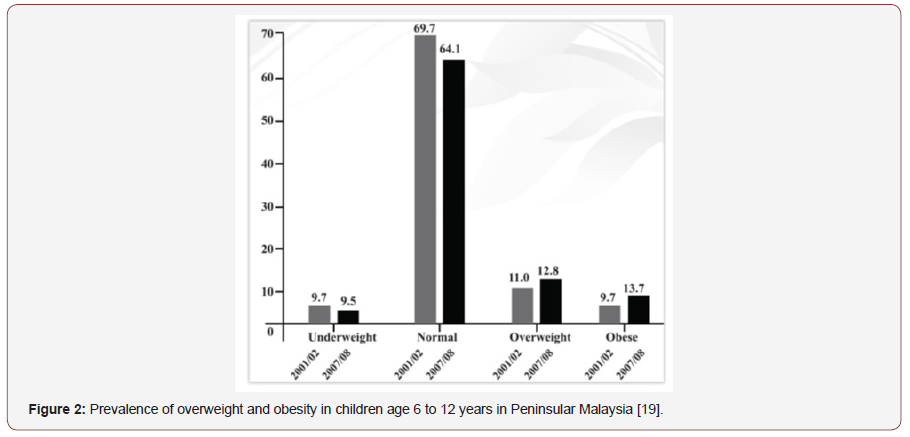
Among adolescents, about three-quarters of both boys and girls were of normal weight. There were equal proportions of underweight and overweight among the boys. For the girls, there were more overweights compared to underweights. While the prevalence (14.5%) of overweight among adolescents in Kampung Peninjau Lama was marginally higher than the 12.8% among 6 to 12 years old in Peninsular Malaysia, the prevalence of obesity (1.6%) was considerably lower than 13.7% among 6-12 years old on Peninsular Malaysia (Figure 2).
Among children 4 years old and below, the prevalence of underweight was higher (16.7%) in Kampung Peninjau Lama compared to the national average which was 12.9% during the Third National Health and Morbidity Survey in 2006. The prevalence of severe underweight was even higher at 5.6% compared to only 0.3% nationally [16-19]. The prevalence of stunting (33.3%) was also worse than the national average of 17.2%. Thus, while the health status of the adolescents and adults in Kampumg Peninjau Lama appear to be satisfactory overall, there are factors in the socioeconomic and physical environment (Figure 3) that adversely affect the growth if children 0 to 4 years old in the village (Figure 2&3).
Finally, the health status of the population in Kampung Peninjau Lama as determined in this study cannot be considered as the result of the change in food plant knowledge and practice. It was probably due to the parallel result of globalization and its effects on diets and lifestyle, and on health status.
Acknowledgement
We would like to thank Datu Dr. Zulkifli Jantan for agreeing that Sarawak Health Department participate in this pilot project. We would like to thank the Headman of the village Mr. Sidop anak Sikor, and all the people of the village for their cooperation and kindness shown to us during the survey. The contribution of Ms Stella Senia in this survey, especially during the field work is acknowledged and appreciated.
Conflict of Interest
No conflict of interest.
References
- WHO (1948) Preamble to the Constitution of the World Health Organization as adopted by the International Health Conference, New York, USA.
- World Health Organization (1986) Ottawa Charter for Health Promotion.
- (2014) Health Status and Determinants of Health of Hispanic Populations. Rice University, USA.
- Bergner M and Rothman ML (1987) Health status measures: An overview and guide for selection. Annu Rev Public Health, 8: 191-210.
- Thacker SB, Stroup DF, Carande Kulis V, Marks JS, Roy K, et al. (2006) Measuring the public’s health. Public Health Rep 121(1): 14-22.
- Molla MT, Madans JH, Wagener DK (2003) Summary measures of population health: Report of findings on methodologic and data issues. National Center for Health Statistics. Hyattsville, Maryland.
- Beaton G, Kelly A, Kevany JR, Martorell, J Mason (1990) Appropriate Uses of Anthropometric Indices in Children-Nutrition policy discussion paper No. 7. A Report based on an United Nations Administrative Committee On Coordination- ACC Subcommittee On Nutrition pp. 1-48.
- World Health Organization (1998) Obesity: Preventing and Managing the Global Epidemic. Report of a WHO Consultation on Obesity, Geneva, Switzerland.
- Azmi MY, Junidah R, Siti Mariam A, Safiah MY, Fatimah S, et al. (2009) Body Mass Index (BMI) of Adults: Findings of the Malaysian Adult Nutrition Survey (MANS). Malays J Nutr 15(2): 97-119.
- Wildman RP, Gu D, Reynolds K, Duan X, He J (2004) Appropriate body mass index and waist circumference cutoffs for categorization of overweight and central adiposity among Chinese adults. Am J Clin Nutr 80(5): 1129-1136.
- WHO (2010) WHO Anthro for personal computers, version 3.2.2, Software for assessing growth and development of the world's children, Geneva, Switzerland.
- WHO (2009) WHO Anthro Plus for personal computers Manual: Software for assessing growth of the world's children and adolescents, Geneva, Switzerland.
- Amal NM, Paramesarvathy R, Tee GH, Gurpreet K, Karuthan C (2011) Prevalence of chronic illness and health seeking behaviour in Malaysian Population: Results from the Third National Health and Morbidity Survey (NHMS III). Med J Malaysia 66(1): 36-41.
- Letchuman GR, Wan Nazalmoon WM, Wan Mohamad WB, Chandran LR, Tee GH, et al. (2010) Prevalence of diabetes in the Malaysian National Health and Morbidity Survey III 2006. Med J Malaysia 65(3): 173-179.
- Selvarajah S, Haniff J, Kaur G, Guat Hiong T, Bujang A, et al. (2013) Identification of effective screening strategies for cardiovascular disease prevention in a developing country: using cardiovascular risk-estimation and risk-reduction tools for policy recommendations. BMC Cardiovasc Disord 13: 10.
- Selvarajah S, Haniff J, Kaur G, Hiong TG, Cheong KC, et al. (2012) Clustering of cardiovascular risk factors in a middle-income country: a call for urgency. Eur J Prev Cardiol 20(2): 368-75.
- Florey LA, Galea S, Wilson ML (2007) Macrosocial determinants of population health in the context of globalization. In Galea S (ed) Macrosocial determinants of population health. Ann Arbor, Michigan, USA, pp.17.
- Khor GL, Noor Safina MN, Jamalludin AB (2009)Mutritional status of children elow 5 years in Malaysia: anthropometric analyses from the Third National Health and Morbidity Survey III (NHMS, 2006). Malays J Nutr 15(2): 121-136.
- (2014) Malaysian Dietary Guidelines 2009: Key Message 2, pp. 27-28.
-
Andrew Kiyu, Alexander K Sayok, Ulrich Teucher. Relationship Between Food Plant Knowledge and Health of Rural Dwellers: A Case Study of Kampung Peninjau Lama, Bau District, Sarawak, Malaysia. On J Complement & Alt Med. 2(3): 2019. OJCAM.MS.ID.000543.
-
Forests, Markets, Nutrition, Globalization, Physical pain, Physical disability, life-threatening illness, Morbidity, Mortality, Disability data, Hypertension, Cardiovascular diseases
-

This work is licensed under a Creative Commons Attribution-NonCommercial 4.0 International License.


