 Research Article
The Role of the Superior Parietal Lobule in the Müller- Lyer Illusion: A TMS Study
Nicolo Biagi, University of Reading, United Kingdom.
Received Date: December 9, 2022; Published Date: January 03, 2023
Abstract
Previous studies have implicated the Superior Parietal Lobule (SPL) in the Müller-Lyer illusion as well as eye movement planning. In this study we investigated the role played by the Superior Parietal Lobule (SPL) in both the effect of the illusion on eye movements generated by the Müller- Lyer illusion, and on the well-known perceptual illusion of extent. The perceptual illusion of extent was measured using the bisection bias generated by both the Judd and Brentano variants of the Müller-Lyer illusion. We delivered offline continuous theta burst stimulation (cTBS) for 40 seconds to either the SPL (identified as the electrode CP1 in the 10-20 EEG system) or a control region (i.e., the vertex) before presenting the tasks. We found that cTBS stimulation over the SPL did not significantly affect saccade amplitudes recorded during the presentation of the Müller-Lyer or reduce the bisection bias generated by the Judd variant or the Brentano version of the Müller-Lyer stimuli compared to cTBS over the vertex.
Introduction
How do we perceive the visual distances (visual angles) between stimuli or points in the image plane? No direct information about visual angles between stimuli arises from the firing rates of the individual neurons organised into retinotopic maps that are present in V1 and V2. Individual neuron firing rates in V1 encode stimulus position, while information about visual angles is preserved in the pattern of firing across neurons. One possibility is that higher level visual processing takes the position signals from V1/V2 as its input and uses them to compute visual angles [1-3]. A radically different possibility is that efference copies of sensorimotor plans that are inherently spatial are used to fill this gap. In this chapter, we focus on the latter possibility. Note that we use the terms visual distance and visual separation refer to the simple 2D visual separation in degrees of visual angle between two points in the image plane, not to higher level perception of distance between objects in the world. Efferent theories of perception have a long history and are grounded in the idea that the visual system evolved to guide movement in response to stimuli rather than to produce perception of the world. Being closely coupled to sensory input, eye movements have provided a testbed for this theory. Many experiments have confirmed the prediction that stimulus configurations that produce biased spatial perception also produce biased patterns of eye movements. For example, in the Müller-Lyer figures, the amplitude of saccadic eye movements made along the shaft is altered by the illusion [4-8]. However, as Coren S [9], points out, it is hard to determine whether the perceptual illusion drives the eye movement biases or vice versa. Because experimental conditions that prevent overt eye movements do not abolish illusions such as the Müller- Lyer, a role for proprioceptive information about eye position after saccades have been made in perception has been ruled out. However, Coren S [9], proposes that what influences perception of angular extent is not proprioceptive feedback but planned eye movements, which may or may not go on to be executed. Coren’s 6th experiment attempts to show that eye movement plans are prior to perception in the causal chain rather than the other way around by demonstrating that illusory biases in perception are influenced by the presence of an eye movement plan, independently of lowlevel stimulus configurations. While this is a useful demonstration, the findings could potentially also be explained in terms of the distribution of spatial attention across the stimulus, and so further lines of evidence are needed. To address this, here we will use the Müller-Lyer illusion to induce a bias in both perception and eye movements and use TMS to try and disrupt these effects.
Consistent with an efferent explanation for the ability to perceive visual extent, Zimmermann & Lappe [10], showed that there is a shared map for motor and visual space. They showed that using an adaptation paradigm McLaughlin SC [11], it was possible to change the map of motor representation, and in turn affected the perceptual visual space. In the method of saccade adaptation, participants are asked to move their eyes from a fixation point to a target on the screen and, once they have initiated the saccade and their eyes are moving the target position changes (either towards the fixation point, i.e., inward adaptation, or further away from the fixation point, i.e., outward adaptation). Because visual sensitivity is reduced during saccade execution, participants remain unaware of the displacement of the target McLaughlin SC [11], but after the saccade has landed, the oculomotor system detects the error between the end position of the saccade and the location of the target, and a second corrective saccade is deployed to reduce the gap. If the misplacement of the target remains constant for several trials, then the oculomotor system adapts to it and the saccade triggered by the target stimulus lands closer to the misplaced position instead of the original position of the target [10].
After saccade adaptation was achieved, participants were asked to judge the perceptual location of a probe that was flashed briefly on the screen before an adapted saccade. It was found that the probes were mis located in the direction of the adaptation. However, it was not clear whether this was caused by the saccade adaptation or by the mismatch between the expected and actual landing position of the saccade.
An answer to this question had been previously suggested by Garaas & Pomplun [12], where they presented a large persistent cross and asked participant to compare the lengths of the horizontal and vertical component of it before and after saccade adaptation. They discovered that after vertical outward adaptation, the vertical lines were perceived as longer, while after vertical inward adaptation were perceived shorter. They found a similar effect for horizontal adaptation, where after horizontal inward adaptation horizontal lines were perceived as shorter. This suggests that the saccade adaptation not only changes the motor map, but also the visual space. This is in line with the two-factor theory proposed by Müsseler & Van der Heijden [13], where it was suggested that the perception of visual space is established by a visual sensory map, which gives information of what composes the visual field, and a non-visual motor map, which contains all the possible eye movements necessary to bring various locations under foveal inspection. These two maps are highly connected and together they establish the locations and identities of objects in the visual field. This theory would explain why saccadic adaptation, which affects the non-visual motor map has also an effect on the visual sensory map.
A number of lines of evidence suggest that the parietal lobe, which we target with TMS, plays an important role in generating the linked motor and visual maps. Panouillères M, et al. [14], showed that the parietal lobe is involved in the process of saccade adaptation. They delivered single pulse TMS (spTMS) over the right posterior intra-parietal sulcus (pIPS) at different timings after saccade onset (30, 60 and 90 ms). They discovered an impairment of saccade adaption for voluntary saccades when the spTMS was delivered 60 ms after saccade onset, and a facilitation of saccade adaptation for reflexive saccades when the spTMS was delivered 90 ms after saccade onset. These results show that there are two different system for the saccade adaptation, one for voluntary and another one for reflexive saccade, and the Parietal Lobe is important for both of them.
As well as being implicated in saccadic adaptation and the concurrent distortion of visual space, the parietal lobe has been shown to play a role in producing the distortion of perceived extent in the Müller-Lyer illusion and as noted above this illusion also affects eye movement amplitudes. Specifically, in an fMRI study Wiedner & Fink [15], varied the magnitude of the illusion by varying the angle formed between the main shaft and the wings that induce the illusion. Activation in the right superior parietal cortex and the lateral occipital cortex covaried with illusion magnitude. In a follow up study, Mancini F, et al. [16], delivered repetitive TMS stimulation (rTMS) over the regions identified by Wiedner & Fink [15], (i.e., the occipital-temporal cortex and the superior parietal cortex) and then ask the participant to perform a bisection task using the Judd variant of the Müller-Lyer illusion. They found that rTMS over the SPL produced a trend for an effect on illusion strength. However, as the Judd variant of the Müller-Lyer illusion, has been shown to produce an illusion of position rather than extent Mack A, et al. [17], this cannot be taken to confirm a role for right superior parietal cortex in biases of extent perception. Finally, fMRI studies carried out recently in our lab using minimal stimulus configurations made up of dots to test whether superior parietal lobule activation is driven by spatial attention shifts or alternatively by changes in perceived visual separation between stimuli concluded that changes in visual separation were the key factor [18,19].
Turning to the current study, our purpose is to address the question Zimmerman & Lappe [10], highlighted: “To understand how saccade adaptation modifies space perception we need to ask how and where in the brain the common metric for saccades and spatial perception may reside.”. We chose to target the SPL with TMS because the studies reviewed here suggest it has a role in the perception of extent and visual separation, and it has also been implicated in eye movement planning [20]. As a stimulus we selected the Müller-Lyer illusion because in its standard form it produces biased perception of the separation between two points in space Mack A, et al. [17], as well as a corresponding bias in landing positions of saccadic eye movements. Furthermore, studies reviewed above show that the superior parietal region plays a role in producing the illusion. We measured both the perceptual Müller-Lyer illusion as well as the eye movement bias as targeting the SPL with TMS could produce a number of potential changes in these outcomes relevant to our underlying theoretical question concerning the relationship between perception and eye movement plans. If TMS to SPL is found to disrupt only the effect of the illusion on eye movements, or only the effect of the illusion on perception, then this would count as evidence against the proposal that motor plans and perception are closely linked, suggesting instead independent processing pathways. However, if TMS to SPL disrupts both perceptual and eye movement aspects of the illusion then this would support the idea that eye movement plans, and perception are closely linked.
The present study aimed to test the proposal that SPL was critical for the processing and perception of eye movements and visual extent in the Müller-Lyer illusion by using a non-invasive brain stimulation technique known as continuous theta burst stimulation (cTBS). cTBS is a specific pattern of TMS stimulation and it is composed of a burst of 3 stimuli at 50 Hz (i.e., 20 ms between each stimulus), repeated at intervals of 200 ms. It lasts for 40 seconds and a total of 600 pulses are delivered [21]. This specific pattern of TMS stimulation is known to generate a longlasting depolarisation effect which affects Motor Evoked Potentials (MEPs) up to 60 minutes after stimulation [21].
Compared to the study presented in Chapter 2, we took a different approach. Firstly, instead of using TMS to try and induce a reduction in the precision of judging visual separation (psychophysical slopes), we designed the study so that TMS might induce biases in the perception of visual extent. In order to do so, 2 main changes were made: we decided to deliver offline cTBS instead of online TMS, and we abandoned the psychophysical approach to the tasks. We decided to deliver offline cTBS instead of online TMS for practical reasons: an online TMS might result in a less precise stimulation given that the artificial arm holding the TMS coil does not adjust for small movements that participants might make during the task. Moreover, offline stimulation has a well-known effect of inhibiting the target region for up to 60 minutes after the stimulation, which allowed us to present various tasks in which the perception of a horizontal line was measured. The tasks presented in this study are very different from the ones mentioned in Chapter 1, we decided to move away from the psychophysical approach, and this allowed us to have shorter tasks, which might have allowed participants to concentrate better.
The behavioural tasks performed after the cTBS was applied to SPL were an eye- movements task, where participants had to move their eyes from one end to the other of the horizontal shaft of a standard Müller-Lyer stimulus (Figure 1a); a perceptual bisection task, where participants had to correctly bisect a Judd variant of the Müller-Lyer stimuli (Figure 1b); and another bisection task where participants had to bisect a Brentano version of the Müller- Lyer stimuli (Figure 1c). To increase methodological rigor, we also applied cTBS to a control region (i.e., the vertex) that was not thought to play a role in processing visual extent. In line with the proposal that eye movement planning and perception of space are closely coupled processes, we predicted that cTBS to the SPL would result in significantly different performance in all three tasks compared to the performance recorded after the cTBS was applied to the control region (vertex).

Method
Participants
For this study 21 healthy participants (5 males, 16 females) were recruited for a 2 non- consecutive day TMS study at the University of Reading. This sample size was sufficient to detect an effect size of d = 0.56 for our one tailed prediction (power 0.8, alpha 0.05, paired sample t-test). Participants were recruited via the University of Reading Student Volunteer Panel (SONA), where the study was advertised. The age range of the participants recruited was between 18 and 41 years old (Median = 20, range= 18-41). All participants were informed that they participation to this study was voluntary and that they could withdrawal at any time without providing a reason.
Ethical Approval
This study was granted ethical approval by the University of Reading Ethics Committee (UREC), with an UREC code 17/49, expiration date 1/10/2020. Due to the seizure-potential that the TMS stimulation has Wassermann, & Lisanby [22], participants were asked to complete a TMS screening form before each cTBS stimulation. The TMS screening form was approved by the UREC and was composed of 24 questions aimed to investigate if the participant had previous psychiatric, neurological or other medical conditions and therefore was not eligible for the cTBS stimulation [23]. Moreover, the experimental design conformed to the TMS safety parameters specified by Wasserman & Lisanby [22] and Rossi [23], regarding duration, intensity and frequency of stimulation. In order to ensure the safety of the participants, after each stimulation the participant was asked to stay with one of the experimenters for approximately one hour, until the effect of cTBS had fully disappeared. Before the start of the cTBS stimulation participants were reminded that they could withdraw at any time from the study without providing a reason.
Apparatus and Materials
All the experiments presented in this study were programmed using Psych toolbox [24-26], a freely available toolbox for MATLAB. All the stimuli were displayed on a 24-inch ViewPixx monitor (1920(H) x 1080(V) pixels), placed 90 centimetres away from the participant. In order to reduce head movements, participants were asked to rest their chin on a chinrest for the entire duration of the experiment (the chinrest was placed 90 centimetres away from the ViewPixx monitor). Placed under the monitor there was an Eyelink 1000 eye tracker (sampling frequency of 1000 Hz) for the purpose of recording the eye movements.
Design and Procedure
The design was fully repeated measures, with every participant undergoing offline cTBS stimulation over 2 different regions in two different days: the Superior Parietal Lobule (SPL) and the Vertex (control region). Each stimulation took place on a different day and there was at least a 48-hour interval between the 2 sessions. For half of the participants, on Day 1 the stimulation was delivered over the EEG electrode C1 Koessler L, et al. [27], and on Day2 it was delivered over the Vertex, while for the other half of the participants the order of stimulation was reversed. In each session, three short experiments were completed after the cTBS stimulation. The order of presentation of the experiments was the same for all the participants.
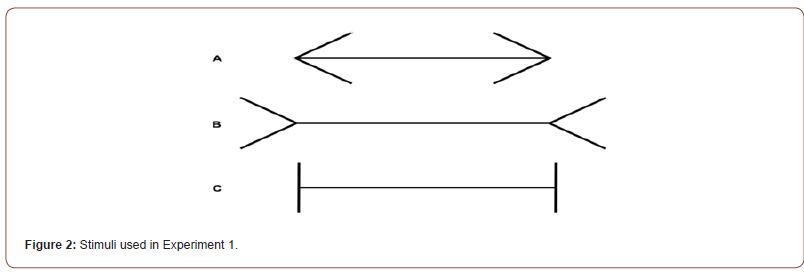
In experiment 1 the effect of cTBS on eye movements was investigated. In order to do so, saccades amplitudes were recorded while three different variations of the Müller-Lyer figure, one of which was a control figure with vertical fins, were presented in white on a black screen (Figure 2). On each trial the participant was presented with one configuration of the Müller-Lyer figure and was asked to saccade back and forth rapidly between one end of the horizontal shaft and the other end for 10 seconds. Each configuration was presented 3 times, for a grand total of 9 trials.
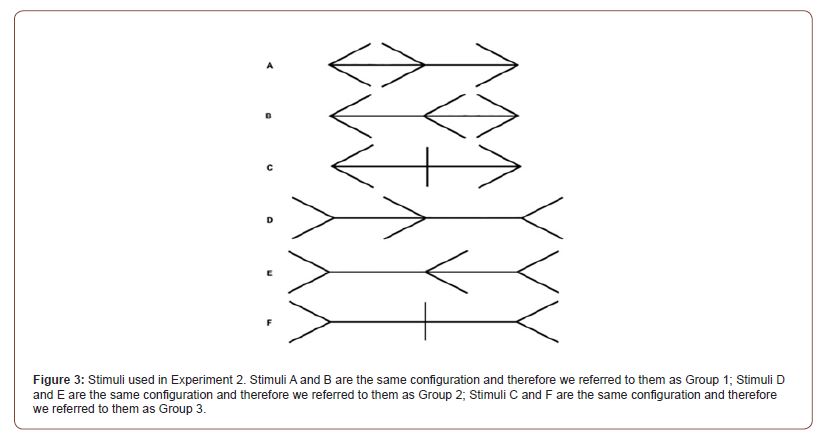
In experiment 2 the effect of the cTBS on the perceptual bisection point bias induced by the Judd variant of the Müller-Lyer illusion was investigated. In order to do so, bisection judgments were recorded for 3 different configurations of the Judd variant of the Müller-Lyer illusion were used (Figure 3). On each trial the participant was presented with one configuration of the Judd variant of the Müller-Lyer stimuli, with a middle fin displayed randomly at a randomly decided starting point along the horizontal shaft and was asked to bisect the main shaft of the stimuli by adjusting the position of the middle fin using the left and right arrow keys on the keyboard. The participants had 10 seconds in each trial to bisect the stimulus and press the spacebar to confirm their adjustment. A total of 24 trials were presented.
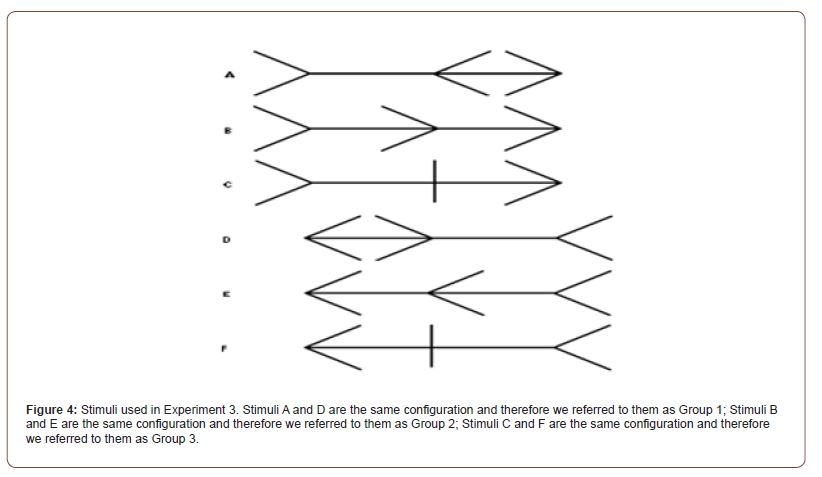
In experiment 3 the effect of cTBS on the bisection bias induced by the Brentano version of the Müller-Lyer illusion was also investigated. In order to do so, 3 different configurations of the Brentano version of the Müller-Lyer illusion were used (Figure 4). On each trial the participant was asked to adjust the location of the middle fin so that it bisected the horizontal shaft by using the left and right arrow keys on the keyboard. In each trial the middle fin was presented at a randomly decided starting point along the horizontal shaft. The participants had 10 seconds in each trial to bisect the stimulus and press the spacebar to confirm their adjustment. A total of 24 trials were presented.
Stimuli
All the configurations of the stimuli used in the 3 experiments were composed of a horizontal shaft and two wings, each of which was attached to one of the end points of the main shaft.
In all the configurations the length of the main shaft was 10°, and the length of the wings was 1/3 of the length of the main shaft, while the angle between the two parts of the wing was set to be equal to 65° (or 295° if you consider the wing pointing outward).
This has been suggested to be the shaft/wing configuration that can induce the strongest illusion [15].
The configurations of the stimulus where the fins are vertical does not induce an illusion Weidner & Fink [15], and therefore this stimulus was used as a baseline against which the illusion magnitude of the other two stimuli was quantified.
Resting Motor Threshold
After a participant successfully completed the screening form and after obtaining written consent, the resting motor threshold (RMT) was acquired on each day of the experiment. The RMT is the lowest intensity of stimulation the primary motor hand area (M1- HAND) that evokes a peak-to-peak Motor Evoked Potential (MEP) of 50 μV in at least five out of ten consecutive trials in the contralateral relaxed first dorsal interosseus (FDI) muscle [28].
In order to define the starting position for the search for the M1-HAND area, the TMS coil was firstly placed on top of the vertex (defined as the mid-distance between the nasion- inion, and the left-right auricular bones) and then moved 1 centimetre to the left, away from the vertex and 4-5 centimetres forward [29].
The best position to produce the FDI muscle activation was located by moving the TMS coil in 0.5 centimetres steps from the starting position.
During the entire RMT assessment, the handle of the coil was pointed backwards at a 45° angle away from the midline, approximately perpendicular to the line of the central sulcus. For each subject, the RMT was determined as the intensity at which single pulses applied over the hand area of right M1 produced a visible muscle twitch in 5 of 10 consecutive trials, a procedure that has been used previously in the field [30,31].
Once the RMT for the day was defined, we set the intensity of stimulation to 80% of that value. This is common practice for cTBS stimulation [21]. Mean ± SE RMT was 59.2 ± 1.2% maximum stimulator output (MSO) for the session where the SPL was the target of stimulation, and 59.5 ± 1.3 MSO for the Vertex. Mean ± SE experimental stimulation intensity was 47.4 ± 0.9% MSO for the SPL and 45.2 ± 2.6% MSO for the Vertex.
Location of the TMS target
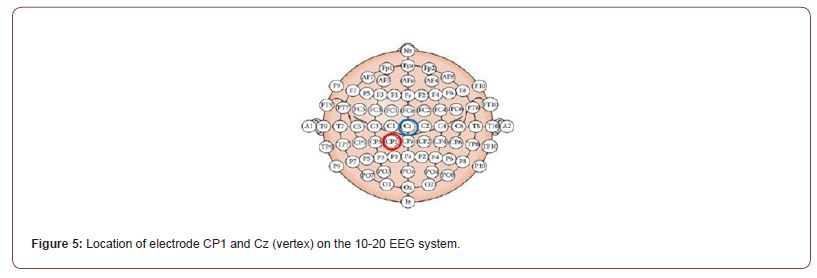
After defining the RMT and the intensity of TMS stimulation for the day, we located the target for the stimulation on that day. In one of the two days of the experiment, the cTBS was delivered over the vertex, while in the other day the cTBS was delivered over the left Superior Parietal Lobule. The vertex (Cz) was located as the half-point distance between the nasion-inion and the two auricular bones, while the left Superior Parietal Lobule was determined according the international 10-20 system of electrode placement: participants were asked to wear an EEG cap and the position of the electrode CP1 was marked on the skull (Figure 5). According to Koessler l, et al. [27], the electrode CP1 is the one closest to the left Superior Parietal Lobule.
In half of the participants the vertex was the target of cTBS in Day 1 while the electrode CP1 was the target in Day 2. For the other half of the participants the order of TMS stimulation was inverted. Immediately after the TMS session, in each day of the experiment, the three tasks were presented. After the TMS target for the day was located, participants were asked to place their chin on a chinrest, placed 90 centimetres away from a View Pixx monitor, and then the TMS coil was placed over the target, and it was hold in place by the researcher.
TMS Stimulation
Once the RMT was acquired, the participants underwent a single session of cTBS.
cTBS consisted of three pulses of stimulation given at 50 Hz, repeated every 200 ms for a total of 600 pulses. The stimulus intensity was set at 80% of [21]. The cTBS was delivered with a figure of 8 coil (7 centimetres diameter), attached to a PowerMag 1000 stimulator (Mag & More GmbH, München, Germany) and the pattern of stimulation was programmed in MATLAB.
Results
Two participants did not undergo both sessions of the experiment, reducing the sample from 21 to 19 participants.
Experiment 1
Pre-processing and descriptive statistics: Due to technical issues the eye tracker data for one participant was not saved, further reducing the sample size to 18 participants. The continuous stream of eye tracker data for all the participants acquired during experiment 1, in which participants saccaded back and forth between the two ends of the shaft of the Müller-Lyer figure, was loaded into RStudio and out of all the saccades recorded during this task, just the saccades made when the stimuli were on the screen were selected, for a total of 9407 saccades. After that, the saccade amplitudes were converted into a percentage of shaft length and just the saccades either bigger than 50% or smaller than 150% of the shaft length were furthered analysed, reducing the number of saccades to 5490. Then, all the saccades that deviated more than 1.5º from a straight line between the two end of the stimulus were removed, further reducing the sample to 4081 saccade. These two filtering steps were taken from de Brouwer and colleagues [31]. After the filtering procedure the average saccade amplitude for each configuration of the stimulus was obtained for each participant. Pirate plots showing the effects of TMS on the mean, 95 % CI and distribution of the saccade amplitudes in the 3 experimental conditions are presented in Figure 6.
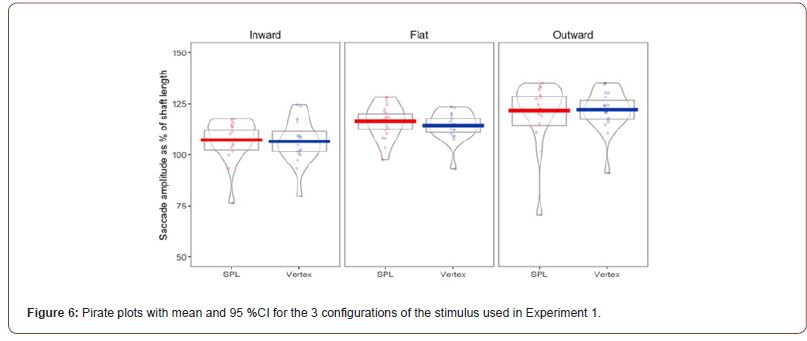
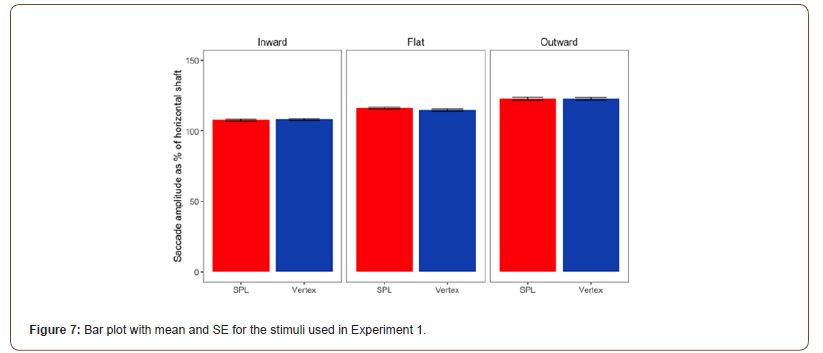
Statistical Analysis: Our prediction was that the cTBS stimulation of the SPL should have affected the saccade amplitudes elicited by the Müller-Lyer stimuli. Moreover, we predicted an overall reduction of the strength of the Müller-Lyer illusion’s effect on saccade amplitudes; we predicted that the cTBS should have reduced the saccade amplitudes elicited by the version of stimulus with the wings pointing outwards, and we predicted an increase in saccade amplitudes for the ones elicited by the inwards configuration of the stimulus. Means and SE for the 3 configurations of the Müller-Lyer used in Experiment 1 are presented in Figure 7.
In order to test our prediction, we carried out a 2 (Stimulation type: SPL vs Vertex) x 3 (Stimulus type: Outward/Flat/Inward) Repeated Measure ANOVA. The Mauchly’s test for Sphericity for the 2-way interaction violated the assumption (sig. = 0.039), therefore we used the Greenhouse-Gassier correction.
The main effect for stimulation (F(1,15) = .35, p = .563, η2= .023) was not significant, while the main effect for stimulus type was significant (F(22, 30)= 20.197, p < .001, η2=.574). The interaction between the two main effect was also not significant (F(1.459, 21.878) = .402, p=.673, η2=.026). Regarding the main effect for stimulus type, pairwise comparisons with a Bonferroni adjustment revealed that saccade amplitudes were significantly increased from Inward to Flat (8.86.95 (95% CI, 5.45 to 12.28) %, p < .001), and from Inward to Outward (13.71 (95% CI, 8.58 to 18.84) %, p < .001), and trending towards significance from Outward to Flat (4.84 (95% CI, -.37, 10.06) %, p =.066).
This indicates that we replicated the previously found effects of the Müller-Lyer illusion on saccade amplitude, but cTBS failed to influence that.
Experiment 2
Pre-processing and descriptive statistics: The behavioural data from experiment 2 was loaded into RStudio, and before computing the bisection bias for the Judd version of the Müller- Lyer illusion, all the trials in which the participants failed to confirm their bisection before the 10 second response limit ran out were removed. This reduced the total number of trials from 984 to 975 trials. The bisection point was calculated as the distance between the final location of the middle fin and the true midpoint of the stimulus. For Stimulus A and Stimulus E in Figure 3 the bisection point was multiplied by -1 so that biases produced by the inward facing fins would be represented by a negative number and biases produced by the outward facing fins would be represented by a positive number. Group 3, in which no bias due to the fins was expected, the absolute value of the bisection point was used. After that, for each trial we computed the bisection bias as a percentage of shaft length. Pirate plots showing the effects of TMS on the mean, 95% CI and distribution of the bisection bias in the 6 Judd variants of the Müller-Lyer illusion are presented in Figure 8.
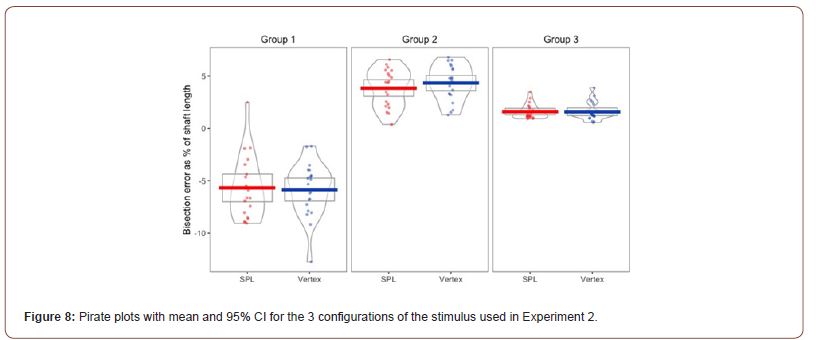
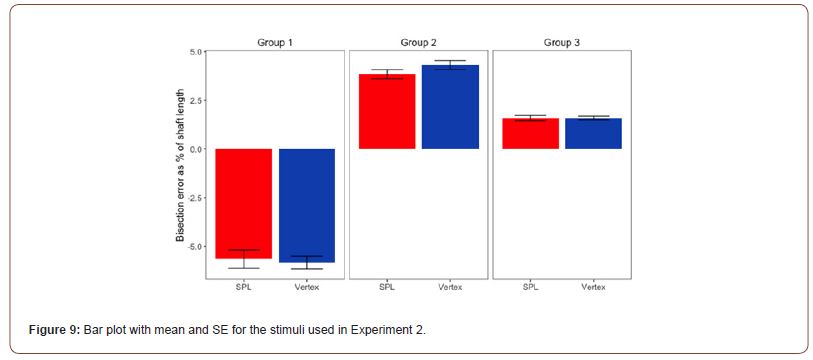
Statistical Analysis: Our prediction was that the cTBS stimulation of the SPL should have reduced the bisection bias elicited by the Judd variant of the Müller-Lyer illusion. Means and SE for the 3 configurations of the Judd variant of the Müller-Lyer used in Experiment 2 are presented in Figure 9.
In order to test our prediction, we carried out a 2 (Stimulation type: SPL vs Vertex) x 3 (Stimulus type: Group 1/ Group 2/ Group 3) Repeated Measure ANOVA. The Mauchly’s test for Sphericity for the stimulus factor (sig <.001) and for the 2-way interaction violated the assumption (sig. < .001), therefore we used the Greenhouse- Gassier correction.
The main effect for stimulation (F(1, 19) = .184, p = .673, η2= .01) was not significant, while the main effect for stimulus type was significant (F(1.264, 24.008)= 138.134, p < .001, η2=.879 ). The interaction between the two main effects was also not significant (F(1.245, 23.65) = 1.041, p=.363, η2=.052). Regarding the main effect for stimulus type, pairwise comparisons with a Bonferroni adjustment revealed that illusion strength was significantly decreased from Group 1 to Group 2 (-10 (95% CI, -12.15 to -7.85) %, p < .001), and from Group 1 to Group 3 (-7.49 (95% CI, -9.05 to -5.93) %, p < .001), and statistically increased from Group 2 to Group 3 (2.52 (95% CI, 1.49, 3.55) %, p < 0.001).
Inspection of Figure 3 & 10 suggests a possible reduction of the strength of the Müller-Lyer illusion caused by outward facing fins (Group 2) due to cTBS. This was tested with a paired samples t-test, which trended towards significance, t(19)=-1.932, p=.068, d = .043. This indicates that we replicated the previously found effects of the Judd variant of the Müller- Lyer illusion on bisection, but overall cTBS failed to influence that.
Experiment 3
Pre-processing and descriptive statistics: The behavioural data from experiment 3 was loaded into RStudio, and before computing the bisection bias for the Brentano version of the Müller-Lyer illusion, all the trials in which the participants failed to confirm their bisection before the 10 seconds response limit ran out were removed. This reduced the total number of trials from 984 to 977 trials. The bisection bias was calculated as the absolute value of the distance between the final location of the middle fin and the true midpoint of the horizontal shaft of the stimulus. After that, for each trial we computed the bisection bias as a percentage of shaft length. Then we computed the average bias per participant for each configuration of the stimulus, where a negative number meant a compression of one half of the shaft, and a positive number meant a bisection point consistent with the perceptual expansion of one half of the shaft. Pirate plots showing the mean, 95% CI and distribution of the bisection bias in the Brentano version of the illusion and its altered version are presented in Figure 10.
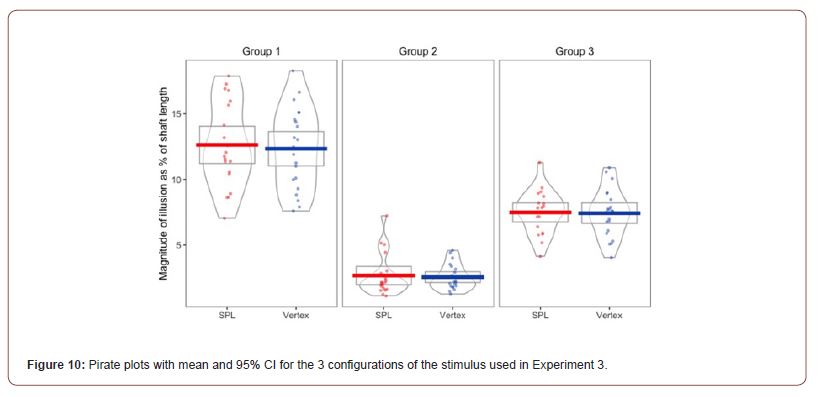
Statistical Analysis: Our prediction was that the cTBS stimulation of the SPL would reduce the bisection bias elicited by two of the three configurations of the ML stimuli used in this experiment see Methods Figure 4. Means and SE for the 3 configurations of the Brentano version of the Müller-Lyer used in Experiment 3 are presented in Figure 11.
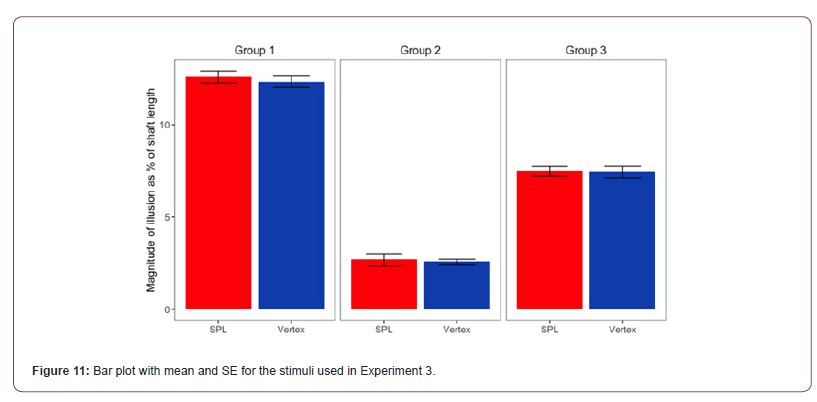
In order to test our prediction, we carried out a 2 (Stimulation type: SPL vs Vertex) x 3 (Stimulus type: Group 1/ Group 2/ Group 3) Repeated Measure ANOVA. The Mauchly’s test for Sphericity for the stimulus factor violated the assumption (sig. = 0.001), therefore we used the Greenhouse-Gassier correction.
The main effect for stimulation (F(1, 19) = .389, p = .54, η2= .02) was not significant, while the main effect for stimulus type was significant (F(1.261, 23.951)= 167.914, p < .001, η2=.898 ). The interaction between the two main effect was also not significant (F(2, 38) = .059, p=.943, η2=.003). Regarding the main effect for stimulus type, pairwise comparisons with a Bonferroni adjustment revealed that illusion strength was significantly increased from Group 1 to Group 2 (9.95 (95% CI, 8.44 to 11.45) %, p < .001), and from Group 1 to Group 3 (5.04 (95% CI, 4.1 to 5.99) %, p < .001), and statistically decreased from Group 2 to Group 3 (-4.9 (95% CI, -5.74, -4.06) %, p < 0.001).
This indicates that we replicated the previously found effects of the Brentano version of the Müller-Lyer illusion on bisection, but cTBS failed to influence that.
Group 2 stimuli see Figure 4 were not expected to produce a line bisection bias due to the expansion or contraction of apparent shaft length because the inducing arrows all faced in the same direction. However, although smaller than the biases found for the other stimuli, a small but consistent line bisection bias was found. We ran a one-sample t-test to test if a bisection error occurred for Group 2 after both cTBS stimulation. The performance recorded after the cTBS stimulation of the SPL (M=3.85, SD=1.80) indicated a significant bisection error t(19)=9.551, p<.001; and also the performance recorded after the stimulation of the Vertex (M=4.34, SD=1.69) was significant t(20)=11.758, p<.001. This result will be considered in the Discussion and is consistent with the previous literature.
Discussion
The main purpose of this study was to test the hypothesis that the SPL is involved in the processing of visual extent. In order to achieve this aim, a 2-day cTBS study was carried out. On one day of the experiment the cTBS stimulation was delivered over the EEG electrode CP1 (used as a proxy for the left SPL region) while three different experiments were presented: an eye-movement task where the three different configurations of the Müller-Lyer illusion were presented, a bisection task where six different configurations of the Judd variant of the Müller-Lyer illusion were presented, and finally a bisection task where the two configurations of the Brentano version of the Müller-Lyer illusion and 4 more configurations were presented. On the other day of the experiment cTBS was delivered over the Vertex (a control site for the cTBS stimulation), while the same three tasks were presented. We predicted that the cTBS over the SPL would reduce the effect of the illusion on saccade amplitudes and would reduce the bisection bias generated by the Judd variant and the Brentano variant of the Müller-Lyer stimuli compared the cTBS over the vertex. The data failed to support our predictions.
We found a significant difference in saccade amplitudes depending on the stimulus type, which meant that the illusion of extent was present in the data. This replicates previous findings [4-7,32] however, we found that the cTBS stimulation over the SPL did not significantly affect the saccade amplitudes recorded during the presentation of the ML. In our task the Müller-Lyer stimulus remained visible while saccades and fixations were made, which may have allowed the visual system to compensate and correct for TMS effects. In a future study we are planning to investigate eye movement tasks in which the Müller-Lyer stimulus is occluded before the saccade is made.
In addition to this, we found that the cTBS over the left SPL reduced the perceptual bisection bias induced by the Judd version of the ML just for one configuration of the stimuli stimulus E in figure 5, but this effect only trended towards significance; moreover, cTBS over the SPL did not affect the bisection bias generated by the Brentano version of the ML stimuli compared to cTBS over the vertex.
The results of this study do not support the hypothesis that the SPL is critical for the perception of visual extent, but because the study had several limitations is not possible to rule out the hypothesis either. The design made the assumption that cTBS delivered to the control location, which was the vertex of the skull, would not influence neural activity in the SPL or behavioural task performance. This assumption is called into question by the findings of Jung J, et al. [33], who delivered TMS stimulation (120% of RMT) to the Vertex concurrently with functional BOLD MRI. They found that Vertex TMS produced a significant deactivation in a number of brain regions including the right SPL and the precuneus. The general effect was deactivation in the ‘default mode network’, which may have had the knock-on effect of an increase in excitability in the ‘salience’ network. While the cTBS we delivered to SPL would be expected to produce BOLD activation [34], rather than the deactivation likely caused by the Vertex stimulation, given the highly interconnected nature of the brain we suspect that the control condition was not inert. An improved design would have incorporated an additional no-TMS control condition, which would have allowed us to establish whether Vertex cTBS had any effect on our behavioural tasks. Without a no- cTBS condition, it cannot be ruled out that Vertex and SPL cTBS both had similar effects on the tasks we presented in this study.
Another methodological limitation is that in this study we asked participants to wear an EEG cap and then we located the SPL by selecting the electrode CP1 (on the left hemisphere) on the 10- 20 EEG system as the target for the cTBS stimulation. According to a previous study this a legitimate method of localisation of cortical areas Herwig U, et al. [35], and the CP1 is the electrode that has the closest proximity to the SPL [27]. However, a study conducted by Sparing R, et al. [36], has showed that the EEG method of location of cortical regions is not very reliable. In their study they compared 5 different modalities of localisation of the left motor cortex: the 10-20 EEG system, the standardized function-guided procedure, the structural MR image, the individual functional MRI data and the group functional MRI data Sparing R, et al. [36], and they measured both MEP amplitudes and spatial accuracy of cortical regions. They discovered that out of the 5 modalities, the 10-20 EEG gave the lowest MEP amplitudes and spatial accuracy of cortical regions, while the best results were found after the localisation guided by individual functional MRI data. Therefore, the results we obtained need to be considered with caution, because we cannot be totally convinced that the cTBS stimulation was exactly delivered over the Superior Parietal Lobule.
Another consideration is the fact that the cTBS stimulation was delivered just over the left Superior Parietal Lobule. Corbetta M, et al. [37], found that a bilateral activation of the Superior Parietal Lobule occurs during the early spatial shift of attention, which is a covert form of eye movement “readiness”. So, a possible explanation for the lack of significant result is that targeting just the left Superior Parietal Lobule is not enough to reduce the centre of gravity effect that may underly the ML illusion. A possible solution for this problem would be using the cTBS bilaterally on the Superior Parietal Lobule. Such bilateral cTBS studies have been done in the past, for example, for treating tinnitus and auditory hallucinations Schraven SP, et al. [38], to study how learning new vocabulary happens Sliwinska MW, et al. [39], or to study the attentional network [40].
We did not predict the significant line bisection biases found in Group 2 stimuli see in Figure 4 because the inducing arrows all faced in the same direction. However, these findings are consistent with existing literature on line bisection biases [41,42]. We found no effects of cTBS on these line bisection biases.
Finally, the statistical power of the study for detecting cTBS effects was relatively low (power = 0.8 to detect an effect size of d = 0.56 for our one tailed prediction). In conclusion, further studies with greater statistical power and methodological improvements discussed above should be conducted to test the hypothesis that a subregion of SPL supports the perception of visual extent.
Acknowledgement
None.
Conflict of interest
None of the authors have a conflict of interest.
References
- Biagi N, Goodwin C, Field DT (2022) RTMS of the superior parietal lobule improves contrast discrimination but has no effect on the perception of distance between stimuli in the image plane. Perception 51(10): 3010066221114571.
- Harvey BM, Fracasso A, Petridou N, Dumoulin SO (2015) Topographic representations of object size and relationships with numerosity reveal generalized quantity processing in human parietal cortex. Proc Natl Acad Sci U S A 112(44): 13525-13530.
- Schwarzkopf DS (2015) Where Is Size in the Brain of the Beholder? Multisens Res 28(3-4): 285-296.
- Binsted G, Elliott D (1999) The Müller–Lyer illusion as a perturbation to the saccadic system. Human Movement Science, 18(1): 103-117.
- Delabarre EB (1898) A Method of Recording Eye-Movements. The American Journal of Psychology 9(4): 572-574.
- Festinger L, White CW, Allyn MR (1968) Eye movements and decrement in the Müller-Lyer illusion. Perception & Psychophysics 3(5): 376-382.
- Stratton GM (1906) Symmetry, linear illusions, and the movements of the eye. Psychological Review 13(2): 82-96.
- Yarbus AL (1967) Eye movements and vision.
- Coren S (1986) An efferent component in the visual perception of direction and extent. Psychol Rev 93(4): 391-410.
- Zimmermann E, Lappe M (2010) Motor signals in visual localization. J Vis 10(6): 2.
- McLaughlin SC (1967) Parametric adjustment in saccadic eye movements. Perception & Psychophysics 2(8): 359-362.
- Garaas Tyler W, Pomplun Marc (2011) Distorted object perception following whole-field adaptation of saccadic eye movements. J Vis 11(1): 2.
- Müsseler J, van der Heijden AHC (2004) Two spatial maps for perceived visual space: Evidence from relative mislocalizations. Visual Cognition 11(2-3): 235-254.
- Panouillères M, Habchi O, Gerardin P, Salemme R, Urquizar C, et al. (2014) A role for the parietal cortex in sensorimotor adaptation of saccades. Cereb Cortex 24(2): 304-314.
- Weidner R, Fink GR (2007) The Neural Mechanisms Underlying the Müller-Lyer Illusion And Its Interaction with Visuospatial Judgments. Cereb Cortex 17(4): 878-884.
- Mancini F, Bolognini N, Bricolo E, Vallar G (2010) Cross-modal Processing in the Occipito-temporal Cortex: A TMS Study of the Müller-Lyer Illusion. J Cogn Neurosci 23(8): 1987-1997.
- Mack A, Heuer F, Villardi K, Chambers D (1985) The dissociation of position and extent in Müller-Lyer figures. Percept Psychophys 37(4): 335-344.
- Field DT, Goodwin C (2016) Representation of visual distance in the brain. Reception 45: 116.
- Goodwin C (2021) fMRI investigations into the effect of spatial attention shifting and visual perception of separation on BOLD responses in the superior parietal lobule. University of Reading, United Kingdom.
- Koyama M, Hasegawa I, Osada T, Adachi Y, Nakahara K, et al. (2004) Functional Magnetic Resonance Imaging of Macaque Monkeys Performing Visually Guided Saccade Tasks: Comparison of Cortical Eye Fields with Humans. Neuron 41(5): 795-807.
- Huang YZ, Edwards MJ, Rounis E, Bhatia KP, Rothwell JC (2005) Theta Burst Stimulation of the Human Motor Cortex. Neuron 45(2): 201-206.
- Wassermann EM, Lisanby SH (2001) Therapeutic application of repetitive transcranial magnetic stimulation: A review. Clin Neurophysiol 112(8): 1367-1377.
- Rossi S, Hallett M, Rossini PM, Pascual-Leone A (2009) Safety, ethical considerations, and application guidelines for the use of transcranial magnetic stimulation in clinical practice and research. Clinical Neurophysiology 120(12): 2008-2039.
- Brainard DH (1997) The Psychophysics Toolbox. Spat Vis 10(4): 433-436.
- Kleiner M, Brainard DH, Pelli D (2007) What’s new in Psychtoolbox-3? Perception.
- Pelli DG (1997) The VideoToolbox software for visual psychophysics: Transforming numbers into movies. Spat Vis 10(4): 437-442.
- Koessler L, Maillard L, Benhadid A, Vignal JP, Felblinger J, et al. (2009) Automated cortical projection of EEG sensors: Anatomical correlation via the international 10–10 system. Neuroimage 46(1): 64-72.
- Quartarone A, Bagnato S, Rizzo V, Morgante F, Sant’Angelo A, et al. (2005) Distinct changes in cortical and spinal excitability following high-frequency repetitive TMS to the human motor cortex. Exp Brain Res 161(1): 114-124.
- Groppa S, Oliviero A, Eisen A, Quartarone A, Cohen LG, et al. (2012) A practical guide to diagnostic transcranial magnetic stimulation: Report of an IFCN committee. Clin Neurophysiol 123(5): 858-882.
- Feredoes E, Tononi G, Postle BR (2006) Direct evidence for a prefrontal contribution to the control of proactive interference in verbal working memory. Proceedings of the National Academy of Sciences 103(51): 19530-19534.
- Schutter DJLG, van Honk J (2006) A Standardized Motor Threshold Estimation Procedure for Transcranial Magnetic Stimulation Research. J ECT 22(3): 176-178.
- de Brouwer AJ, Brenner E, Medendorp WP, Smeets JBJ (2014) Time course of the effect of the Müller-Lyer illusion on saccades and perceptual judgments. J Vis 14(1): 4.
- Jung J, Bungert A, Bowtell R, Jackson SR (2016) Vertex Stimulation as a Control Site for Transcranial Magnetic Stimulation: A Concurrent TMS/fMRI Study. Brain Stimul 9(1): 58-64.
- Agnew ZK, Banissy MJ, McGettigan C, Walsh V, Scott SK (2018) Investigating the Neural Basis of Theta Burst Stimulation to Premotor Cortex on Emotional Vocalization Perception: A Combined TMS-fMRI Study. Front Hum Neurosci 12: 150.
- Herwig U, Satrapi P, Schönfeldt-Lecuona C (2003) Using the International 10-20 EEG System for Positioning of Transcranial Magnetic Stimulation. Brain Topogr 16(2): 95-99.
- Sparing R, Buelte D, Meister IG, Paus T, Fink GR (2008) Transcranial magnetic stimulation and the challenge of coil placement: A comparison of conventional and stereotaxic neuronavigational strategies. Hum Brain Mapp 29(1): 82-96.
- Corbetta M, Shulman GL, Miezin FM, Petersen SE (1995) Superior Parietal Cortex Activation During Spatial Attention Shifts and Visual Feature Conjunction. Science 270(5237): 802-805.
- Schraven SP, Plontke SK, Rahne T, Wasserka B, Plewnia C (2013) Hearing safety of long-term treatment with theta burst stimulation. Brain Stimul 6(4): 563-568.
- Sliwinska MW, Elson R, Pitcher D (2021) Stimulating parietal regions of the multiple-demand cortex impairs novel vocabulary learning. Neuropsychologia 162: 108047.
- Vesia M, Niemeier M, Black SE, Staines WR (2015) The time course for visual extinction after a ‘virtual’ lesion of right posterior parietal cortex. Brain Cogn 98: 27-34.
- Dellatolas G, Vanluchene J, Coutin T (1996) Visual and motor components in simple line bisection: An investigation in normal adults. Brain Res Cogn Brain Res 4(1): 49-56.
- Varnava A, McCarthy M, Beaumont JG (2002) Line bisection in normal adults: Direction of attentional bias for near and far space. Neuropsychologia 40(8): 1372-1378.
-
Nicolo Biagi*. The Role of the Superior Parietal Lobule in the Müller-Lyer Illusion: A TMS Study. Open Access J Addict & Psychol 6(3): 2023. OAJAP.MS.ID.000638.
Müller-Lyer Illusion; Superior Parietal Lobule; Burst stimulation; Müller-Lyer stimuli; Neuron firing; Inherently spatial; Visual separation; Saccadic eye; Perceptual illusion; Proprioceptive information; Illusory biases; Spatial attention; Motor representation
-

This work is licensed under a Creative Commons Attribution-NonCommercial 4.0 International License.


