


 Research Article
Population-Based Metabolite-To-Parent Ratio Reference Intervals for Screening Atypical Metabolic Patterns in Urine Drug Testing
Received Date: July 03, 2026; Published Date: July 17, 2026
Abstract
Urine drug testing (UDT) is widely used in clinical toxicology to monitor medication adherence and detect illicit or non prescribed drug
use; however, interpretation of quantitative results can be challenging due to interindividual variability in drug metabolism. Population based
reference intervals (RIs) for urinary metabolite to parent drug ratios (MRs) have been previously established to characterize expected metabolic
patterns. The objective of this study was to evaluate implementation of these previously established MR RIs within a high throughput, automated
UDT workflow as a screening tool to identify specimens with atypical metabolic patterns. The population-based MR RIs were derived from
retrospective quantitative UDT data comprising approximately 2.2 million specimens from pain management and rehabilitation settings. For 18
parent–metabolite drug pairs, lower population based RI limits were applied as fixed thresholds to systematically screen for unusually low MR
values.
Implementation of RI based MR screening enabled automated, objective identification of specimens with MR values below expected population
norms across multiple drug classes. Selected specimen examples illustrate how this approach flags atypical metabolic patterns that may warrant
further clinical or analytical review. These findings demonstrate that population based MR reference intervals can be effectively integrated into
routine UDT workflows as a scalable and objective screening tool. This approach supports consistent identification of atypical metabolic results
while reducing reliance on subjective interpretation in high volume clinical laboratory settings.
Introduction
Urine Drug Testing (UDT) is widely used in clinical toxicology to assess medication adherence and to detect illicit or non-prescribed drug use [1,2]. Urine specimens may contain unmodified parent drugs as well as metabolites formed through phase I and phase II metabolism [3]. Phase I metabolism is primarily mediated by cytochrome P450 (CYP450) enzymes, with the extent of biotransformation influenced by enzyme activity and substrate specificity [4], whereas phase II metabolism commonly involves conjugation reactions such as glucuronidation [3]. Many UDT assays quantitatively measure both the administered drug and its metabolite, providing insight into the final metabolic processing and disposition of medications [2].
In definitive, quantitative UDT workflows, glucuronide conjugates formed during phase II metabolism, including those of the parent drug and phase I metabolites, are enzymatically cleaved prior to analysis. This approach enables quantification of both parent compounds and metabolites and supports calculation of the metabolite-to-parent drug ratio (MR) as an indicator of relative metabolic activity. Lower MR values generally reflect reduced CYPmediated metabolite formation, whereas higher ratios suggest increased metabolic conversion.
However, MR can also be influenced by additional physiological and pharmacological factors, including genetic polymorphisms affecting CYP450 enzyme activity, age, sex, comorbid conditions, diet, smoking status, environmental or chemical exposures, renal and hepatic function, drug–drug interactions (DDIs) with concomitant medications, dosage, timing of the last dose, route of administration, and medication adherence [4-7].
Together, these factors contribute to substantial interindividual variability in urinary drug metabolism. While traditional qualitative or quantitative threshold-based approaches provide standardized interpretation of UDT results, they may not explicitly account for population-based metabolic variability or atypical metabolic profiles. Population-based 95% reference intervals (RIs) for urinary MRs have been previously established to characterize expected metabolic patterns across commonly prescribed and monitored medications [8]. The present study builds on this prior work by focusing on practical implementation rather than reference interval derivation. Accordingly, the objective of this study was to evaluate the application of these previously established population-based MR RIs within a high-throughput, automated UDT workflow. Specifically, we describe the implementation of reference-intervalbased thresholds to systematically identify unusually low MRs across multiple parent-metabolite pairs and illustrate how this approach can be used to flag specimens with atypical metabolic patterns that may warrant further clinical or analytical review.
Methods
Population
This retrospective study analyzed approximately 2.2 million data records derived from patient urine specimens collected between January 2020 and September 2024 and submitted by pain management clinics and rehabilitation facilities across the United States. The dataset included specimens from 581,614 unique patients. All data were de-identified prior to analysis. The study protocol was approved by Aspire Institutional Review Board (IRB; Santee, CA).
Analytical method
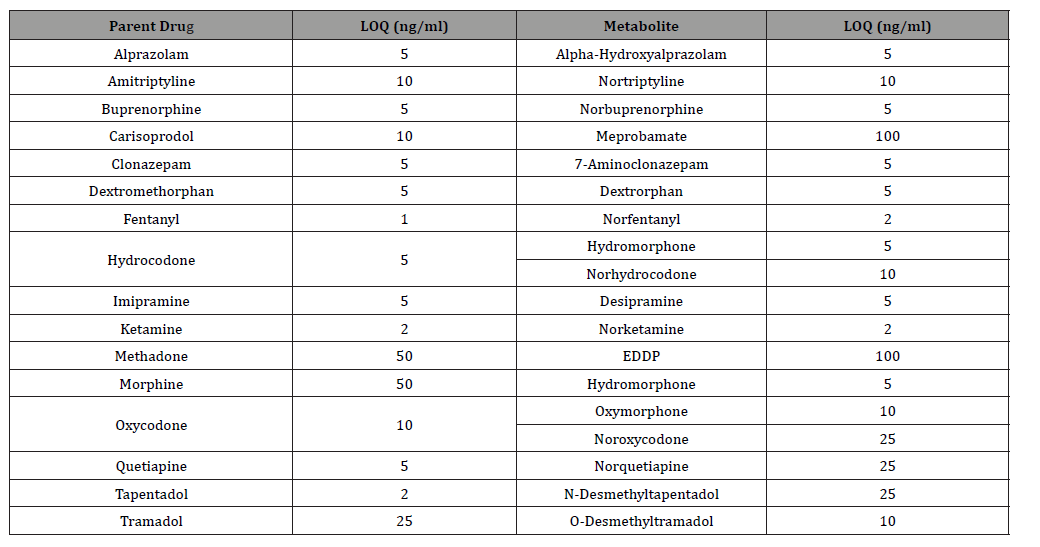
Urinary concentrations of parent drugs and their metabolites were quantified using a validated liquid chromatography-tandem mass spectrometry (LC-MS/MS) method, as previously described [8,9]. Briefly, samples were prepared using a dilute and shoot approach, with glucuronide conjugates enzymatically hydrolyzed by β glucuronidase prior to analysis. Quantitative analysis was performed using LC–MS/MS with established calibration and quality control procedures. Method performance characteristics, including calibration model, acceptance criteria, accuracy, and precision, were consistent with the previously validated method. Lower limit of quantitation (LOQs) for parent drugs and metabolites are shown in Table 1.
Table 1:Lower limit quantitation (LOQs) for parent drugs and metabolites.
Data and statistical analysis
Metabolite-to-parent drug ratios (MRs) were calculated as the concentration of the metabolite divided by the concentration of the corresponding parent drug, using urinary concentrations reported in ng/mL and uncorrected for creatinine. Because both parent drug and metabolite concentrations are similarly affected by urine dilution, use of uncorrected metabolite to parent ratios remains appropriate for population based screening. Population-based 95% RIs for urinary MRs corresponding to 18 parent-metabolite drug pairs were previously established based on the central 95% of the observed population distribution, with the lower and upper limits defined by the empirical 2.5th and 97.5th percentiles, respectively [8]. In the present study, the lower reference limits were applied as fixed thresholds to identify unusually low MR values; no additional recalculation or modification of reference intervals was performed. For drug pairs for which both medicated and non medicated reference intervals were previously reported, only the medicated reference intervals were applied, as these thresholds correspond to prescribed medication use and reflect those used in the automated screening workflow.
In addition to the population based 95% RIs, CYP specific lower MR thresholds shown in Figure 1 were derived previously using genotype predicted phenotype frequencies; the methodology and validation of these thresholds are described in detail in an independent study now in press [8].
Automated Review Process
Using the established RIs, an automated workflow was implemented to identify urine drug test specimens with atypically low MR values. Quantitative data were extracted daily from approximately 3,000 urine specimens, each comprising results for approximately 80 analytes. MR values were calculated for predefined parent–metabolite pairs and systematically screened against the lower reference limit (2.5th percentile). Specimens with MR values below the lower reference limit were flagged for further clinical or analytical review.
Results
To illustrate the application of population based metabolite to parent drug ratio (MR) reference intervals within an automated review framework, the norbuprenorphine to buprenorphine MR was used as an example. Figure 1 shows the previously established population distribution for this MR pair, with lower and upper reference limits defined by the 2.5th and 97.5th percentiles, respectively [8]. For this drug pair, MR values below 0.268 fall below the lower reference limit.
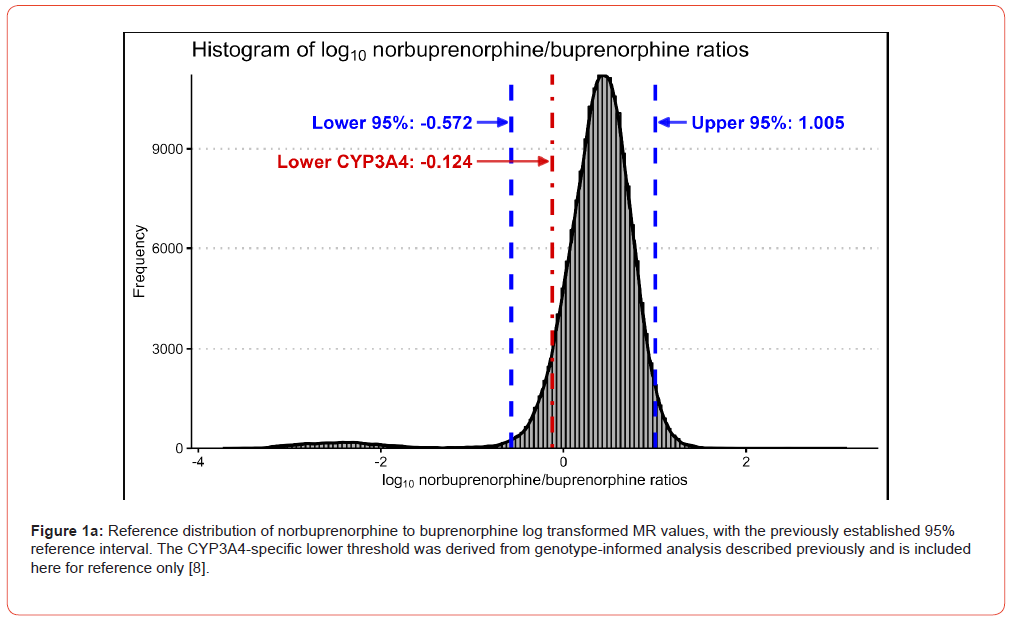


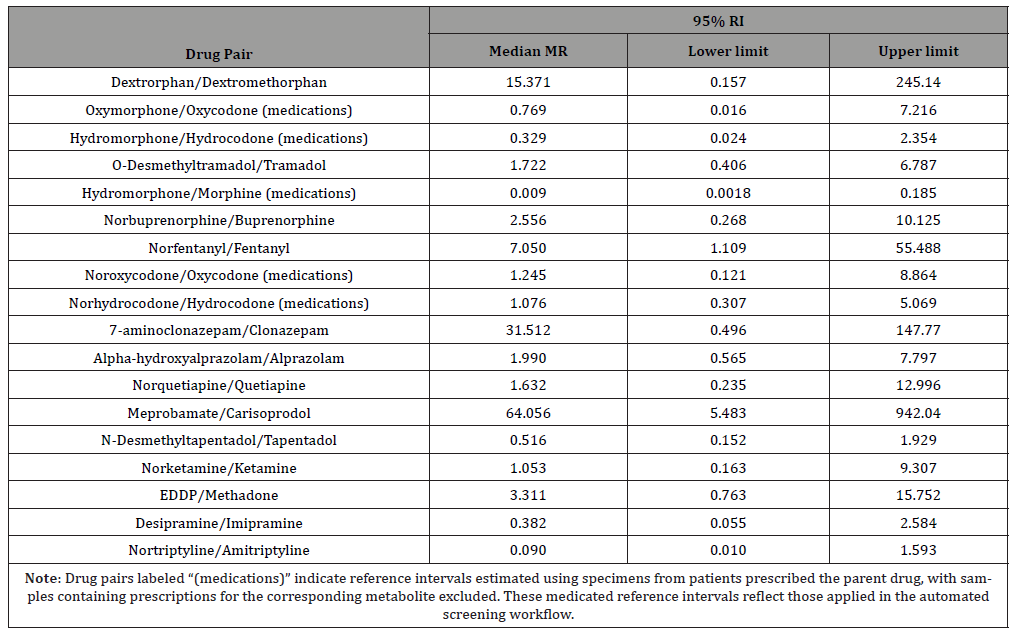
Table 2 summarizes the median MR values and corresponding lower and upper reference limits for the 18 parent-metabolite drug pairs evaluated [8].
Table 2:Populationbased median MR values and 95% reference interval limits for 18 parent–metabolite drug pairs.
To demonstrate the operational performance of the automated review process, selected examples of urine specimens flagged for atypically low MR values are shown in Table 3. Within this framework, MR values below the established lower reference limit were classified as atypical relative to population norms. Collectively, these results demonstrate that application of population based MR reference intervals enables systematic identification of specimens flagged as atypical.
Discussion
Urine drug testing provides a unique opportunity to evaluate an individual’s metabolic profile by examining end product analyte patterns relative to those of other individuals metabolizing the same medications. This population-based comparison establishes RIs that define expected, or “normal” metabolic behavior, and allows systematic identification of individuals with atypical metabolic patterns. MR values falling below the lower reference limit were considered atypical and flagged for further evaluation.
For the norbuprenorphine-to-buprenorphine ratio MR, values below 0.268 fall below the established reference interval. These markedly low MR values may reflect aberrant metabolic patterns arising from impaired metabolism, but have also been associated with specimen manipulation, including the addition of parent drug to the urine specimen. Consistent with prior work using norbuprenorphine-to-buprenorphine ratios to identify possible specimen manipulation, MR thresholds <0.02 have been strongly associated with deliberate buprenorphine addition, particularly when accompanied by disproportionately high parent drug concentrations [10-12]. Intermediate MR values above this threshold have previously been shown to represent a heterogenous group that may reflect either atypical metabolism or less definitive forms of specimen manipulation. Within this framework, the present analysis demonstrates that markedly low MR values can be consistently identified as atypical using population based reference interval screening.
Although norbuprenorphine‑to‑buprenorphine is presented as a representative example, the same reference‑interval–based screening approach was applied uniformly across all the parent– metabolite pairs examined. As outlined in the Introduction, MR values are primarily driven by CYP450-mediated metabolism and are modulated by physiological, pharmacological, and contextual factors. The effects of age and clinically relevant drug–drug interactions on urinary MRs have been examined previously and reported in separate analyses using the same patient population and analytical framework [13]. In addition, CYP450-informed reclassification of MR cutoffs incorporating genotype-predicted phenotype frequencies has been addressed in a complementary study currently in press [14]. Accordingly, they were not reevaluated here, as the present analysis was designed to assess implementation of population-based reference intervals as an objective screening tool rather than to attribute mechanistic causes of MR variability.
Overall, reference interval–based thresholds enable automated, high-throughput screening of UDT data to objectively identify atypical metabolic patterns. This reduces reliance on subjective interpretation and provides a practical, scalable approach for flagging specimens that may warrant further clinical or analytical review, while accounting for expected biological and analytical variability.
Limitation
Individual‑level clinical, genetic, pharmacologic, and behavioral data were unavailable in this retrospective UDT dataset, as is typical of high-throughput clinical laboratory workflows; therefore, interpretation was limited to population-level reference intervalbased screening rather than mechanistic attribution.
Conclusion
Although this study focused on use of lower reference interval thresholds as a screening tool, the same framework could be extended to assess upper-end MR values, longitudinal changes in MR, and drug-specific interpretation. Inclusion of patientlevel genetic information, such as CYP450 genotype or predicted metabolizer phenotype, may further improve MR reference intervals and help support more individualized assessment of atypical metabolic results. Future studies that incorporate both clinical and genetic data may allow development of stratified reference intervals based on factors such as age, sex, renal function, and metabolizer status. Overall, these findings show that reference interval-based MR screening is practical, reproducible, and well suited for high-throughput clinical laboratory use.
References
- Moeller KE, Lee KC, Kissack JC (2008) Urine drug screening: practical guide for clinicians. Mayo Clin Proc 83(1): 66-76.
- Christo PJ, Manchikanti L, Ruan X, Bottros M, Hansen H, et al. (2011) Urine drug testing in chronic pain. Pain Physician. 14(2): 123-143.
- Le J, Vivian E (2024) Drug Metabolism. In: Clinical Pharmacology. MSD Manual Professional Edition.
- Zhao M, Ma J, Li M, Zhang M, Jiang B, et al. (2021) Cytochrome P450 Enzymes and Drug Metabolism in Humans. Int J Mol Sci 22(23): 12808.
- Lin YS, Thummel KE, Thompson BD, Totah RA, Cho CW (2021) Sources of Interindividual Variability. Methods Mol Biol 2342: 481-550.
- Ereshefsky L, Riesenman C, Lam YW (1995) Antidepressant drug interactions and the cytochrome P450 system. The role of cytochrome P450 2D6. Clin Pharmacokinet 29 Suppl 1: 10-18.
- Cotreau MM, von Moltke LL, Greenblatt DJ (2005) The influence of age and sex on the clearance of cytochrome P450 3A substrates. Clin Pharmacokinet 44(1): 33-60.
- Pesce AJ, Cua A, Wickett E (2025) Urinary metabolic ratio of pain management and substance abuse treatment drugs: Reference interval. J Opioid Manag 21(7): 7.
- Krock K, Pesce A, Ritz D, Thomas R, Cua Ages, et al. (2017) Lower Cutoffs for LC-MS/MS Urine Drug Testing Indicates Better Patient Compliance. Pain Physician 20(7): E1107-E1113.
- Pesce A, Wickett E, Cua A Use of urinary metabolic ratio to detect possible deception in patients prescribed buprenorphine. J Opioid Manag.
- Warrington JS, Warrington GS, Francis-Fath S, Brooklyn J (2020) Urinary Buprenorphine, Norbuprenorphine and Naloxone Concentrations and Ratios: Review and Potential Clinical Implications. J Addict Med 14(6): e344-e349.
- Pytell JD, Whitley P, Passik SD, Bundy WL, Dawson E, et al. (2023) Association of Patients’ Direct Addition of Buprenorphine to Urine Drug Test Specimens With Clinical Factors in Opioid Use Disorder. JAMA Psychiatry 80(5): 459-467.
- Pesce A, Cua A, Wickett E (2025) Urinary metabolic ratio of pain management and substance abuse treatment drugs: Drug-drug interactions. J Opioid Manag 21(7): 69-95.
- Pesce A, Cua A, Wickett E CYP450 based reclassification of urinary metabolic ratio cutoffs for pain management and substance abuse treatment drugs. J Opioid Manag.
-

This work is licensed under a Creative Commons Attribution-NonCommercial 4.0 International License.