


 Letter to the Editor
Medication Trends Based on Urine Drug Test Observations, A Theoretical Study
Received Date: July 03, 2026; Published Date: July 13, 2026
Introduction
In the United States, nearly 5 billion prescriptions are dispensed by retail pharmacies each year. More than 66% of U.S. adults-over 130 million people-take prescription medications, and approximately 68% report taking at least one prescription drug daily. Physician prescribing patterns in pain practices are typically derived from pharmacy records. However, many patients do not take all medications as prescribed. We propose using urine drug test data as an alternative way to estimate medication ingestion in pain-treated populations. Because drug testing is used to assess compliance with prescribed therapy, it may more accurately indicate whether pain medication was ingested. For example, the Atlas Prescription Claims database lists the leading pain medications in 2024–2025 as hydrocodone bitartrate/ acetaminophen (12.3%), oxycodone HCl (8.68%), and oxycodone HCl/acetaminophen (7.15%). Other medications are also used to treat pain, including morphine, cyclobenzaprine, and codeine; naloxone has more recently been used to treat opioid overdose. We tracked use of selected prescribed drugs from 2017 through 2026 to estimate changes in prescribing practices over time.
Methods
Drug use was assessed based on the urinary presence of the drug or analyte.
Populations
This retrospective study included approximately 5.2 million urine specimens submitted for urine drug testing by pain physician clinics and rehabilitation facilities across all 50 U.S. states and the District of Columbia. Specimens were collected between April 2, 2017, and December 31, 2025, and represented 581,614 patients. No exclusion criteria were applied to patient selection. Repeat specimens were excluded, and all data were deidentified by assigning unique identification numbers to patients and specimens. Specimens containing potential interfering drugs were excluded. Interfering drugs included fluoxetine, paroxetine, bupropion, citalopram, sertraline, venlafaxine, duloxetine, risperidone, trazodone, haloperidol, aripiprazole, cyclobenzaprine, amphetamine, and THC. The presence of each drug excretion product was identified and quantified; when the excretion product was detected, the specimen was scored as positive for that medication.
The drug test
Quantitative urine drug testing was performed at Precision Diagnostics using a highly sensitive, clinically validated LC-MS/MS method capable of detecting low concentrations of the analytes. No retested samples were included, because repeat specimens were excluded. Data were deidentified by assigning unique patient identification numbers and specimen numbers to patients and specimens, respectively.
Analytical Method
Urinary concentrations of the different parent drugs were analyzed using LC-MS/MS. Briefly, a Shimadzu 20-XR series binary pump systems, well-plate autosampler, and thermos stated column oven paired with a Sciex 6500/6500+ mass spectrometer were used for the analysis of all drugs. Chromatographic separation was achieved using a methanol-formic acid-water gradient on a 50 x 4.6 mm, 2.6 μm Kinetex phenyl-hexyl column (Phenomenex, Torrance, CA) kept at 40◦C. Samples were prepared by the “dilute and shoot” method and hydrolyzed with β-glucuronidase prior to analysis. Thus, calculated concentrations represent the sum of both free and conjugated forms. Results were analyzed using Indigo Bio Automation Ascent software (Indianapolis, IN), using a 4-point calibration curve with linear fit and 1/x2 weighting. Calibrators were deemed acceptable if they were within 20% of expected concentrations and with R2 value greater than 0.98. The interassay coefficient of variation (CV) of allanalytes at the lower limit of quantitation (cutoff values) were evaluated to be within 20% (most were within 10% CV).
Results
Medication positivity varied by analyte over the study period. Oxycodone remained comparatively stable and was used as a reference for estimating expected year-to-year variation, which was approximately 1%. Changes greater than this threshold were interpreted as evidence of changing medication use or prescribing patterns.
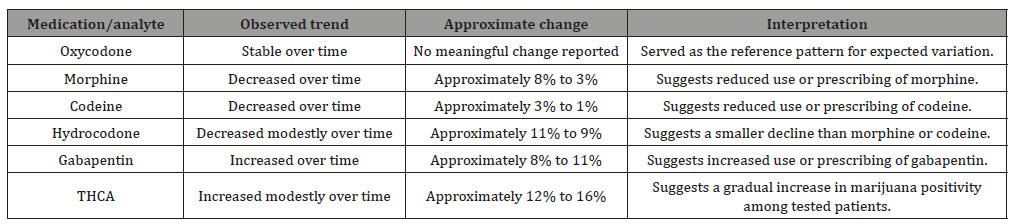
Taken together, these results indicate declining positivity for several opioid medications, particularly morphine and codeine, a modest decline in hydrocodone, and increasing positivity for gabapentin and THCA. The modest rise in THCA positivity was smaller than expected given recent changes in marijuana-related laws.
Discussion
These findings suggest that prescribing patterns among these physician groups can be monitored using urine drug test data. Based on the oxycodone data, the expected year-to-year variation was approximately 1%. Interpreted within this range, the data show declining use of morphine, hydrocodone, and codeine, while gabapentin use increased over time. Given recent changes in laws that have reduced restrictions on marijuana use, we expected a larger increase in positive marijuana findings; however, marijuana positivity increased only modestly over the study period.
-

This work is licensed under a Creative Commons Attribution-NonCommercial 4.0 International License.