 Research Article
Amphetamine/Methamphetamine Concentrations in Urine and Oral Fluid
Agnes Cua, Kevin Krock, Richard Thomas, Erin Hoyle, Jenelyn Sasis, and Amadeo J Pesce*
Precision Diagnostics LLC, San Diego, CA, USA
Amadeo J Pesce, Professor, Precision Diagnostics LLC, 4215, Sorrento Valley Boulevard, San Diego, CA 92121, United States.
Received Date: August 24, 2023; Published Date: September 01, 2023
Abstract
We characterized the metabolic ratio of amphetamine to methamphetamine in urine and oral fluid. We observed that in urine, the ratio of metabolite to parent drug decreased as the concentration of the parent drug increased. In contrast the metabolic ratio remained relatively constant in oral fluid. This is an example of the differences in drug processing between the two matrices.
Keywords:Amphetamine; Methamphetamine; Urine; Oral fluid; Metabolic ratio
Background
Methamphetamine in its d form is a powerful illicit drug. It is partially metabolized to amphetamine [1]. In these subjects the drug can be detected in both urine and oral fluid. The presence of the amphetamine metabolite along with methamphetamine implies illicit drug use. The acceptance of oral fluid testing by SAMHSA has made a better understanding of drug deposition into this fluid space of major interest [2]. We wished to establish if there was a difference in the metabolic concentrations of these drugs in urine and oral fluid.
Methods
The methamphetamine and amphetamine concentrations were determined by the method of Krock et al. [3], and the data collected and visualized by the method of Pesce et al. [4]. The patient population was that described by Pesce et al. [5]. The study was approved by WCG IRB Puyallup, WA. The concentrations of the urine and oral fluid amphetamine and methamphetamine were segregated into the concentration of the parent drug methamphetamine in the following manner or oral fluid 1-20ng/mL, 20-50ng/mL, 50- 100ng/mL, 100-500ng/mL500-1000ng/mL, 1000-5000ng/mL, and above 5000ng/mL. The urine concentrations were segregated in the same manner, but the lowest methamphetamine bin was from 50-500ng/mL.
Results
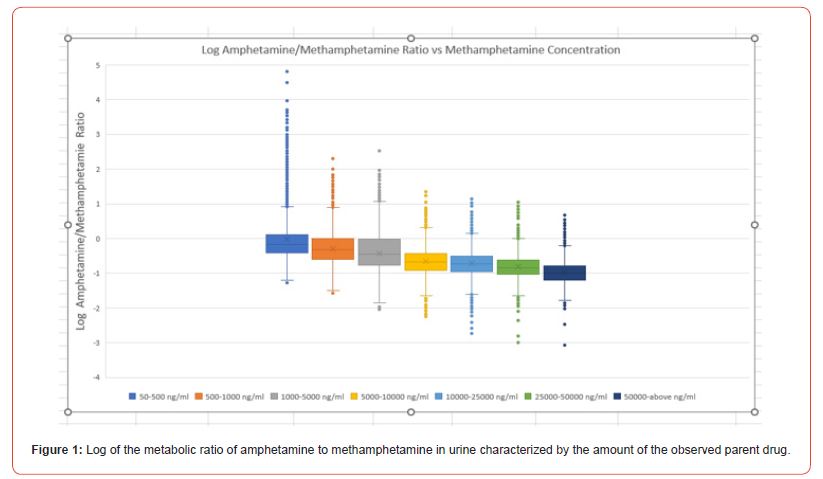
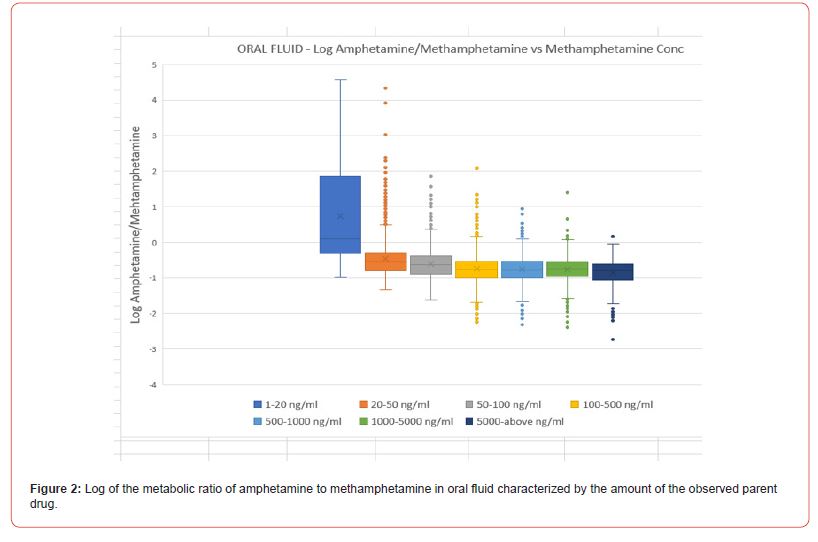
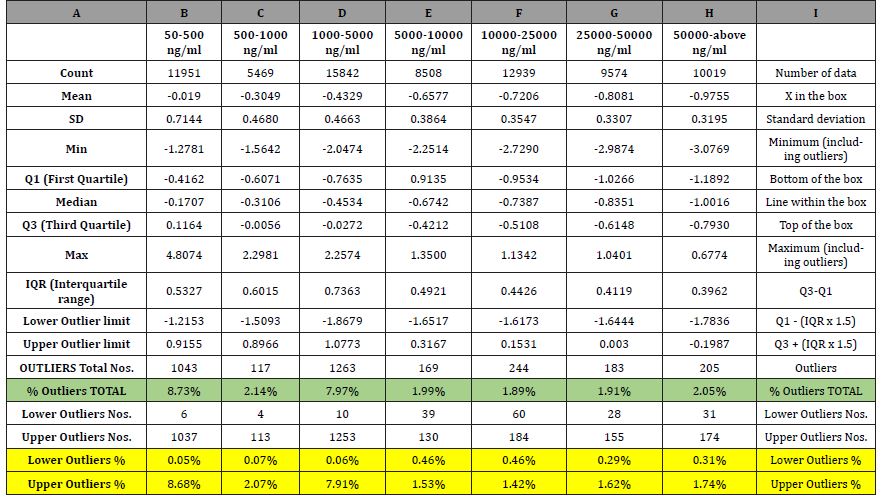
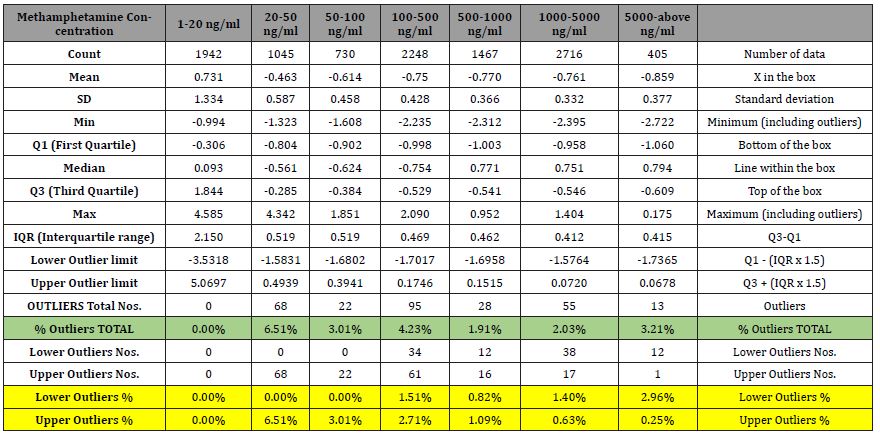
The results of 74,302 positive urine specimens and 10,553 oral fluid specimens are given in Table 1 & 2. These results were graphed as box plots for better visual understanding Figures 1 & 2. The results were converted to the antilog for a better description of the ratio. Table 3 The urine ratio of amphetamine to methamphetamine decreased as the amount of methamphetamine increased. It went from about 0.5 to 0.1 over the studied methamphetamine concentration ranges. In contrast the ratio of these two compounds was nearly constant in oral fluid as a function of methamphetamine concentration these values ranged from 0.27 to 0.16, a much smaller difference.


Table 1:Urine Amphetamine metabolism. The excretion was categorized by the amount of parent drug and the log of the ratio of amphetamine to methamphetamine calculated. The other statistical parameters such as mean, median and standard deviation as well as the outliers using the Tukey method were also calculated.

Table 2:Oral Fluid Amphetamine metabolism. The excretion was categorized by the amount of parent drug and the log of the ratio of amphetamine to methamphetamine calculated. The other statistical parameters such as mean, median and standard deviation as well as the outliers using the Tukey method were also calculated.

Table 3:Data from tables 1 and 2 summarized as the antilog for clarity. The bin sizes are different between urine and oral fluid.

Discussion
The presence of amphetamine along with methamphetamine is considered proof of methamphetamine use [2]. Baselt lists that about 47% of the methamphetamine is excreted and the amphetamine excretion is about 7% (6). A metabolic ratio of about 15%. In our studies we found in urine the metabolic ratio varied from about 0.5 to 0.1. In contrast the oral fluid metabolic ratios were near constant at about 0.27 to 0.16.
These observations show that there is a difference between the two testing matrices, urine, and oral fluid. In the case of urine, the higher the methamphetamine, the lower the metabolic ratio, whereas this does not seem to be true for oral fluid. We propose that the lower concentrations of the metabolite to parent drug at higher parent drug concentration reflects saturating metabolism of the methamphetamine.
One possible explanation for the difference between the two matrices is ion trapping. According to the Wikipedia definition ion trapping “is the build-up of a higher concentration of a chemical across a cell membrane due to the pKa value of the chemical and difference of pH across the cell membrane. This results in basic chemicals accumulating in acidic bodily fluids such as the cytosol, and acidic chemicals accumulating in basic fluids.” Our method of collection using the Quantisol collection device does not allow us to determine the pH of oral fluid.
Acknowledgement
All the authors are employees of Precision Diagnostics LLC.
Conflict of Interest
There are no conflicts of interest.
References
- (2023) Methamphetamine.
- Ron Flegel (2022) Regulatory Program Updates and Mandatory Guidelines. Center for Substance Abuse Prevention. Drug Testing Advisory Board.
- Krock K, Pesce A, Ritz D, Thomas R, Cua A, et al. (2017) Lower Cutoff for LC-MS/MS Urine Drug Testing Indicates Better Patient Compliance. Pain Physician 20(7): E1107-E1113.
- Pesce AJ, Chandler N, Ackerman G (2021) Information Technology Structure for Urine Drug Testing Reports, 21st Century Pathol 1 (1): 103.
- Pesce A, Suhandynata R, Ritz D, Thomas R, Ackerman G, et al. (2021) Effects of a Pandemic and Isolation on Alcohol and Psychoactive Medication Use in a Population of Rehabilitation and Pain Patients. Ann Clin Lab Sci 51(5): 694-697.
- Randall C Baselt (2011) Disposition of Toxic Drugs and Chemicals. In: Man 9th Edn Biomedical Publications, CA, USA.
-
Agnes Cua, Kevin Krock, Richard Thomas, Erin Hoyle, Jenelyn Sasis, and Amadeo J Pesce*. Amphetamine/Methamphetamine Concentrations in Urine and Oral Fluid. Open Access J Addict & Psychol 7(4): 2023. OAJAP.MS.ID.000666.
Amphetamine; Methamphetamine; Urine; Oral fluid; Metabolic ratio; Oral Fluid; Metabolic concentrations; Urine concentrations; Parent drug; Drug use; Basic fluids
-

This work is licensed under a Creative Commons Attribution-NonCommercial 4.0 International License.


