 Short Communication
Virtualanthropy: Towards an Open-Source Tool for the Visualization of 2D Anthropology Images Positioned In 3D
Jean-Baptiste Barreau1* and Rozenn Colleter2
1CReAAH, CNRS, University of Rennes, Campus de Beaulieu Bât 24 RDC P009, Avenue du Général Leclerc, France
2INRAP (National Institute of Preventive Archeological Research) and AMIS, CNRS, University of Toulouse, Cesson-Sévigné, France
Jean-Baptiste Barreau, CReAAH, CNRS, University of Rennes, UMR 6566, Campus de Beaulieu Bât 24 RDC P009, Avenue du Général Leclerc, 35000 Rennes, France
Received Date: September 01, 2020; Published Date: September 15, 2020
Abstract
VirtualAnthroPy is a prototype application for creating files for 3D visualization of physical anthropology data. From topographic points and associated data contained in a spreadsheet, the objective is to allow archaeo-anthropologists to explore in 3D images mapped on plans. In addition to these positions, text and colorizations are also possible in order to provide additional information.
Introduction
Human footprints and bones from the past are often the only and last elements available to the archaeo-anthropologist to reconstruct our common history [1,2]. Systematic 3D digitization of their entirety, in situ and/or in the laboratory [3], is complex, timeconsuming and tedious and with objectives that may raise questions [4]. Either human bones, footprints [5,6] or hand- prints [7], their field surveys benefit at best from photogrammet- ric surveys [8,9] or, depending on the means and time allowed, at least one photo and/or a few topographic points [10]. When 3D models of these elements are produced, the associated files are sometimes difficult to use easily without a powerful com- puter [11]. On the basis of these first observations, we wanted to develop an application that could provide a global, simple and inexpensive answer in terms of time and hardware.
Presentation of the Software
Technical specifications
The application is currently still at the prototype stage and is developed with the Python 3.7 programming language, recently used in archaeology for machine learning [12], or geospatial analysis [13]. The output files are in ASCII format, written with the “os” library [14] which allows interaction with the operating system, or images, generated with the “opencv” library [15]. 3D positioning calculations are relatively simple and, for the moment, only require the “numpy” library [15]. The optional colorization of images requires the “colour” library in order to determine the hexadecimal color values following a gradient.
Interface and use
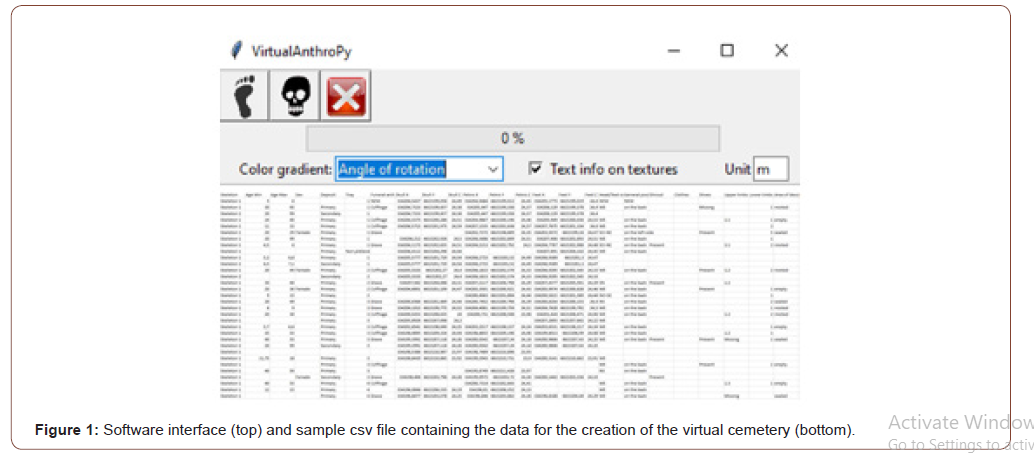
The overall objective of the VirtualAnthroPy application is the conversion of physical anthropology data, both quantitative and qualitative, contained in a spreadsheet pre-formatted for the needs of the software. In this first prototype, two data loading buttons are present (cf Figure 1 top) and correspond to the two topics discussed at the moment: footprints and skeletons. The idea being to homogenize and automate the import and export process, we will describe the common steps, by evoking the few differences in the input and output of the application.
The input file is in csv format. In the case of footprints, its structure is “name|x1|y1|z1|x2|y2|z2|image”. (x1, y1, z1) indicates the position of the heel, (x2, y2, z2) the position of the tiptoe and “image” the absolute path of the footprint image. Also developed as an extension of the Humanos software [16,17], the csv file concerning the skeletons is the one exported by this software through the “Export other data (CSV)” menu (cf Figure 1 bottom). It contains in particular the 3 positions of the skull, the pelvis and the feet, which are essential for our application.

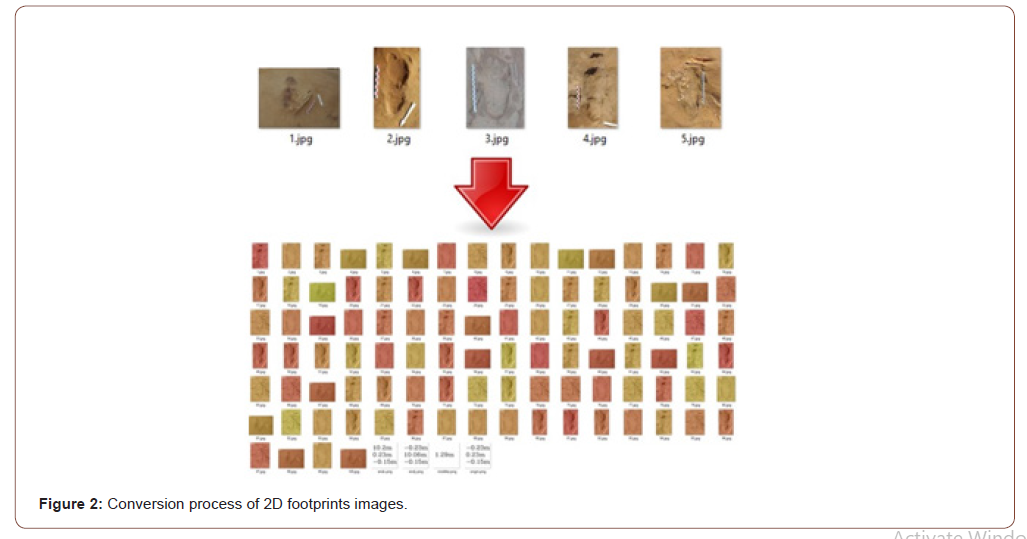
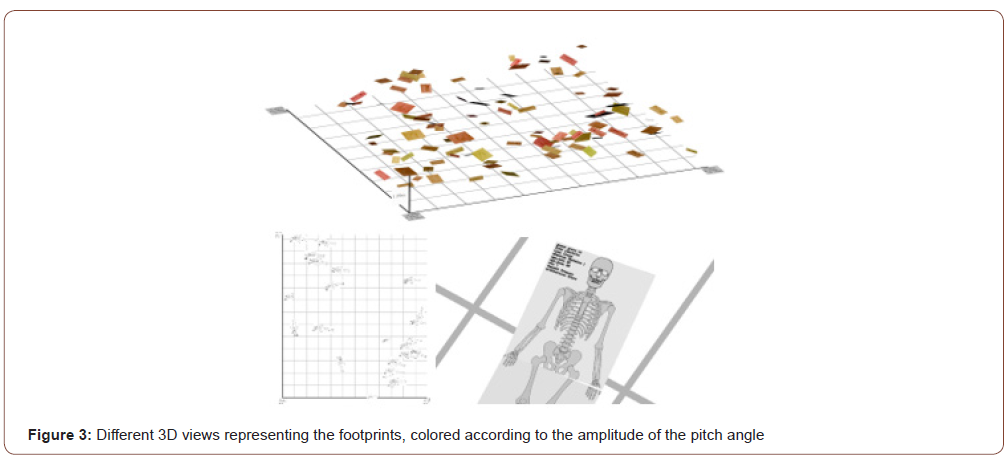
In order to be able to mark certain geometrical variations (width, length, pitch, roll and yaw angles [18]), the software creates copies of the source images, possibly colored according to a color gradient, going for the moment from yellow to red (cf Figure 2). For example, the differences in pitch angle are not easily readable on a global 3D view, and a variation in color makes it easy to highlight the elements that are the most inclined in relation to the others (cf Figure 3 top). Data relevant to each case are also written in the top right-hand corner directly on the texture. The copies of the images are reduced to the same maximum height in an optimization process. In the simple ex- ample of the Figure 2, five footprint images are included several times in the input csv file. The same texture can indeed be used several times in order to offer a real flexibility of use.


The application generates as output two other .obj and .mtl files, that contain the 3D positioning of the entities within an orthonormal frame, and their link with the above mentioned textures. In order to prove that everything went well, the software displays some statistics on the generated geometries. The obj file [19] is then opened by any 3D visualization and/or editing software.
Results and Prospects
Except for the creation of a correctly formatted csv, the software requires neither 3D modeling skills nor complex parameterization of the application. As an example with a basic pc (AMD A8- 9600 RADEON R7 3.10 GHz / 8GB RAM), processing a hundred footprints takes about ten seconds. The positioning of these 100 elements by an experienced 3D graphic designer would require paid software and plug-ins as well as a few hours of verification. On open-source GIS such as QGis, tedious drawings of 4-point polygons would also be necessary (Figure 3).
Currently in the application, the 3D positions of the skulls, pelvis, feet (for skeletons), heels and toes (for footprints) are fixedly located, at the centers of the upper and lower extremities of the planar elements. It would be interesting to implement an interface allowing the user to position these points himself on each image. The specificities of handprints have not been considered but should be quite similar to those of footprints. More generally, we want to offer tests of the application to various scientific communities concerned by the topic. Following scientific feedback, we will make modifications, post a GitHub version, and test virtual reality immersions.
Acknowledgment
None
Conflict of Interest
No conflict of interest.
References
- Mays (2010) The archaeology of human bones, Routledge.
- CJ Knüsel, J Robb (2016) Funerary taphonomy: an overview of goals and methods. J. Archaeol. Sci. 10: 655-673.
- D Errickson, I Grueso, S Griffith, J Setchell, T Thompson, et al. (2017) Towards a best practice for the use of active non-contact surface scanning to record human skeletal remains from archaeological contexts. Int. journal osteoarchaeology 27: 650-661.
- H Thwaites (2013) Digital Heritage: What Happens When We Digitize every- thing? Springer London, London, pp. 327-348.
- HL Dingwall, KG Hatala, RE Wunderlich, BG Richmond (2013) Hominin stature, body mass, and walking speed estimates based on 1.5 million-year-old fossil footprints at ileret, kenya. J. human evolution 64(6): 556-568.
- C Liutkus-Pierce, B Zimmer, S Carmichael, W McIntosh, A Deino, et al. (2016) Radioisotopic age, formation, and preservation of late pleistocene hu- man footprints at engare sero, Tanzania. Palaeogeogr. Palaeoclimatol. Palaeoecol 463: 68-82.
- P Galeta, J Bruzek, M Láznic ková-Galetová (2014) Is sex estimation from handprints in prehistoric cave art reliable? A view from biological and forensic anthropology. J. Archaeol. Sci. 45: 141-149.
- B Zimmer, C Liutkus-Pierce, ST Marshall, KG Hatala, A Metallo, et al. (2018) Using differential structure-from-motion photogrammetry to quantify erosion at the engare sero footprint site, Tanzania. Quat. Sci. Rev. 198: 226-241.
- J Duveau, G Berillon, C Verna, G Laisné, D Cliquet (2019) The composition of a neandertal social group revealed by the hominin footprints at le rozel (normandy, france). Proc. Natl. Acad. Sci. 116(39): 19409-19414.
- D Ferreri (2016) Human remains in archaeology. excavation, recording and analysis of data: the funerary context of san severo in classe. Groma. Documenting archaeology.
- J Huggett (2018) Computer applications in archaeology. The Encycl. Archaeol. Sci, p. 1-5.
- F Monna, J Magail, T Rolland, N Navarro, J Wilczek (2020) Machine learning for rapid mapping of archaeological structures made of dry stones-example of burial monuments from the khirgisuur culture, Mongolia. J Cult Herit.
- R Montagnetti, L Mandolesi (2020) Qgis, pyarchinit and blender: Surveying and management of archaeological data with open source solutions. Archeomatica, p. 10.
- G Van Rossum, FL Drake (1995) Python library reference.
- W Karel, M Doneus, G Verhoeven, C Briese, C Ressl, et al. (2013) Oriental: Automatic geo-referencing and ortho-rectification of archae- ological aerial photographs. XXIV International CIPA Symposium 2: 175-180.
- R Colleter, JB Romain, JB Barreau (2020) Humanos: an open source nomadic software database for physical anthropology and archaeology. Virtual Archaeol Rev 11: 94-105.
- N Yousefian (2020) Développement d’une interface web interactive pour la gestion et l’analyse d’une base de données arché Master’s thesis, ISTIC Université Rennes 1.
- HA Ardakani, T Bridges (2010) Review of the 3-2-1 euler angles: a yaw-pitch-roll sequence. Dep. Math. Univ. Surrey, Guildf. GU2 7XH UK, Tech. Rep.
- E Champion, H Rahaman (2020) Survey of 3d digital heritage repositories and platforms. Virtual Archaeol. Rev. 11: 1-15.
-
Jean-Baptiste Barreau, Rozenn Colleter. Virtualanthropy: Towards an Open-Source Tool for the Visualization of 2D Anthropology Images Positioned In 3D. Open Access J Arch & Anthropol. 2(5): 2020. OAJAA.MS.ID.000546.
-
Virtualanthropy, 2D Anthropology, 3D visualization, Physical anthropology
-

This work is licensed under a Creative Commons Attribution-NonCommercial 4.0 International License.


