 Research Article
The Scholar Bridge: Influence of Support Conditions in Bridge Deflection
Alice Kolychev1, Alyssa Lafferty1, Michael Padula1, Justin Dworacek1, Michael Liberti1, Connor Ammann1 and Adriana Trias Blanco2*
1Civil and Environmental Engineering, Rowan University, Undergraduate Student, USA
2Civil and Environmental Engineering, Rowan University, Assistant Professor, USA
Adriana Trias Blanco, Department of Civil and Environmental Engineering, Rowan University, USA
Received Date:May 14, 2024; Published Date:May 29, 2024
Abstract
The Scholar Bridge is offered to Rowan University undergraduate engineering students as part of a suite of Junior and Senior Engineering Clinic projects. This project provides students with the opportunity to have a hands-on structural engineering laboratory experience where they can transfer the knowledge learned in the classroom into visual self-conducted learning. After the completion of the project presented in this paper, students were able to (1) comprehend the relationship between load, deflection, and stiffness, (2) analyze point cloud data, and (3) understand the benefits of performing remote sensing. Some other topics developed in The Scholar Bridge are truss optimization, identification of zero force elements, analysis of the influence of support conditions on structural responses (bridges), and influence of column orientation on lateral drift (vertical structures). As part of the project deliverables, students are expected to produce educational videos that their peers can use to study for courses such as Statics and Structural Analysis. Another goal of this project is to promote the participation of female students in structural engineering. Even though the national average percentage for women in Structural Engineering is 15%, this clinic project has attracted a consistent female population, maintaining participation at 27% on average, contributing to supporting diversity, equity, and inclusion within the engineering community, which is a pillar of the Advisor’s goals.
Introduction
The current stage of the US bridges requires immediate action from the industry and academia. 42% percent of all bridges are at least 50 years old, and the percentage of bridges in “fair” condition continues increasing while the percentage of bridges in good condition decreases. The investment required to replace or repair the infrastructure is such that it would take until 2071 to complete the estimated improvements. For this reason, investments are also being made in researching new methods, materials, and preventive maintenance that can extend the service life of all bridges while prioritizing the focus on structures with severe conditions. Collaborating on this effort, The Scholar Bridge Clinic Project at Rowan University provides a platform for undergraduate students to develop meaningful research and learning experiences using state-of-the-art technologies and state-of-the-practice methods [1].
This project provides students with the opportunity to have a hands-on structural engineering laboratory experience where they can transfer the knowledge learned in the classroom into visual selfconducted learning. Some of the topics developed in The Scholar Bridge are (1) truss optimization, (2) truss zero force elements, (3) the influence of support conditions on structural responses (bridge), (4) the influence of column orientation on lateral drift (vertical structure), and (5) use of state-of-the-art remote sensing for lateral drift and deflection analysis. This clinic project has become quite popular among Civil Engineering students, and to promote its popularity, students are welcome to suggest new research areas to explore. As part of the project deliverables, students are expected to produce educational videos that their peers can use to study for courses such as Statics and Structural Analysis. Even though the national average percentage for women in structural engineering is 15%, this clinic project has attracted a solid female population, maintaining participation of 27% on average and supporting diversity, equity, and inclusion within the engineering community [2].
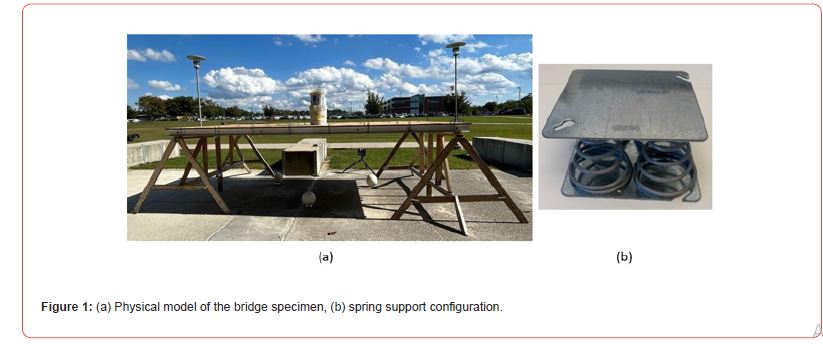
In particular, this manuscript presents the results of an investigation to determine the influence of support conditions of bridges on their deflection and stiffness. To accomplish this research, the students built a four-girder single-span bridge conformed by aluminum girders, plywood deck, aluminum channels as diaphragms, u-bolts to connect the girders to the deck, and two types of supports: (a) pin: wood blocks, and (b) springs: four parallel springs contained within two metal plates. The description of each test, data collection, analysis, and results are presented in the following sections [3].
Technology Implementation and Methodology
Physical Model
The project began with the construction of the physical model of a bridge using aluminum girders, diaphragms, and connectors with a plywood deck. The I-section girders, measuring 10.16 cm by 6.67 cm with a thickness of 0.48 cm, had a total weight of 17.99 Kg; the channels used for the diaphragms were 7.62 cm by 3.56 cm and weighed 1.58 kg each., the angles used for the girder/diaphragm connections measured 5.08 cm by 5.08 cm. This information provides insight into the dimensions and weights of the various components utilized to build the model for further structural analysis. The out-to-out width of the bridge was 243.84 cm with a 76.2cm girder spacing, and the total length of the girders was 457.2 cm. The bridge sits on 10 cm by 10 cm wooden supports, and the total weight of the bridge superstructure is approximately 226.8 Kg. To simulate damage at the support level, springs were placed under the supports of the girders, where each spring support was constructed by four parallel springs between two thin steel plates to distribute the load evenly. A single spring had a conical shape with a bottom diameter of 5.08 cm, a top diameter of 2.54 cm., a height of 5.08 cm, and a stiffness of 1.54 Kg/cm.

Light Detection and Ranging (LiDAR)
Since the data required for the structural analysis involved recording geometry changes, we needed to implement a geometrycapturing tool to measure the different deflections and other deformations of the bridge. For this, the team implemented a conventional tape measure to manually quantify the deflection at midspan of all girders throughout each test. Additionally, a state-ofthe- art geometry-capturing technology such as LiDAR was used to collect full-field information on the deflection and curvature of the bridge [4].
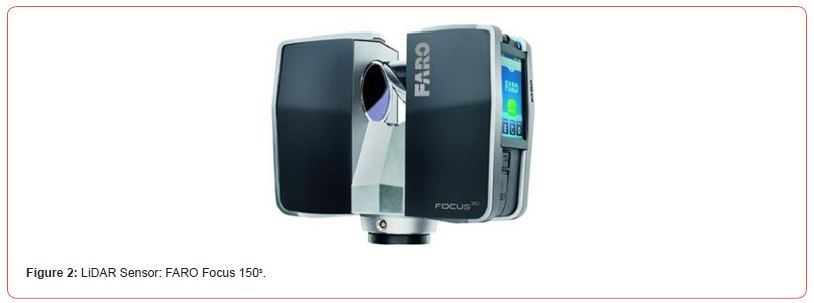
LiDAR sensors emit beams of light and use the time it takes for the emitted light beam to touch an object and return to the scanner, paired with the horizontal and vertical angles at the moment of emission of the light beam, to calculate the 3D (X, Y, Z) coordinates of each data point, (Trias Blanco, et al., 2023). The combination of all data points recorded by the LiDAR sensor is called a point cloud. These point clouds can then be analyzed to determine the geometry of the object scanned, such as the span length, the deflection, and the geometry of each structural component. The scanner used to collect data for this project was the FARO Focus 150s (Figure 2), and the settings on the LiDAR scanner were adjusted to be at a ¼ resolution. The scanner’s maximum resolution is 1/1, which provides an angular distance between two consecutive points of 0.009 degrees (Trias-Blanco, 2020). For this research, the scanner was set at a resolution of ¼. Therefore, the scans for each laboratory test had an angular distance of 0.036 degrees. This research was particularly interested in characterizing the deflection at midspan. Still, given the capacity of the LiDAR sensor to capture the full-field curvature of the bridge, additional analysis was conducted using the point cloud data [5].

Methodology
The tests consisted of seven configurations of support conditions, starting from placing all girders on top of the wooden blocks (pin supports) to having all girders over spring supports. The different support conditions implemented for each test are presented in Table 1, where Test 0 was taken as the control test since, for that test, all girders had pin supports. In Table 1, the color scale chosen provides information on the support condition for each girder throughout the tests, which is Green for the girders with pin/ pin support, Orange for girders with spring/pin support, and Red for the girders with spring/spring supports. The methodology for data collection consisted of quantifying the deflection of each of the test cases under two loading scenarios: (a) unloaded: which only accounted for the self-weight of the bridge, and (b) loaded: which included the self-weight of the bridge plus a 29.48 Kg load located at midspan and center line of the bridge. The difference between the loaded and unloaded scenarios was registered as the final deflection for each test. As mentioned, the data was collected using a traditional tape measure and a LiDAR sensor. When using the tape measure, the team recorded the deflection at midspan reading from the ground level up to the bottom of the bottom flange of the girders. For each test and each loading condition, the team executed two scans, which were then registered to assemble a point cloud for further data analysis [6].
Table 1: Support Condition Configuration.

For the registration of each set of scans, sphere targets were used to increase the level of accuracy of the point clouds. The sphere targets had a diameter of 23 cm and were located, forming a triangle between each other to define a reference plane. The initial data processing of each scan was performed through Autodesk ReCap, which allowed the transformation of the raw scans into a formal point cloud. Then, the ReCap files were exported into .pts files for further CloudCompare processing. Once in CloudCompare, the files were registered using the targets mentioned earlier to measure the deflection at midspan. The point cloud was trimmed at the location of interest using the Cross Section tool available in CloudCompare to ensure the deflection was precisely measured at midspan. A sample of a typical cross-section of the bridge at midspan is presented in Figure 3. On the contrary, the measurements taken via manual deflection quantification did not ensure that the measurements were taken at the same location or through a vertical line to the ground, which increases the possibility of error.

Data Processing
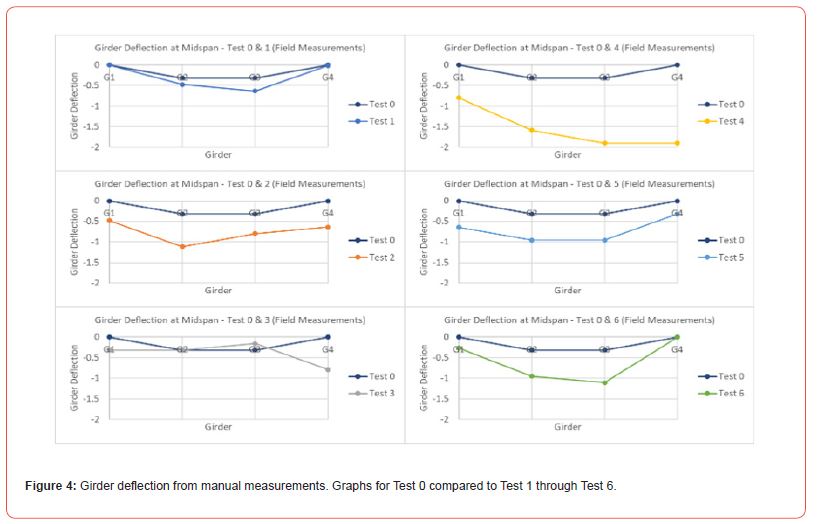
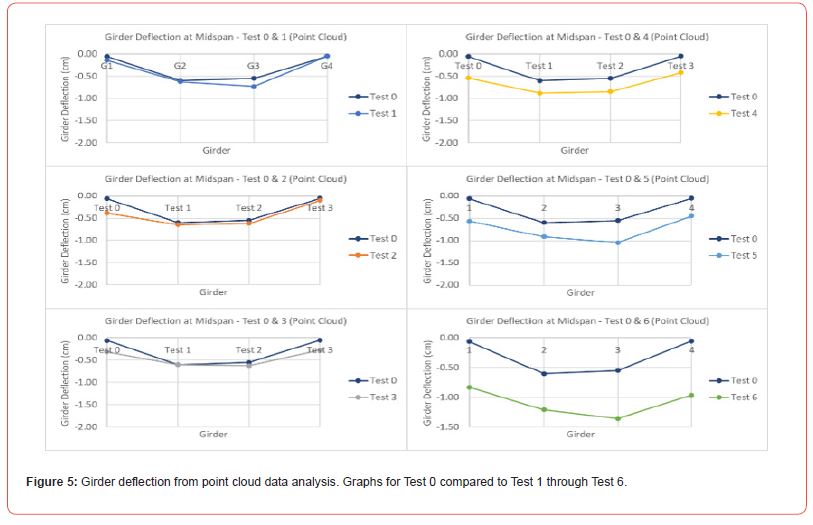
The bridge deflection was measured via manual quantification using a tape measure and via point cloud data analysis. The summary of the results gathered from the manual quantification of the bridge deflection is seen in Figure 4. The results present a high level of inconsistency, such as in the comparison of Test 0 with Test 3, as it is not expected for the bridge to have less deflection as we imposed dagame (springs) at the support of the girders. In comparison, the results presented in Figure 5, which includes processing the point cloud data, reflect a more consistent and reliable deflection pattern.


The summary of the deflection at midspan recorded via point cloud data analysis is presented in Table 2, where the color code follows the pattern established for the support conditions. Further analysis of the results found from the point cloud data measurements is presented in Table 3, where a ratio between Tests 1 through 6 concerning Test 0 was taken to understand the effects of the support conditions. The color code established for Table 3 starts from green at the smallest number within the table and goes through red for the highest number. This color code reflects the impact of the support conditions of the girder with the deflection. It is important to highlight that for the girders with spring/spring support conditions, the facia girders registered a higher deflection ratio than the internal girders. Based on the analysis of the results, it is seen that as the support conditions change from pin to spring, the deflection of the bridge is developed without a major difference between internal and facia girders, which also indicates a modification of the load path.
Table 2: Deflection measured via Point Cloud data analysis. [cm]

Table 3: The ratio of each test compared to Test 0.

Conclusion
From the point cloud data analysis, the influence of the support conditions on the deflection of the bridge was quantified in terms of the percent of damage, where the damage refers to the existence of flexible supports. The point cloud data analysis allowed us to visualize the change in transverse curvature, which refers to the increased deflection ratio of the facia girders in comparison to the internal girders as the presence of damage increased; this is also a reflection of changes in the load path, which is of great concern when performing load rating of bridges.
Future Steps
These results were registered during the Fall 2023 edition of The Scholar Bridge Clinic Project. In the Spring 2024 edition, the clinic is investigating the influence of the support damage condition on the frequency of the first mode of the same physical model and throughout the same support condition configuration presented on the seven tests performed, including Test 0, the test control.
Acknowledgement
Thank you to my clinic students, authors of this journal article, for their dedication and passion for structural and bridge engineering and for their commitment to making impactful research contributions to Rowan University.
Conflict of Interest
None.
References
- Bridges (2023) ASCE’s 2021 Infrastructure Report Card.
- Trias-Blanco A (2020) Quantify LiDAR’s Geometry Capturing Capability for Structural and Construction Assessment. Rutgers, The State University of New Jersey. Ph.D. Dissertation.
- Trias-Blanco A, Gong J, Moon F, (2023) Characterization of Operational Vibrations of Steel Girder Highway Bridges via LiDAR. Remote Sensing MDPI.
- Basiński W (2022) Analysis of Changes in Parameters of Free Vibration of Single and Multi-span Girders with Semi-rigid Joints. Periodica Polytechnica Civil Engineering 66(1): 269-281.
- Sousa H, Cavadas F, Henriques A, Bento J, Figueiras J, et al. (2013) Bridge deflection evaluation using strain and rotation measurements. Smart Structures and Systems.
- Wu Y, Li J (2021) Deflection measurement for bridges based on secant inclination. SCIRP.
-
Alice Kolychev, Alyssa Lafferty, Michael Padula, Justin Dworacek, Michael Liberti, Connor Ammann and Adriana Trias Blanco*. The Scholar Bridge: Influence of Support Conditions in Bridge Deflection. Mod Concept Material Sci. 6(2): 2024. MCMS. MS.ID.000631.
-
Clinic projects, Optimization, Structural analysis, Supporting diversity, Vertical structure, Geometry-capturing, Technology, CloudCompare
-

This work is licensed under a Creative Commons Attribution-NonCommercial 4.0 International License.


