


 Research article
Modeling and Simulation of Microelements, Microsystems and Technological Processes for their Production
Received Date:January 25, 2025 Published Date: February 10, 2025
Abstract
The article presents categories of models for simulation, model formation and strategies for simulating microelements and microsystems. It analyzes the effectiveness of the model and shows the study of functional microelements (FME) of micromembranes, suspended microbeams and microcombs using the “MICROSYS” system, animation of the technological process and comparison of the results with those obtained analytically. As a result of this simulation, FMEs are studied virtually and it is determined whether they will meet the requirements that are imposed on them when designing a product.
Keywords: Modeling; Simulation; Microelements; Microsystems
Introduction
The development of Micro Technik (MT) has required the unification of the processes of design, modeling, simulation and production into a single common process, divided into separate stages. The constantly increasing requirements for the capabilities of MEMS and their elements (sensitivity, selectivity...) require different alternatives for implementing automated systems for modeling, optimization through simulation, verification and testing before their production. Simulation is understood as playing out the behavior of the modeled element, component or the entire MEMS under given conditions (from the Latin verb “simulare” - imitation, substitution) [1]. Today, a number of simulators are known for most stages in the process of manufacturing microelements in the field of MT and mechatronics, the most important of which are indicated [2,3].
Technical Requirements
Validation and Verification of Simulation Models
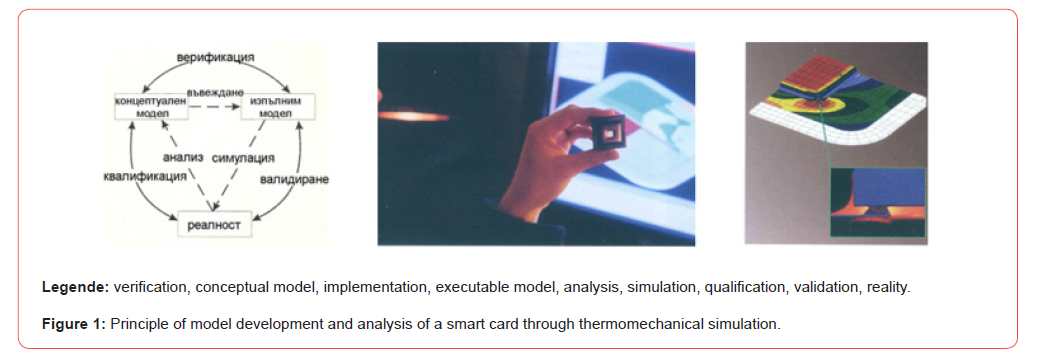
The possibility to conduct experiments in reality and compare with measurements is limited. Therefore, it is necessary to find and implement methods and in this case automated tools that are able to validate (validus - strong, influential) and verify (veritas - reality) the models. Model validation should answer the question of whether the executable model is suitable for the application area and, when put into use, can solve the tasks set. Model verification examines whether the developed, executable model reflects the conceptual one within the specified limits of accuracy. Verification is carried out by visualization and animation using simulators for describing the element or system in programming languages, which offer means for representing the model in the processing process through various codes, Petri nets and state diagrams. The advantage here is that visualization can be carried out not only by assessing the sequence of simulation, but also by presenting the results of the simulation - most often with graphs in an absolute coordinate system, as well as with time accounting, which approach is suitable for the present development. In Figure 1. the principle of preparing a model and analyzing a smart card through thermomechanical simulation is explained.
Categories of Simulation Models
The classification of models begins with the consideration of the types of parameters (continuous, discrete and combined) and the study of time [4]. Models can be static and dynamic (which take into account one, two or more random variables in time). On this basis, a division can also be made into stochastic (when they contain one random variable) and deterministic models, as well as according to their relationship to the environment – autonomous (independent) and functional (non-autonomous with input and output data), which type is used in this article [5-8].
Formation of the Models
Description of the structure or behavior of a FE (based on physical processes or the relationship between input and output data).
- Domain-independent forms of description;
Modeling, simulation, design of elements
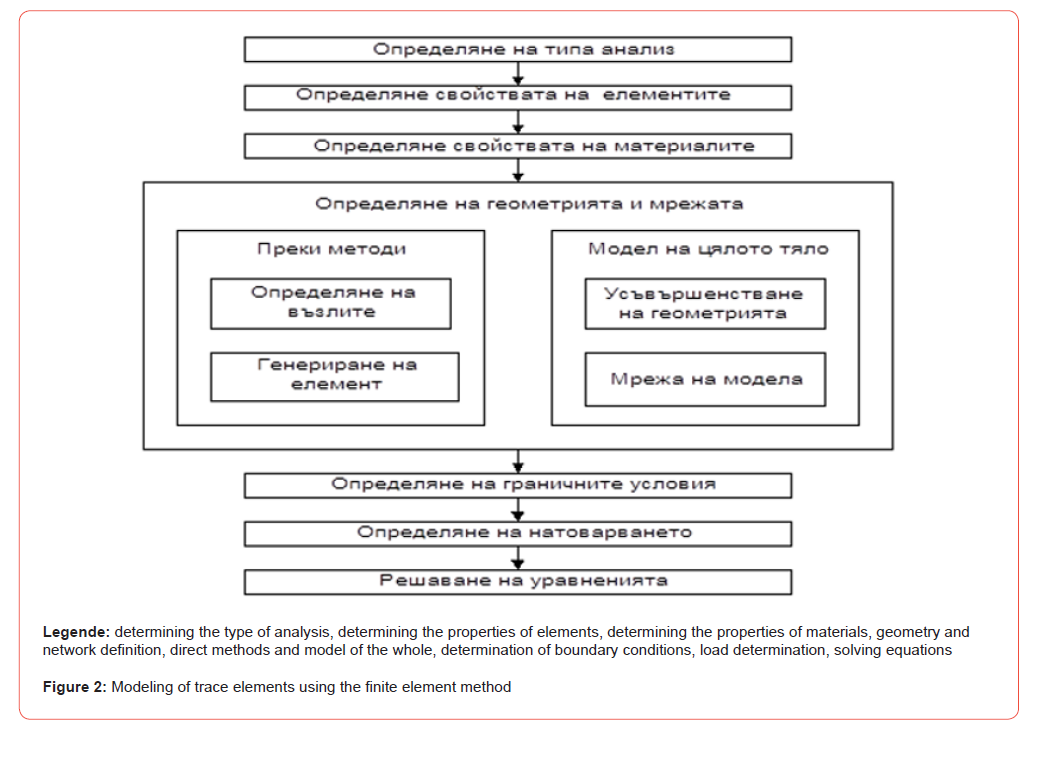
Modeling methods are discussed in detail in [26]. For the design and analysis of microelements, the commercially available FEM software packages “ANSYS and COSMOS/M” are most often used. The sequence of FEM modeling is shown in Figure 2.
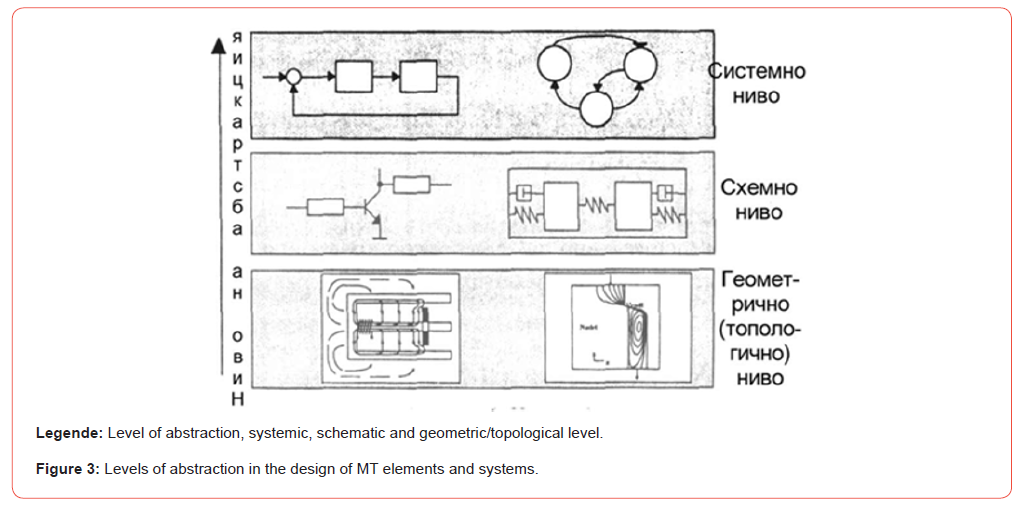
• In the design and modeling of microelements, three levels of abstraction are conditionally formed, shown in Figure 3.
- Geometry level;
- Mesh level (macromodel);
- System level.
Strategies for Simulating Elements of Microsystems
1) Network model - the individual elements are connected in a
network. Mathematically, the process is described similarly
to an electrical circuit and allows expression with differential
equation (DE). It is suitable for simpler microelements in cases
where a result with high accuracy is not required.
2) Discretization - unlike the network model, here the individual
elements are described more precisely. It uses methods for
dividing the system into separate parts, which is suitable for
the specific case (deformation simulation): finite element
method (FEM), finite difference method (FCM), finite volume
method (FVM) and boundary element method (BEM).
Modeling the FEM problem
The individual stages of modeling and simulation are:
1) Creation of the geometry of the object;
2) Connection (examples in [9]);
3) Model specification [10];
4) Determination of boundary conditions;
5) Selection of calculation algorithms;
6) Data visualization and animation.
Model Coupling in Simulation
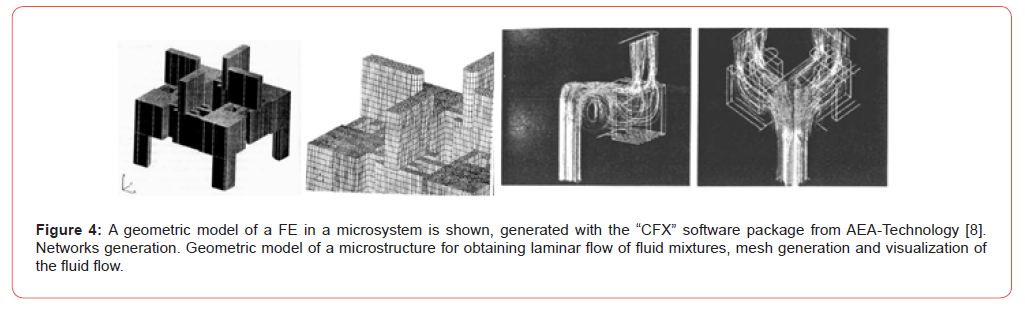
It is possible to combine the advantages of these two strategies into one, as the components of the network model can be described using discretization [8]. In order to choose an approach for effective model coupling in simulation, it is necessary to consider the model efficiency, error control and specific problems in MT.
• Adaptive discretization
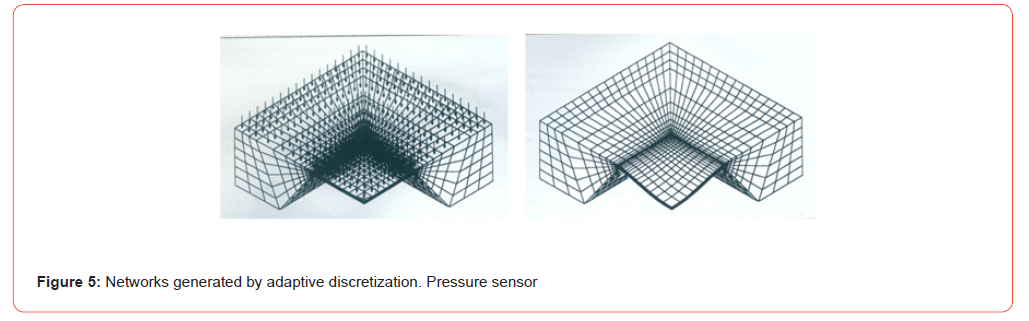
Adaptive discretization is based on dividing the geometry of the object into separate areas, which helps to avoid errors. When a break is detected in a certain region, it is filled with additional elements, i.e. the computational mesh becomes denser there. When generating the mesh, not only the size of the elements but also their shape is important. An example of a mesh generated by adaptive discretization with the ANSYS computer simulation software, load distribution and deformed mesh of a pressure sensor [8,11] is given in Figure 5:
Model Performance
• Error Estimation
• Network Refinement [12]
• Visual Inspection
• Analytical Verification
Modeling, simulation, design of microsystems (MEMS)
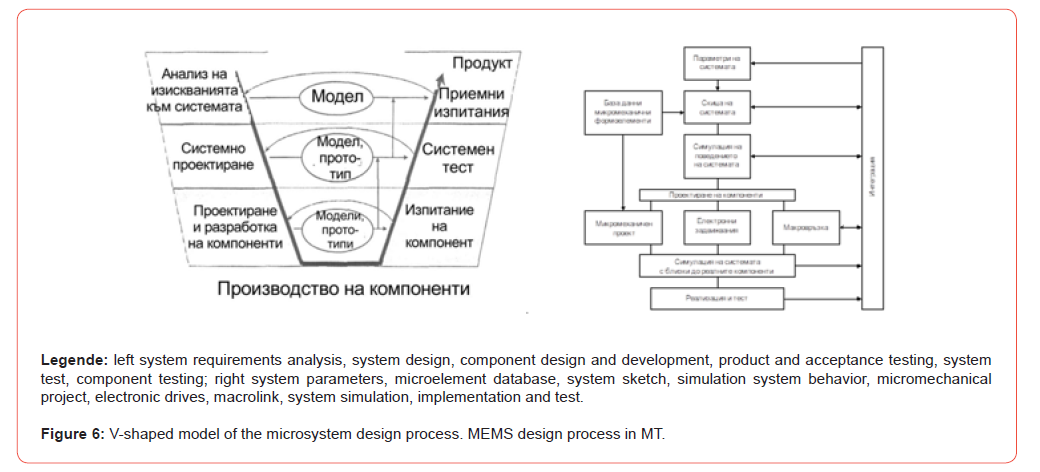
The principles of microsystem design do not differ from those for the design of any technical system. The development process of any technical system is shown in Figure 6. by the so-called V-shaped model of Gaisky and Kuhn [13]. The process of designing microsystem structures is generally characterized by a large number of feedback loops and time-consuming experiments to achieve the required properties of microelements and components. Testing should be carried out as early as possible, even before the preparation of elements and components begins, taking into account the operating modes in the technological processes. Modeling and simulation should analyze the limits of applicability of the elements in the microsystem and the accuracy of their parameters. This design concept represents a new approach and is embedded in the developed integrated system for automated design of microelements and selection of technological processes (MT) for them in MICROSYS. The sequence of the MEMS design process is shown in Figure 6. on the right [14,15].
For modeling and simulating MEMS, there are two approaches that can be distinguished [16]:
1. Modeling by abstraction or transformation of levels into a
single description of the model, which can be processed by a
single simulator;
2. Connecting multiple specialized simulators from different
physical domains [15].
To implement automated design of elements and technological processes simultaneously from MT, a combined method and algorithm for interconnected design was developed in [11], which uses known solutions (circular model) [17,18] and programming languages from practice, but also offers a new solution - a symbiosis between the constructive and technological parameters of the components with accelerated access to a set of classified connection tables.
The implementation of the method and the developed algorithm for designing through symbiosis between the constructive and technological parameters of functional microelements is carried out in the integrated automated design system “MICROSYS”, built on a modular principle [19]. In order to optimize the initial design parameters, the two main modules of the system (for construction and for technological preparation) are connected through two-way data exchange. The automated design system “MICROSYS” includes modeling - simulation before the manufacturing process in order to verify the results, functionality and behavior of the microelements. Modeling and simulation analyze the limits of applicability of the elements and the accuracy of their parameters depending on the TP for their manufacture. It is expedient to apply effective use of various visualization techniques (mainly frame-by-frame anima-tion) and commercially available PPP for modeling and simulation, which are based on structural modeling and adaptive FEM discretization. Studies have been conduc-ted and their results are compared with those obtained analytically [20]. Those for micromembranes, trapped microbeams and microridges are shown here, and the theoretical formulation is in [11].
Research of Functional Microelements by Means of the “MICROSYS” System
Research of micromembranes by means of simulation of their behavior and comparison of the results with the results obtained by analytical method
When studying the spatial, planar and quasi-planar problem for the stressed and deformed state of the models, the apparatus of the theory of elasticity is applied. Based on the equations of equilibrium and compatibility of deformations, as well as Hooke’s law for the stressed state along two axes, the differential equation of a circular membrane (I type of FME) in the region of small displacements is used:
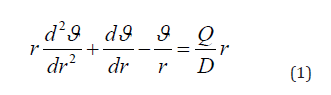
where is the angle of rotation of the normal to the mid-surface, rad; r- the current radius, m; D – the cylindrical stiffness of the plate. The differential equation for equilibrium of a thin elastic plate (II type of FE) has the form:
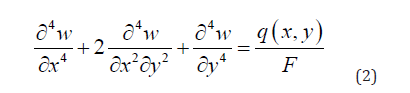
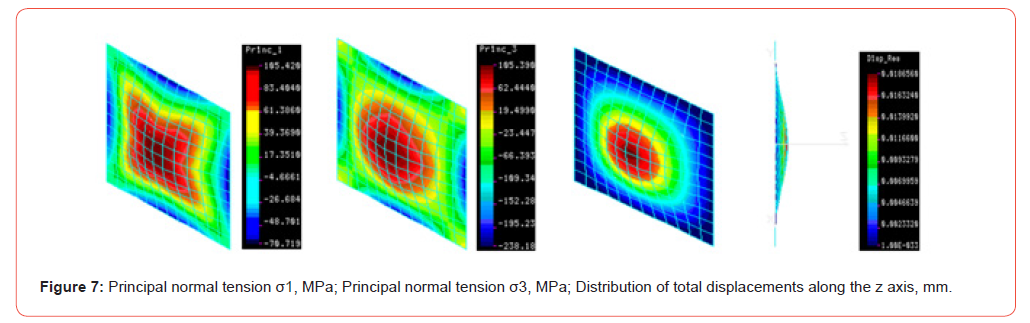
After its integration, all the main and secondary stresses and strains can be determined. The two methods for calculating flat membranes presented are applied for verification calculations after the geometric modeling of various micromembranes by FEM with shell 3 and shell 4 (Figure 7) Square (shell 4) 1 σ =105.420 MPa, σ3 =105.390 MPa, σ IVeqv=89.612 MPa, z=0186560 mm [21,22]. A study with triangular FEM is presented in [11].
To demonstrate the practical suitability of the developed module, a piezoresistive pressure sensor with a circular silicon micromembrane, fabricated by anisotropic etching on the reverse side of a silicon substrate, was designed. The dimensions of the membrane are: radius r = 2 mm; thickness b = 0.004 mm; pressure p=0.1N/mm2.
A study of various types of membranes in the sense of microtechnical elements was carried out using FEM with shell 3 and shell 4 FE [11]. The results obtained show that the equivalent stress is less than the allowable for the material. It is known from the theory that the tensile or compressive stresses (in the case of tensile) are less than 5% of the bending stresses and the resulting stresses are in the linear region. Therefore, the geometric parameters of the membranes can be accepted in practice
Computer visualization of the TP for manufacturing a micromembrane
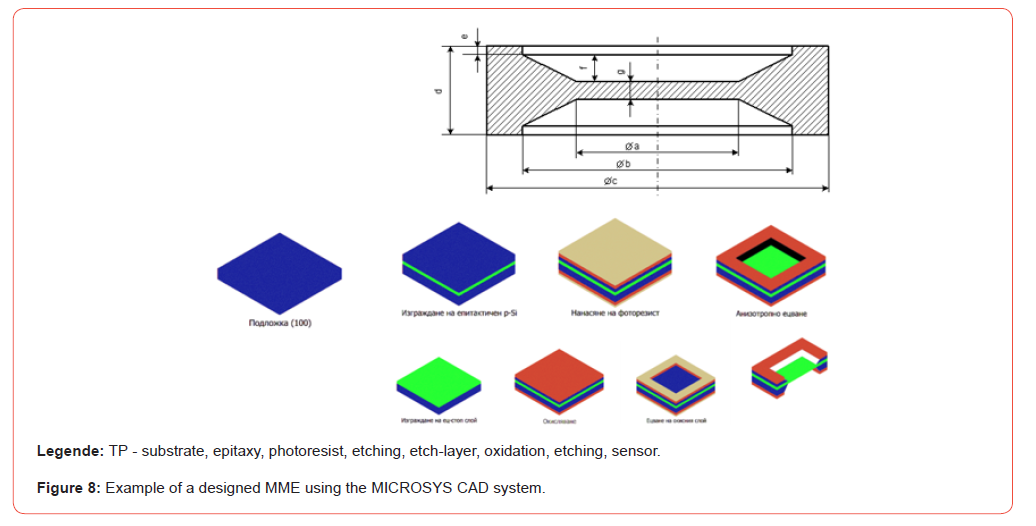
In the implementation of the TP visualization module, the second concept was chosen, namely in the form of a clip (animation) using the “Mechanical Desktop” software. The goal is to illustrate the process of analyzing and correcting the modes of technological operations before manufacturing. This type of visualization gives a clear idea of the technological process, as well as the transitions between individual operations and the functionality of the FME. The sequence of visualization of the TP for a micromembrane from a pressure sensor is:
1. Using the “Mechanical Desktop” software, a step-by-step threedimensional
model of the operation from the anisotropic liquid
etching process is created.
2. For each of the process operations, images are created using
the included Render (a program for creating raster or vector
images of three-dimensional models) in the “Mechanical
Desktop” software.
3. Joining the images into a clip using the Movie Maker
application. The visualization of the TP with anisotropic liquid
etching operation on a silicon membrane is presented in Figure
8 [23,24,26,27].
Program for calculating the parameters of the stretched microbeam
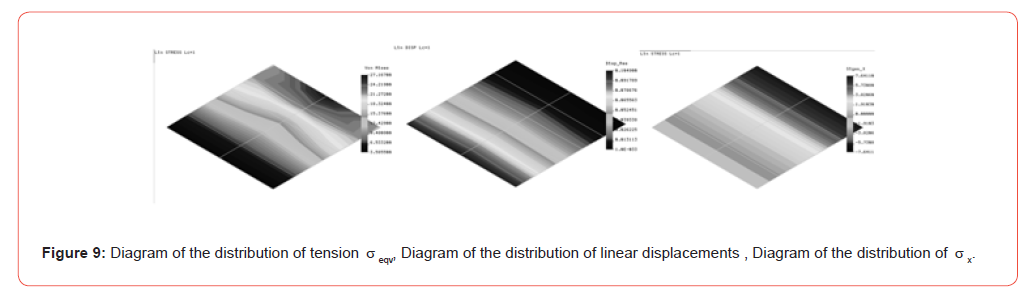
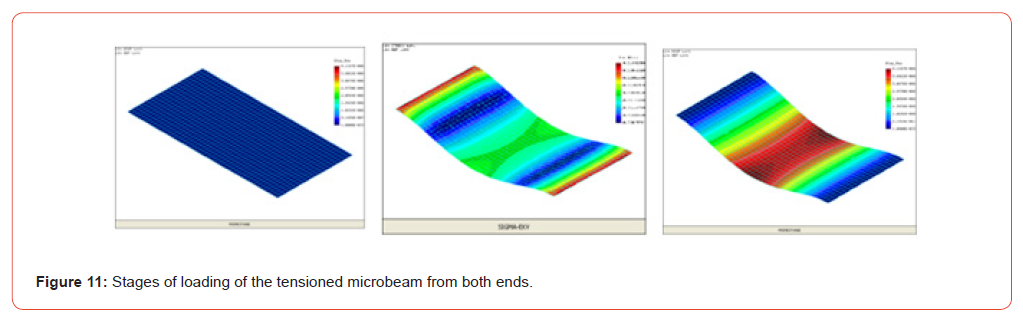
Figure 9. shows the results of the generalized algorithm for calculating the structural and technological parameters of a specific FE from microtechnology – a stretched one-sided beam made of silicon. The beam has dimensions: thickness h = 0.004 mm, length l = 2 mm and width b = 2 mm. It is loaded with a distributed load of 0.01 N/mm2. Silicon has the following physical and mechanical characteristics: modulus of elasticity E = 1.7-1.9.1011 Pa; density μ = 2.4 g/sm3; hardness – 850kg/mm2; coefficient of thermal expansion – 2.33.10-6/K; thermal conductivity – 157 WВ/ Кm, Poisson’s coef. μ = 0.23-0.262 [25]. To perform a load and deformation simulation of the tensioned beam, the COSMOS/M software package is used.
Program listing:
PLANE;
GRIDON,0,0,0.1,0.001,20,4;
SCALE;
SF4CORD,1, 0,0,0, 2,0,0, 2,0.004,0, 0,0.004,0,
VLEXTR,1,1,1,Z,2,
EGROUP,1,SOLID;
MPROP,1,EX,180E3,NUXY,0.283,ALPX,2.33E-6
M_VL,1,1,1,8,2,5,1;
NMERGE;
NCOMPRESS;
DSF,1,AU,0,1,2;
PSF,2,-0.1,2,1,-0.1,-0.1,2;
R_STATIC
ACTSTR;
STRPLOT; - The tension distribution diagram σeqv (Figure 9)
ACTDIS;
DISPLOT; – Diagram of the distribution of linear displacements
δ (Figure 9)
ACTSTR,1,SX;
STRPLOT; – Tension distribution diagram σX (Figure 9)
DEFPLOT; - Outputs a deformed finite element network (Figure
10)
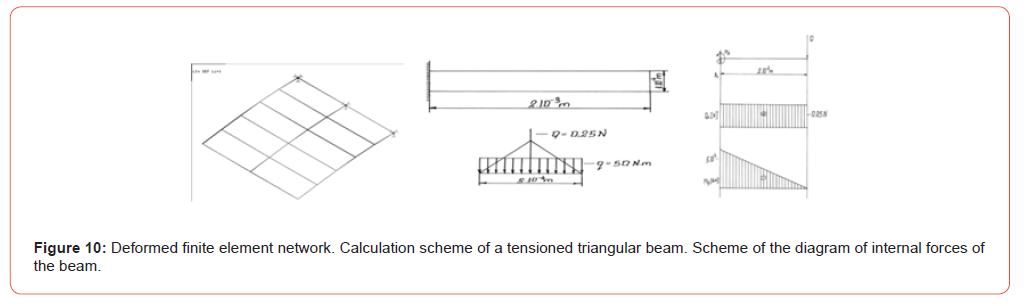
When simulating the tensioned triangular microbeam using FEM for max σX , the following result is obtained: max σX =3293.10 MPa; When theoretically calculating a triangular tensioned beam using classical methods of material resistance for max eqv σ , the following result is obtained: max σeqv = 3600.53Mpa. When determining the error between the finite element method and the theoretically calculated ones for a triangular microbeam, the following result is obtained: δ% = 8%
Microcomb study and comparison of results with those obtained analytically
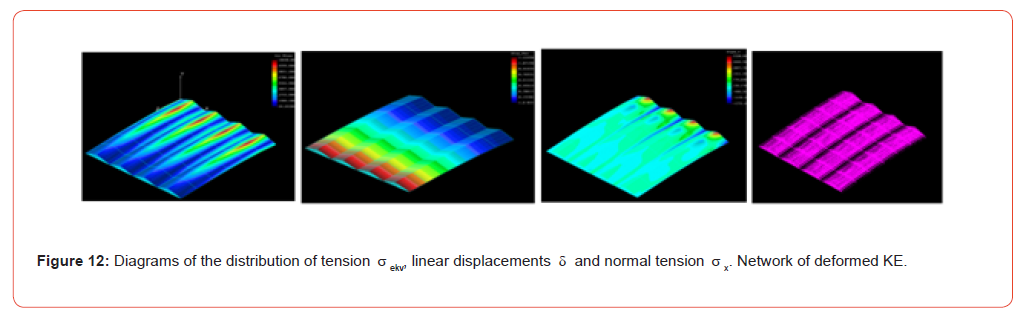
When designing a specific microelement that is used as a sensitive or executive element in MT, a simulation of its behavior is performed using the finite element method. It involves experimental studies to analyze the functionality of the microelement. In this way, the FME that will be manufactured is checked to see if it will be able to fulfill the requirements for it during operation without being manufactured. An example of the simulation of the load and deformations of a triangular microcomb using the finite element method and the theoretical calculation of the comb using the methods of material resistance is shown in Figure 12. The particular microcomb under consideration, as a MEMS FME, is loaded with a distributed load of 50 N/mm2. It is made of silicon with the following physical and mechanical characteristics: modulus of elasticity E = 1.9.1011 Pa; density μ = 2.4 kg/cm3; hardness – 850kg/mm2; coefficient of thermal expansion – 2.33.10- 6/K; thermal conductivity – 157 WВ/Km. Other types of combs – square, trapezoidal, rectangular are shown in [11].
Program listing:
C* COSMOS/M Geostar V2.50
C* Problem: TMGREBEN
PLANE,Z,0,1
SF3CORD,1,0,0,0,0.25,0.06,0,0.5,0,0
SF3CORD,2,0,0,2,0.25,0.06,2,0.5,0,2
SF3CORD,3,0.5,0,0,0.75,0.06,0,1,0,0
SF3CORD,4,0.5,0,2,0.75,0.06,2,1,0,2
SF3CORD,5,1,0,0,1.25,0.06,0,1.5,0,0
SF3CORD,6,1,0,2,1.25,0.06,2,1.5,0,2
SF3CORD,7,1.5,0,0,1.75,0.06,0,2,0,0
SF3CORD,8,1.5,0,2,1.75,0.06,2,2,0,2
VL2SF,1,1,2,1
VL2SF,2,3,4,1
VL2SF,3,5,6,1
VL2SF,4,7,8,1
EGROUP,1,SOLID,0,1,0,0,0,0,0,0
MPROP,1,EX,1.9E5
MPROP,1,NUXY,0.24
MPROP,1,ALPX,2.33E-6
M_VL,1,4,1,8,12,8,6,1,1,1
NCOMPRESS,1,3276
NMERGE,1,3276,1,0.0001,0,1,0
DSF,1,AU,0,7,2,
PSF,2,-50,8,2,-50,-50,2
C* R_STATIC
C* COSMOS/M Geostar V2.50
C* Problem: TMGREBEN
C* COSMOS/M Geostar V2.50
C* Problem: TMGREBEN
ACTSTR;
STRPLOT; - The tension distribution diagram eqv σ (Figure 12)
ACTDIS;
DISPLOT; – Diagram of the distribution of linear displacements
δ (Figure 12)
ACTSTR,1,SX;
STRPLOT; – Tension distribution diagram σX
(Figure 12.)
DEFPLOT; - Outputs a deformed finite element network (Figure
12)
Thus, functional studies of the three main types of FMEs were conducted using the simulation module and the results achieved were analyzed and compared with those obtained theoretically. The studies were published in [11,28].
Conclusion
1. Computer modeling and simulation can be applied in all
areas of microtechnology. Of course, the results obtained only
approximate the actual ones. When simulating elements of
a microsystem from solid mechanics and real measurement,
the differences between the values are within the permissible
limits – from 5 to 10%.
2. A study of various types of membranes, a beam and a comb
in the sense of elements of microtechnics was carried out
by means of FEM with shell 3 and shell 4 FE and known
dependencies from the theory of elasticity. From the obtained
results it follows that the obtained equivalent stress is less than
the permissible for the material. From the theory it is known
that the tensile or compressive stresses (in the case of tensile),
are less than 5% of the bending stresses and the obtained
stresses are in the linear region. Therefore, the geometric
parameters of the microcomponents can be accepted in
practice, which is analogous to the studied microbeam. By
simulating the behavior of the micro-combs, their functional
features have been studied. As a result of this simulation,
FMEs are studied virtually and it is determined whether they
will meet the requirements that are imposed on them when
designing a product. For the studied micro-combs with a
triangular, square, rectangular and trapezoidal shape, it turns
out that they meet the deformation condition, but do not meet
the strength condition, therefore, the load from the distributed
load must be reduced in order to achieve deformations within
micrometers. In this way, the results obtained by simulating
using the finite element method using the COSMOS M program
and the theoretically calculated ones using classical methods
of material resistance have been compared. When calculating
the error between the two methods, it is obtained within the
permissible values for engineering practice.
Acknowledgment
None.
Conflict of Interest
No conflict of interest.
References
- Brozhka I, D Delidelvov (1927) Latin - Bulgarian Dictionary, Plovdiv, Book Publishing House Hr. G. Danov p. 372
- Gerlach G, W Doetzel (1997) Grundlagen der Mikrosystemtechnik, Muenchen, Hanser.
- Pelz G (2002) Modellierung und Simulation mechatronischer Systeme, München, Infineon.
- Zeigler B (1976) Theory of Modeling and Simulation, John Wiley & Sons.
- Кartunov S, V Мarkova (2002) Mathematische Modell zur Projektierung der Komponente und technologischen Vorgänge im Rahmen des unterstütztes Systems für Mikrosystemtechnik, Мitweida р. 162.
- Petrenko A (1982) Fundamentals of design automation, Kyiv, Tekhnika.
- Fomin A, Yu Bochenkov, V Sorokopud (1981) Technology, reliability and automation of BGIS and microassemblies, Moscow, Radio and communication.
- Ehrfeld W (2002) Handbook of Microtechnology, Munich, Hanser Verlag.
- Fraunhofer Institut Programme “IZM”, MEMS Packaging, Berlin, 2005.
- Gatev K (1995) Introduction to Statistics, Sofia, LIA Publishing House.
- Kartunov S (2007) Integrated system for automated design of functional elements of microtechnology and selection of technological processes for their production, Gabrovo, Technical University of Gabrovo.
- Pongratz R (1993) EDV-Grundlagen, Vaterstten bei München, IWT Verlag.
- Gajski D, Kuhn R (1983) Guest Editors Introduction, IEEE Computer, Dezember.
- Todorov N, D Chakarski (1994) Automation of design in mechanical engineering, Sofia, Tehnika.
- Billep D, S Merunka (1995) Methoden für die Systemsimulation von MEMS, Ilmenau, 1. Ilmenauer Symposium MSТ.
- Szyperski C (1997) Component Software, Addision Wesley Longmann.
- Kartunov S, V Markova (2002) Automated design in MST. Algorithm for structural design of components, Varna, MNK Days of Mechanics, 2002, Mechanics of Machines pp. 118.
- S Kartunov, V Markova (2002) Algorithm for automated design of components and technological processes for them in MST, Gabrovo, MNK “Unitech-2002” pp. 385.
- Kartunov S, V Markova (2006) Educational and research system for automated design of components and selection of technological processes for them in microsystems technology, Sunny Beach, NK Technomat and Infotel 15(7): 309-319.
- Kartunov S, Markova V (2005) Ergebnisse von dem Forschungsprojekt „Rechnerunterstütztes System MIKROSYS fuer die Projektierung der mikromechanischen Komponenten und Auswahl von der technologischen Vorgänge von der Mikrotechnik, Chemnitz, 7. Chemnitzer Fachtagung “MST” рp. 116-119
- Kartunov S, S Simeonov, I Boschnakov (2003) Mathematische Beschreibung, Algorithmus fuer Simulation und Berechnung der Deformation von quadratische Membran nach Fenite Elemente Methode, Chemnitz, 6. Chemnitzer Fachtagung “MST” рp.143-147.
- Kartunov S, I Boschnakov (2003) Untersuchung verschiedener Arten von Membranen im Sinne einer MST-Komponente mittels FEM, Chemnitz, 6. Chemnitzer Fachtagung MST рp. 204-205.
- S Kartunov, I Boshnakov, S Stefanov (2004) Computer visualization of a technological process for a microcomponent membrane for the automated system “MICROSIS”, Plovdiv, NTS “MIU-2004” 14(15): 167.
- Kartunov S (2004) Simulating technological processes for the production of microcomponents, Ohrid, SC Manufacturing and management in 21st century, Chapter рp. 293-298.
- Kartunov S, S Stefanov (2003) Unterstuetzte Projektierung der Komponenten und technologischen Vorgänge in der Mikrosystem-technik, Ilmenau, 48. IWK, Tagungsband рp. 163-164.
- Kartunov S, I Boshnakov (2003) Methods for modeling and simulation in microtechnology – review, features, selection, application, examples and development potential MNK UNITEH, Gabrovo 1(1): 439-442.
- Kartunov S, Boschnakov I (2005) Computervisualisierung von technologischem Prozess für Mikrokomponent und Simmulation von seiner Funktionalität, Ilmenau.
- Kartunov S (2007) Investigating of micromechanical components from actuating transmission mechanism (actuators), Bukurest 2(13): 373-378.
-

This work is licensed under a Creative Commons Attribution-NonCommercial 4.0 International License.