 Research Article
Crystallization Behavior and Dielectric Response of Melt Crystallized PLLA/TiO2 Bio Nanocomposites
Evangelia E Zavvou*, Panagiota K Karahaliou, Stavroula N Georga and Christoforos A Krontiras
Department of Physics, University of Patras, Greece
Evangelia E Zavvou, Department of Physics, University of Patras, 26504, Greece.
Received Date: February 05, 2021; Published Date: February 23, 2021
Abstract
In this work, melt crystallized PLLA / TiO2 bionanocomposites, with concentration of TiO2 ranging from 1-10%wt, are produced via twinscrew extrusion melt blending. Their crystalline structure and crystallization behavior are studied by means of X-rays Diffraction (XRD) and Polarizing Optical Microscopy (POM) and their dielectric response via Broadband Dielectric Spectroscopy (BDS). XRD results suggest transformation of the α΄-crystal form of PLLA into the more stable α-form at elevated crystallization temperatures. According to POM observations all samples are fully crystallized for crystallization times of 1h. The growth size of PLLA spherulites increases linearly with time, while the growth rate is essentially independent of nanofiller content. BDS analyses reveal the presence of three relaxation processes in PLLA/TiO2 nanocomposites, at temperatures ranging from 20°C to 140°C. These mechanisms are attributed to α–relaxation of the polylactide matrix, the Maxwell–Wagner–Sillars (MWS) interfacial polarization effect and the dc conductivity effect (CR), in terms of increasing temperature. The dynamics of all three relaxation mechanisms and the fragility index of the PLLA matrix appear independent of filler loading.
Keywords: Bionanocomposites; Poly(L-)lactic acid; Titanium dioxide; Polarizing optical microscopy; Dielectric spectroscopy; Crystallization behavior
Introduction
Poly (L-lactic acid) (PLLA) is a semi-crystalline, thermoplastic aliphatic polyester of steadily increasing importance, since it is biocompatible, biodegradable, produced from renewable resources, with the potential to replace traditional petroleum-based polymeric materials. It is widely used in many applications, due to its excellent cost-property balance [1]. However, its mechanical properties, thermal stability and impact resistance are slightly inferior to conventional polymers used for thermoplastic applications. A common strategy to overcome this issue is the use of PLLA as a polymer matrix in nanocomposite systems.
Among other nanofillers, Titanium dioxide (TiO2) is considered a promising candidate to be incorporated into biopolymers, due to its excellent biocompatibility, weight to strength ratio, non-toxicity, and high chemical stability. TiO2 crystallizes in three types of crystal structures: rutile, anatase and brookite. Moreover, it is a wide band gap semiconductor with a forbitten gap of 3eV [2-4].
Depending on the crystallization conditions, the ordered phase in semicrystalline polymers can adopt different structures and morphologies, which can significantly affect their physical properties. Specifically, PLLA exhibits crystal polymorphism with four different crystal structures: namely α, β, γ and ε forms, with α-form being the most common. Of particular interest is also the metastable α΄ modification of α-form, which exhibits conformational disorder (condis-crystal), with large-amplitude of intermolecular or intramolecular mobility in comparison with the typical crystal forms [5]. This disordered α΄-form of PLLA is usually obtained at relatively low crystallization temperatures from melt (<100°C) and transforms to the stable α-form at elevated crystallization temperatures (>120°C) [6]. Therefore, studies of the crystallization behavior are of fundamental importance in PLLA-based systems since different crystallization conditions result in the alternation of their physical performance.
In this work, the crystal structure and crystallization behavior of semicrystalline PLLA/TiO2 bionanocomposites are investigated by means of XRD and POM, while BDS is employed for the study of their dielectric relaxation dynamics. Broadband Dielectric Spectroscopy is a powerful tool for the investigation of the electrical response of electrically heterogenous systems such as semicrystalline polymers and polymer nanocomposites. These structures are complex in nature since crystalline areas coexist with rigid and/ or mobile amorphous regions leading to a complicated electrical behavior [7]. This picture becomes even more complex due to the presence of the nanofiller within the polymer matrix. BDS offers the ability to distinguish between these contributions and deconvolute their complex dielectric response [8].
Materials and Methods
Poly(L-lactic acid) (PLLA) under the trade name Ingeo™ Biopolymer 3052D (Mw = 116.000 g/mol and ~4% D-lactide content) was used as matrix. Titanium dioxide (TiO2) nanopowder with 21nm primary particle size, provided by Sigma-Aldrich, was used as filler. PLLA/TiO2 nanocomposites were prepared in five different concentrations, namely 1, 3, 5, 7, 10%wt in TiO2 by melt-blending in a minilab twin-screw extruder. PLLA pellets were dried under vacuum at 98°C for 2h prior to mixing. Melt-blending took place at 170°C and the screw speed was 150rpm, for 5min total processing time. For the XRD and BDS analyses, thin films were prepared by melting a small amount of the extruded granules at 200°C for 5 min. The specimens were isothermally crystallized from melt at 120°C for 1h in a thermopress. Each melt-crystallized sample was immediately quenched into a LN2 bath. The film thicknesses ranged from 70μm to 120μm.
All specimens were analyzed in a Bruker D8 Advance X-Ray diffractometer, with Ni filtered CuKα radiation, operating at 40kV/ 40mA, and equipped with a Bruker LynxEye fast detector in the Laboratory of Mineral and Rock Research of the Department of Geology at the University of Patras, Greece. The scanning area covered the interval 10°-35° 2θ, with a scanning angle step of 0.015° 2θ and a time step of 0.6s.
For the POM experiments a Zeiss Axioskop 40 pol Polarizing Optical Microscope equipped with a Linkam LTS420 heating and freezing stage system and with a ProgRes CT5 camera, was used. Small pieces of the prepared thin films were sandwiched between two microscopy cover slips and heated to 200°C for 5 min to totally erase their thermal history in a hot stage placed under the microscope. Subsequently, samples were quenched to 120°C with a ramp of 30°C/min. The samples were kept at 120°C and the crystallization process was monitored by taking successive images of the samples, every 5min, during an 1h annealing.
BDS characterization was conducted in the frequency range from 0.1 Hz to 1 MHz using an Alpha-N Frequency Response Analyzer supplied by Novocontrol (Berlin, Germany). All samples were subjected to isothermal frequency scans between 20°C and 140°C. Temperature was controlled by the Quatro system, also supplied by Novocontrol, within ±0.2°C and the applied ac voltage was Vrms= 1.0V. Data acquisition and storage were controlled by the WinDETA software and the theoretical fitting of the received dielectric spectra was performed using the WinFit software.
Results and Discussion
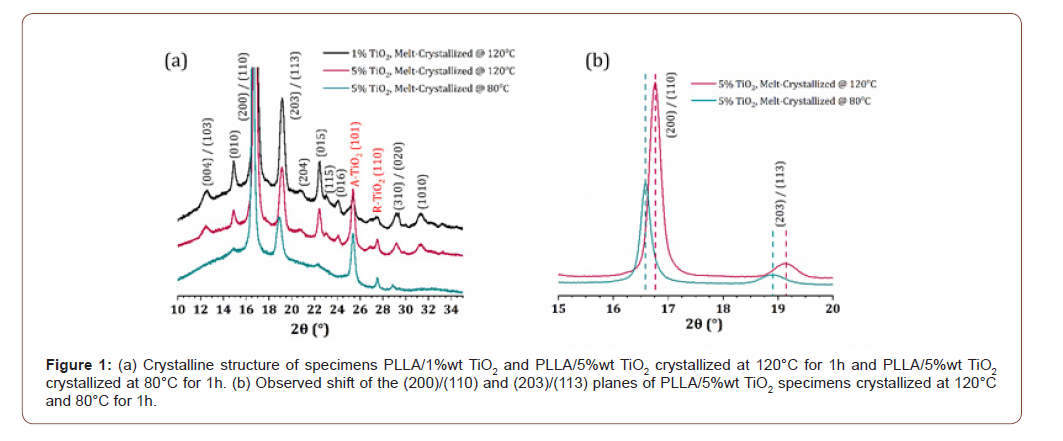
The crystalline structure of PLLA/TiO2 nanocomposites is depicted in Figure 1(a), where representative results for nanocomposites with 1%wt in TiO2 melt-crystallized at 120°C, and 5%wt in TiO2 melt-crystallized at 80°C and 120°C, are presented. The semicrystalline nature of all specimens is well justified by the amorphous halo clearly present in all XRD profiles. The presence of TiO2 is also evident. Specifically, the two clear and sharp peaks, observed at 2θ=25.4° and 27.5°, are characteristic reflections for pure TiO2. The reflection at 2θ=25.4° is assigned to the anatase phase of TiO2, while the latter one is characteristic of its rutile phase [9]. All other recorded peaks are characteristic of α and α΄ crystal forms of PLLA [6,10].
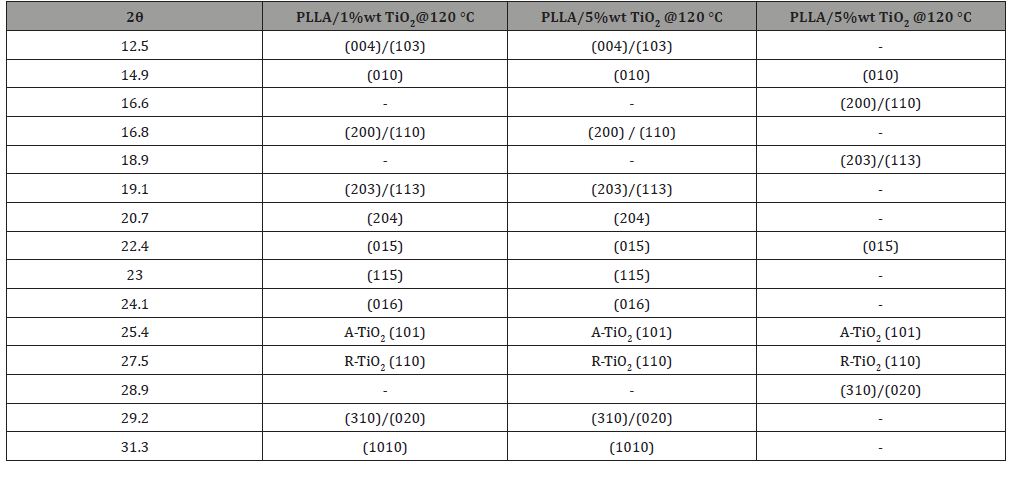
The most intense peaks, which correspond to (200)/(110) and (203)/(113) planes, along with peaks of lower intensities, corresponding to (010), (015) and (310)/(020) planes are present in all measured samples. These reflections are common in both α and α΄ crystal forms of PLLA. Nevertheless, striking differences are observed between the XRD spectra of samples crystallized at 120°C compared to those crystallized at 80°C. These differences are attributed to the gradual transformation of α΄ form to the more stable α form at higher crystallization temperatures. Specifically, it is evident (Figure 1) that the diffraction peaks, corresponding to (004)/ (103), (204), (115), (016) and (1010) planes, are present only in the spectra of the specimens crystallized at 120°C and they are absent from the spectra of the ones crystallized at 80°C. These reflection peaks are solely associated with the stable α form of PLLA thus, their absence indicates that specimens, crystallized from melt at 80°C, exhibit only the α’ phase of PLLA. Furthermore, the reflection peaks from the (200)/(110) and (203)/(113) planes are located at higher 2θ angles in the intensity profile corresponding to 120°C (Figure 1b). This shift is attributed to the gradual transformation of α΄-form to the stable α-form with increasing crystallization temperature in agreement with results reported previously [6]. All XRD diffraction peaks are summarized in Table 1.
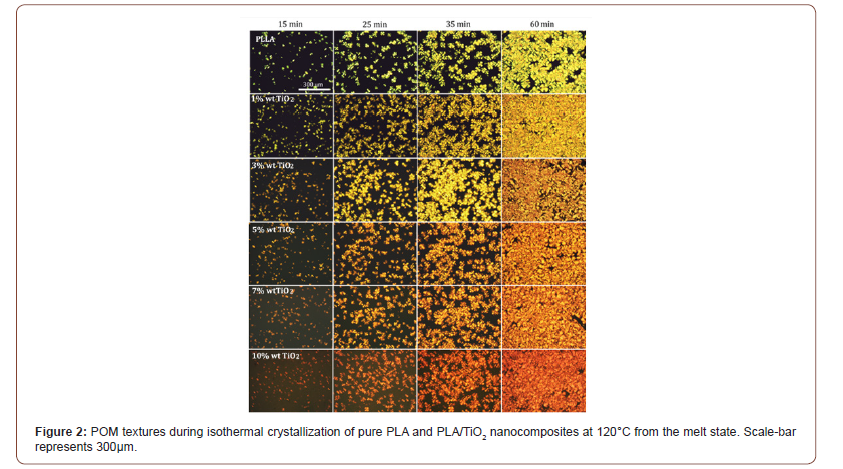
The isothermal melt-crystallization of all samples at 120°C, was optically monitored via POM. Representative textures of pure PLA and all nanocomposites are shown in Figure 2 at four distinct time lapses of the crystallization process, namely at 15, 25, 35 and 60 min.
Spherulitic textures are characteristic of melt crystallized semicrystalline polymers. In the case of poly(L-lactic) acid the morphology of the spherulitic structures varies significantly in terms of size and patterns formation, depending on the molar mass, the D-lactide content and the degree of supercooling [11]. It is evident from Figure 2, that 15 min is an adequate time for the spherulitic structure to be observed in all samples. Furthermore, at 25 min, the Maltese cross extinction pattern is well defined between crossed polarizers. Notably, a small change in the birefringence of the samples is observed at 35 min, suggesting that crystallization evolution passes through successive stages with time, till the completion of crystal growth, observed after 60 min, when the field of view is almost fully covered by interpenetrating spherulites. The influence of the addition of TiO2 on the crystallization of PLLA matrix becomes evident by comparing POM images acquired at the same time and especially at times lower than 30min. One can observe that the density of formed spherulites increases with increasing TiO2 content. This implies that the filler acts as nucleation site.
Table 1: 2θ positions and diffraction planes of PLLA/TiO2 nanocomposites.
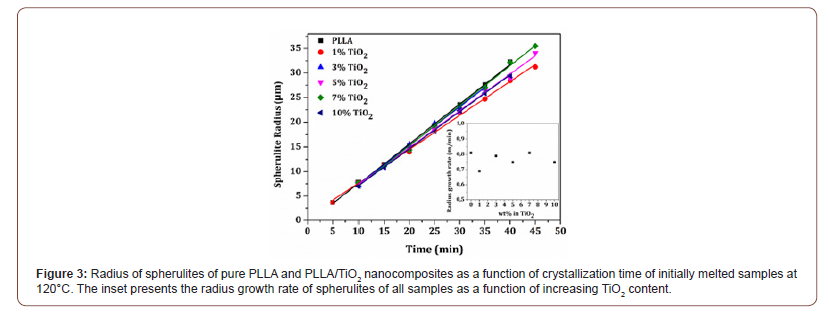
rationalize POM results, the mean radius of the spherulites of all samples was evaluated and plotted in Figure 3 as a function of crystallization time. All specimens exhibit linear dependence of the spherulite radius versus crystallization time. Evidently, at low crystallization times, the mean size of the spherulites is almost filler concentration independent. Consequently, a higher number of equally sized spherulites is formed with increasing filler content. Thus, the inclusion of TiO2 accelerates the crystallization process. The radius growth rate of the spherulites of each sample was extracted from the slope of the fitted curves and is presented in the inset of Figure 3 as a function of TiO2 concentration. There is no particular trend of the size growth rate as a function of filler concentration.
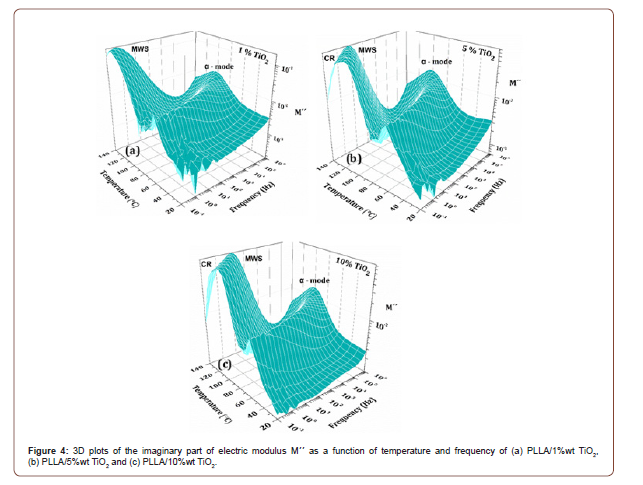
The dielectric response of all prepared nanocomposites, at relatively elevated temperatures (20°C-140°C) was investigated by means of BDS. Representative results of the imaginary part of the electric modulus Μ΄΄ [4], for PLLA/TiO2 nanocomposites, with 1, 5, 10%wt in TiO2, are presented as a function of frequency and temperature in the 3D plots of Figure 4a-c. Electrical relaxation phenomena, in nanocomposites, include contributions arising from the biopolymer matrix as well as the nanofiller. It is well known that the expected dielectric response arises mainly from the following mechanisms: Glass to rubber transition of the polymer matrix (α-relaxation), relaxations due to reorientations and segmental motions of parts of the polymer chain (γ and β modes, usually recorded at low temperatures, not shown here) and finally, from interfacial phenomena associated with the presence of the filler and the various interfaces within the nanocomposite [8]. In the present work the recorded dielectric data are presented in terms of the imaginary part of the electric modulus, M΄΄, since this formalism excludes electrode polarization and space charge injection phenomena, allowing the clear representation of the interfacial polarization effects present in the dielectric spectra of the nanocomposites [12].
Three relaxation mechanisms are present in all spectra. In terms of increasing temperature (60°C to 90°C), the first relaxation present, is the α-mode related to the glass to rubber transition of the amorphous phase of polylactide. The position of the peaks shifts steadily to higher frequencies with increasing temperature while the magnitude and shape of the peaks remain rather unaffected. In the high temperature (110°C to 140°C) and low frequency region, the next two relaxation mechanisms are present. The first one, observed as a clear peak, is attributed to MWS effect related to interfacial polarization phenomena. It has already been mentioned that PLLA is a semicrystalline biopolymer. Since all specimens are melt-crystallized at 120°C for 1h, it is evident that within the polymer matrix, crystalline areas are already formed, and they are surrounded by rigid amorphous regions of PLLA. Furthermore, amongst these areas, mobile amorphous regions of PLLA are also present [1]. Consequently, the TiO2 nanofiller is dispersed within regions with different electrical characteristics. Thus, interfaces between crystalline-rigid amorphous regions, rigid amorphous-mobile amorphous regions, and interfaces between TiO2 nanofiller and the biopolymer matrix are present, resulting in enhanced interface polarization phenomena and consequently, the appearance of the MWS effect. The third relaxation mechanism is attributed to the electrical conductivity of the specimens. This mechanism is related to the fact that with increasing temperature, electrical charges within the specimens, able to overcome local potential barriers, move with short range jumps within the polymer matrix. This mechanism evolves as a “hump” in all recorded spectra in the high temperature and low frequency region (Figure 4a-c).
The temperature dependence of the relaxation frequencies of all recorded mechanisms are depicted in Figure 5. MWS effect follows an Arrhenius type behavior according to the equation [13]:

where fo is a pre-exponential factor, Eg the activation energy, T the temperature and kΒ the Boltzmann constant. On the other hand, α-relaxation follows a Vogel-Tammann-Fulcher temperature dependence, described by [13],

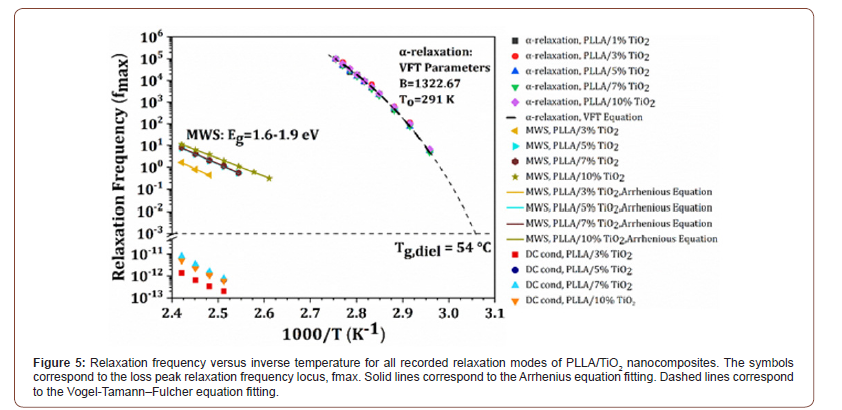
where, fo is a pre-exponential factor, D=B/T0 is the strength parameter, T the temperature in Kelvin and T0 the Vogel temperature or the ideal glass transition temperature. Strength parameter D is related to the fragility index of the glass forming matrix, through the equation m=16+(590/D) [14].
Fitting the experimental data of α-mode to the VTF equation, the fo, D and T0 parameters are calculated for each PLLA/TiO2 nanocomposite. The fitting parameters are included in Figure 5. In addition, the dielectric glass to rubber transition temperature Tg, diel is also calculated from the VFT plot of α-mode data. Tg, diel is the temperature at which the α-relaxation maximum fmax equals to 1.6x10⁻³ Hz, or to τmax=100s [15]. The evaluated, in the present work, Tg, diel equals to 54.0°C, in fair agreement with the Tg, DSC=60.0oC, recorded in the DSC spectra of the specimens (not presented here). Finally, the fragility index is evaluated to be m=146 indicating a “fragile” glass forming system. This value of m is in very good agreement with previously published results of PLLA based amorphous or semicrystalline systems. The calculated fragility index seems unaffected by the nanofiller concentration [16,17]. Finally, no fitting to the experimental data was performed for the electrical conductivity term, since the number of data points is limited, rendering the fitting procedure uncertain.
Conclusion
The effect of TiO2 nano inclusion on the crystal structure, crystallization behavior and dielectric response of polylactic acid bio polymer is monitored and evaluated by means of complementary experimental techniques. PLLA/TiO2 nanocomposites are prepared and isothermally crystalized from the melt at 120°C for 1h. The XRD results suggest that the crystal structure is not affected by the concentration of the filler. On the other hand, the crystallization temperature strongly affects the crystal structure formation of the polylactide matrix. Specifically, it is observed that the formation of α′ form of PLLA is preferable over that of α form in samples crystallized at 80°C, while at 120°C, the α΄-form of PLLA is fully transformed to the more-stable α-form. POM observations reveal that TiO2 nanofillers act as nucleation sites and their presence enhances the crystallization process of the polylactide matrix. Furthermore, the mean size of the observed spherulites, as well as their growth rate are not affected by the concentration of TiO2. The BDS analysis reveals the existence of three relaxation mechanisms in all studied specimens. The activation energies, VFT parameters as well as the fragility index of the nanocomposites are evaluated through the analysis of the relaxation dynamics.
Acknowledgement
Many thanks are due to Associate Professor I. Iliopoulos (Department of Geology, University of Patras, Greece) for XRD measurements. The authors wish also to express their thanks to Assistant Professor A. Giannakas (Department of Business Administration of Food and Agricultural Enterprises, University of Patras, Greece) for the use of the twin screw extruder.
Conflict of Interest
The authors declare that they have no conflicts of interest.
References
- Di Lorenzo ML, Androsch R (2018) Synthesis, structure and properties of poly(lactic acid), in Advances in Polymer Science. Vol 279, Springer, Cham, Switzerland.
- Kaseem M, Hamad K, Ur Rehman Z (2019) Review of Recent Advances in Polylactic Acid/TiO2 Materials 12(22): 3659.
- Tomara GN, Kerasidou AP, Patsidis AC, Karahaliou PK, Psarras GC, et al. (2015) Dielectric response and energy storage efficiency of low content TiO2-polymer matrix nanocomposites. Composites Part A: Applied Science and Manufacturing 71: 204-211.
- Kontos GA, Soulintzis AL, Karahaliou PK, Psarras GC, Georga SN, et al. (2007) Electrical relaxation dynamics in TiO2 - polymer matrix composites. eXPRESS Polymer Letters 1(12): 781-789.
- Cocca M, Androsch R, Righetti MC, Malinconico M, Di Lorenzo ML (2014) Conformationally disordered crystals and their influence on material properties: The cases of isotactic polypropylene, isotactic poly(1-butene), and poly(l-lactic acid). Journal of Molecular Structure 1078: 114-132.
- Li J, Xiao P, Li H, Zhang Y, Xue F, et al. (2015) Crystalline structures and crystallization behaviors of poly(L-lactide) in poly(L-lactide)/graphene nanosheet composites. Polym Chem 6(21): 3988-4002.
- Wunderlich B, Grebowicz J (1984) Thermotropic mesophases and mesophase transitions of linear, flexible macromolecules. In: Platé N.A. (eds) Liquid Crystal Polymers II/III. Advances in Polymer Science, vol 60/61. Springer, Berlin, Heidelberg.
- Karahaliou PK, Kerasidou AP, Georga SN, Psarras GC, Krontiras CA, et al. (2014) Dielectric relaxations in polyoxymethylene and in related nanocomposites: Identification and molecular dynamics. Polymer 55(26): 6819-6826.
- Silva SS, Magalhães F, Sansiviero M (2010) ZnO/TiO2 semiconductor nanocomposites. Photocatalytic tests. Quim Nova 33(1): 85-89.
- Pan P, Kai W, Zhu Bo, Dong T, Inoue Y (2007) Polymorphous Crystallization and Multiple Melting Behavior of Poly(L-lactide): Molecular Weight Dependence. Macromolecules 40(19): 6898-6905.
- Di Lorenzo ML, Androsch R (2019) Influence of α′‐/α‐crystal polymorphism on properties of poly(l‐lactic acid). Polym Int 68(3): 320-334.
- Psarras GC, Siengchin S, Karahaliou PK, Georga SN, Krontiras CA, et al. (2011) Dielectric relaxation phenomena and dynamics in polyoxymethylene/polyurethane/alumina hybrid nanocomposites. Polym Int 60(12): 1715-1721.
- Kalini A, Gatos KG, Karahaliou PK, Georga SN, Krontiras CA, et al. (2010) Probing the Dielectric Response of Polyurethane/Alumina Nanocomposites. Journal of Polymer Science: Part B: Polymer Physics 48(22): 2346-2354.
- Böhmer R, Ngai KL, Angell CA, Plazek DJ (1993) Nonexponential relaxations in strong and fragile glass formers. J Chem Phys 99(5): 4201.
- Menczel JD, Prime BR (2008) Thermal Analysis of Polymers: Fundamentals and Applications, John Wiley & Sons, Inc, Hoboken, New Jersey, United States.
- Arnoult M, Dargent E, Mano JF (2007) Mobile amorphous phase fragility in semi-crystalline polymers: Comparison of PET and PLLA. Polymer 48(4): 1012-1019.
- Varol N, Monnier X, Delbreilh L, Saiter A, Fatyeyeva K, et al. (2020) Highlight of primary and secondary relaxations in amorphous stereocomplex polylactides. eXPRESS Polymer Letters 14(1): 48-62.
-
Evangelia E Zavvou, Panagiota K Karahaliou, Stavroula N Georga, Christoforos A Krontiras. Crystallization Behavior and Dielectric Response of Melt Crystallized PLLA/TiO2 Bio Nanocomposites. Mod Concept Material Sci. 3(5): 2021. MCMS. MS.ID.000572.
-
Bionanocomposites, Poly(L-)lactic acid, Titanium dioxide, Polarizing optical microscopy, Dielectric spectroscopy, Crystallization behavior, Dielectric response, Crystallization temperature, Crystal structure
-

This work is licensed under a Creative Commons Attribution-NonCommercial 4.0 International License.


