 Research Article
Technological and Social Impact on Hong Kong’s Young Consumers’ Online Shopping Behavior for Fashion and Casual Apparel: A Statistical Analysis
Man Sum Wong1, Ritwik Chakraborty1, Ka Man Mok, Ka Man Tang and Manas Kumar Sarkar2*
School of Fashion and Textiles, The Hong Kong Polythetic University
1Both these authors contributed equally;
Manas Kumar Sarkar, School of Fashion and Textiles, The Hong Kong Polythetic University, Hong Kong.
Received Date:June 07, 2024; Published Date:June 26, 2024
Abstract
The increasing use of innovative mobile technology and cheaper data has increased online shopping, including fashion and textile products. As a result, sellers are moving towards online platforms along with traditional selling and deploying new technologies to attract buyers. This study aimed to examine the impact of online shopping on Hong Kong consumers and how technology, society, and store qualities have influenced their purchases.
The survey of 550 young people in Hong Kong found that over 80% of respondents buy apparel products from online stores along with conventional ones. The majority of respondents prefer online shopping if virtual try-on technologies are more prevalent. Results show that price is the utmost deciding factor for product selection, discounts and convenience attract consumers to online shopping.
Purpose: Hong Kong consumers are increasingly shopping online, and sellers are using advanced technologies to attract young buyers. This research delves into the shopping habits of young Hong Kong consumers, looking closely at their preferences, item selection, and the various factors that influence their shopping modes. Key areas of investigation include the impact of technology, situational influence, and store behaviour.
Design/Methodology/Approach: The present investigation is based on an online survey conducted on 550 young people (between 18 and 30 years of age) living in Hong Kong.
Findings: According to the research findings, over 80% of respondents are used to buying apparel products from online stores. Statistical analysis revealed that price is the utmost deciding factor in product selection, and these young buyers avoid casual clothes beyond HKD 600. Online discounts and app convenience are the key drivers of online purchases. Most respondents expressed a desire to use trying-on technology while shopping for apparel online.
Originality/Value: This research focuses on identifying the key factors that influence young consumers in Hong Kong when making purchasing decisions and selecting shopping modes. The insights gained from this research could provide invaluable guidance to online retailers seeking to expand their market reach.
Keywords: E-commerce; Online shopping; Fashion retailing; Consumer preference; Try-on Technology
Introduction
Retail stores have been a staple of face-to-face sales for centuries. However, with the advent of the internet, human behaviour has undergone a paradigm shift, particularly in the way goods are procured. Online shopping, or the practice of purchasing goods from online stores using a computer or mobile device, has become increasingly popular since its inception in the early 1990s. Payments can be made through various online payment modes or physical payment methods such as cash-on-delivery. This shift in shopping behaviour has gained significant traction among younger generations and continues to grow in popularity [1].
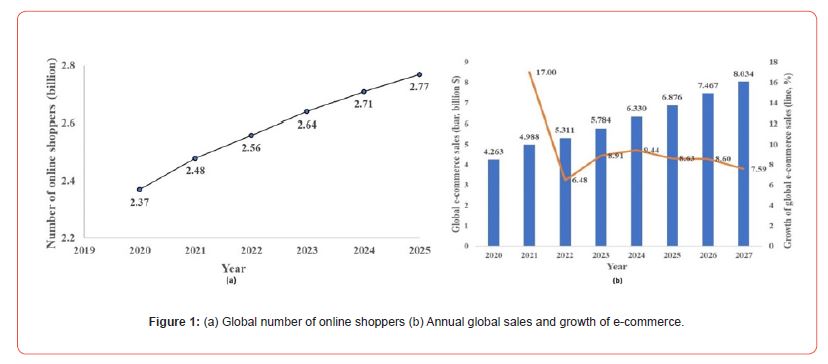
With easy access to the internet and the enhancement of internet speed in recent times, internet users around the globe increased many folds, thus generating an increased number of online shoppers in recent years. The data in Figure 1(a) and (b) shows that the number of online shoppers around the globe has increased from 2.37 billion in 2020 to 2.64 billion in 2023 and is projected to be at 2.77 billion in 2025 [2], while the online e-commerce sales have ballooned from $4.263 billion in 2020 to $5.784 billion in 2023 and is projected to reach at $8.034 billion in 2027 [3]. This meteoric pace of outgrowth in e-commerce sales is partly driven by the long period of lockdowns and containment during the COVID pandemic during 2020-21 as well as the steep growth of smart mobile telephones usage with cheap internet data. Hong Kong also reciprocates a similar global trend where the number of online shoppers has jumped from 2.72 million in 2019 (pre-COVID) to 4.63 million in 2023 (post-COVID) and is projected to grow to 6.83 million in 2028 [4]. The young generations of Hong Kong are fashion-conscious and eager to adopt new technologies for better lifestyles [5]. Additionally, with its pre-eminence as a global financial centre and high per capita disposable income, Hong Kong’s superb logistics infrastructure (globally 4th position in 2023 as per World Bank data) has facilitated the sales of goods here [6].
With the increase in the number of shoppers and competition, retailers are trying to diversify their product range as well as marketing techniques to reach more clients. This trend of online shopping provides an opportunity for fashion retailers to distribute products in distinct sales channels. Online shoppers’ buying preferences vary according to their locations and income strength, but apparel and fashion items are always positioned as a top choice for online buyers. The rise of e-commerce platforms actively helps brands enhance their sales of various casual-wear products via online platforms along with their existing offline ones. Compared with physical stores, online stores can provide better flexibility in terms of search convenience, the appearance of different products, and comparisons between various offers [7]. In addition, online sale channels provide more information and choices for consumers to better compare different products and their prices. Simultaneously, various virtual technologies have been effectively developed and deployed on e-commerce platforms to further facilitate online buyers to decide the suitability of the garment for them without wearing it [8].
According to Katawetawaraks and Wang [9], consumers’ online shopping is driven by the convenience of buying the product, information available, available product varieties and services (easy return and refund), cost efficiency of the product, and time efficiency to purchase (i.e. quick delivery). In addition, consumers’ motivations play a significant role in online shopping. Consumers can be motivated to make online purchases if they can touch the product virtually, try on casual wear to increase their purchasing confidence and get the product quickly after payment to encourage them to complete the purchase. The dramatic rise in the adaptation of e-commerce platforms and stiff competition of different brands quickened the adoption of digital presentation technologies in apparel businesses [10,11]. Among various digital presentation technologies, augmented reality (AR) is a leading type, providing real-time interactive elements such as video and textual content by superimposing virtual images on the user’s real-world environment [8,12]. Unlike conventional web-based product presentations (i.e. picture and text information), which often fail to gain the shopper’s attention, an AR-based “virtual try-on” technology is quickly adopted by the fashion industry because it provides rich sensory modalities (e.g. sight and touch) by overlaying the product’s image on the consumer’s own reflection [13], thus inspire the customer to purchase without trying-on. The AR market is expected to grow from $15.3bn in 2021 to $77bn by 2025 [14], and several leading fashion brands have adopted AR technologies to enhance online shopping experiences. For example, Gucci launched an AR-based virtual try-on campaign that lets consumers try different pairs of virtual shoes using AR lenses [14].
The present work explores the change in consumers’ purchase process of casual wear. The buying process by customers was further analyzed to better understand the effects of the change in the purchase trends of different casual fashion products. Also, this work examines how online retailing and e-commerce platforms make retail buying easier compared to the traditional buying process. All collected data were statistically analyzed to understand the reliability of the data and its real impact on online buying.
Method
Data collection
Table 1: Sample demographics.
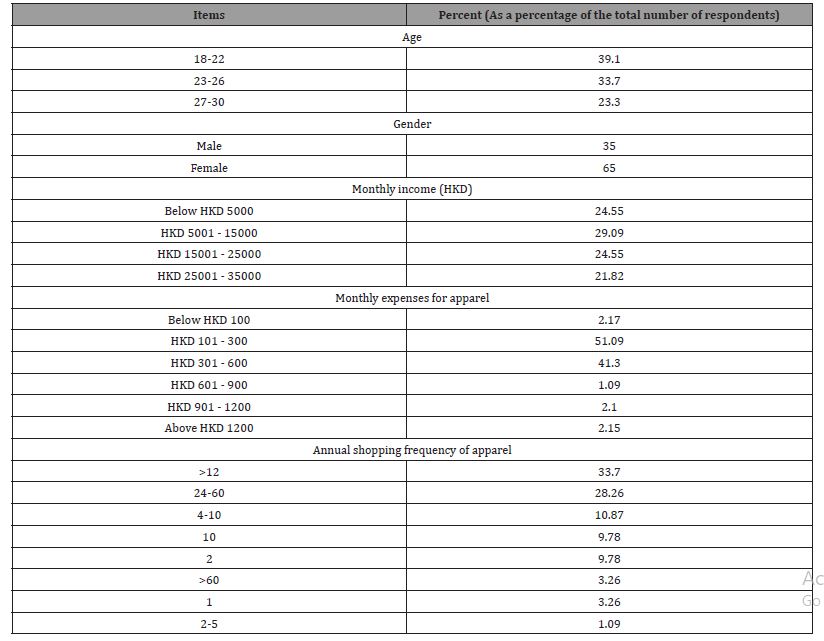
A purposive sampling was applied, and an online survey was developed to collect data from 550 youths aged 18 to 30 years living in Hong Kong. The survey was conducted in this age group (fall under Generation Y and Z) as these people mostly go for online purchases [15]. Approximately, a month was spent collecting the expected number of responses. Demographically, respondents were of various age groups: 39.1% of total respondents were aged 18–22 years, 33.7% were within 23–26 years, and the rest, 27.3%, fell in the age group of 27-30 years. Regarding monthly income, the sample comprised less than HK$5000 (24.55% of total respondents), HK$5,000–15,000 (29.09%), and HK$15,001–25,000 (24.55%), and HK$25,001–35,000 (21.82%). Monthly expenditures for purchasing clothing were up to HK$100 for 2.17%, HK$101- 300 for 51.09%, HK$ 301-600 for 41.3%, HK$601-900 for 1.09%, HK$901-1200 for 2.1%, and above HK$1200 for 2.15% of the total respondents. All the demographic information of the respondents is shown in Table 1.
Measures
Multi-item scales were developed to measure all independent variables. All items were measured utilizing a five-point Likert scale (1 = “strongly disagree” to 5 = “strongly agree”). In addition to the Likert questionnaires, several other questions were put up to the respondents. The questions were prepared following the purchasing behavior of consumers as conducted in several discreet articles previously [16,17]. The questionnaire is attached as a supplementary file. Quantitative assessment and Response Surface Methods by Box-Behnken Design were employed for the analysis of data using SPSS 26.0 and Minitab 21.
Results & Discussion
Preference for online shopping
Out of the 550 individuals surveyed, a whopping 83.6% (460 respondents) have unequivocally embraced the convenience of online shopping, indicating a remarkable shift in consumer behavior. When it comes to the shopping preferences of those surveyed, it is crystal clear that 55.4% of respondents unequivocally prefer e-commerce sites, while a mere 30.9% opt for physical stores. Only a paltry 13.6% of respondents were undecided about their shopping preferences.
In order to explore the benefits of online shopping and various factors that influence their decision, participants were asked to indicate their reasons for choosing to shop online and identify the key factors that influence people’s decisions to shop online. Additionally, we looked into reasons why some shoppers do not prefer online shopping by surveying various purchasers. Obtained results are presented in Figure 2(a), (b) and (c). This survey allows participants to choose multiple options, providing a comprehensive understanding of all participants’ opinions, and resulting in a clear and accurate picture.
The most common reasons for online shopping (see Figure 2(a)) are convenience, a wider selection of products, easy search for target products, convenience of access and more product inventory, size, or style, attractive displays, and more discounts. Other reasons include more payment options, 24/7 operation, direct or drop delivery services, and access to product information. Few also mentioned the return policy, pre-order service, avoidance of crowded shopping places (especially during this COVID situation) and availability of certain styles only online. A negligible number of respondents adopted online shopping due to limited purchase channels and product reviews.
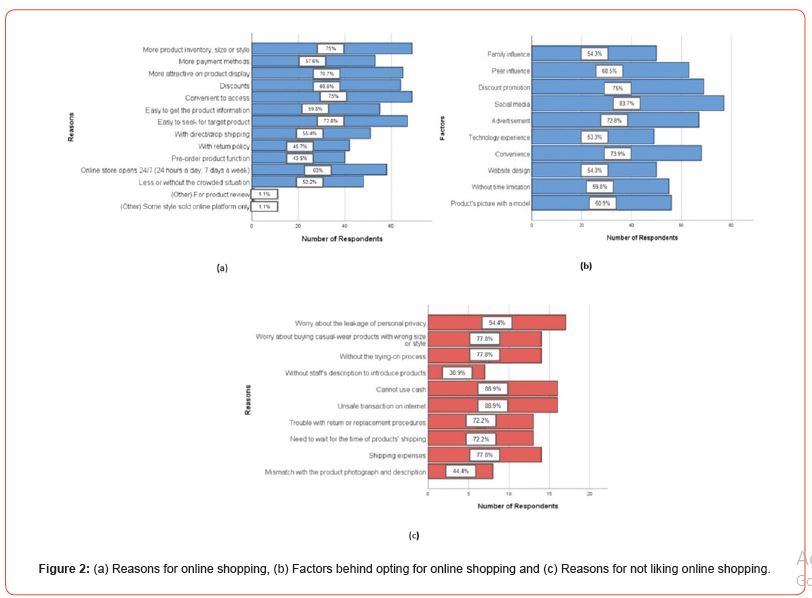
According to our research (see Figure 2(b)), social media is the most important factor for 83.7% of online shoppers when choosing an online platform to buy from. Other influencing factors include peer influence, discount promotions, advertisements, and convenience, with 68.5%, 75%, 72.8%, and 73.9%, respectively. Fewer respondents chose family influence, technological experience, website design, no time constraint, and product picture with a model as factors, with 54.3%, 53.3%, 54.3%, 59.8%, and 60.9%, respectively.
In addition to that, when asked to choose between an online store with advanced try-on technology and a physical one, 80% of respondents preferred the online version against the traditional one. This suggests that young people, who are accustomed to technology, want to use virtual reality to assess items without touching them, a similar observation was noticed in earlier research [18,19].
Some respondents have reported feeling discouraged from purchasing items online after their first experience, Figure 2(c) provides a comprehensive understanding of the reasons behind this. Most online shoppers are worried about personal data leakage. Other reasons include the inability to use cash, safety concerns, sizing issues, and inability to try on and return procedures. Few shoppers dislike online shopping due to a lack of staff assistance or product mismatch with displayed photographs.
We have gathered valuable insights on the types of garments that are frequently purchased through online stores, as well as a comprehensive list of the most preferred online platforms among respondents. The results obtained have been comprehensively presented in Figures 3 (a) and (b).
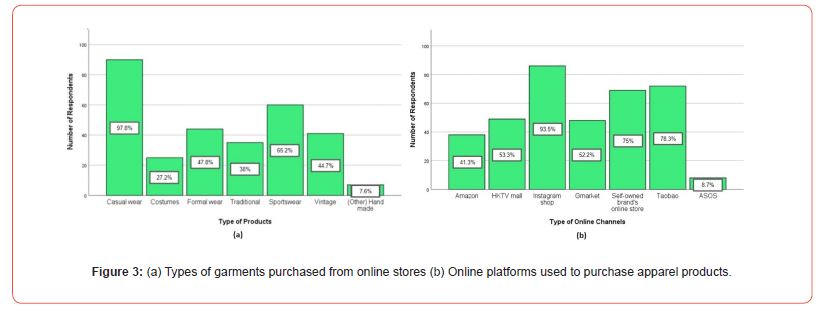
According to the survey (see Figure 3(a)), casual wear is the most popular apparel product, bought by 97.8% of respondents. Sportswear comes in second, with 65.2% of respondents purchasing it online. Formal wear and vintage garments are purchased by around 43.5% of respondents. The percentage of customers who prefer to purchase traditional and costume products from online stores is relatively low, at 27.2% and 38% respectively. Hand-made garments have relatively fewer buyers. Respondents were allowed to give multiple choices, so the percentages do not sum up to 100%.
As per the survey results (refer to Figure 3(b)), respondents used various e-commerce channels to purchase casual-wear items. Instagram shop was found to be the most popular channel, with 93.5% of respondents recommending it. Taobao and different self-owned brands are also popular, with 78.3% and 70% of respondents opting for them, respectively. Other popular channels included HKTV mall, Gmarket, and Amazon. Asos was found to be the least popular, selected by only 8.7% of the respondents.
Respondents were surveyed regarding their views on online shopping as a substitute for physical store shopping. While 43.6% of respondents expressed confidence in online stores as a viable substitute for physical stores, the majority (46.4%) remained neutral in their stance, according to the study. Additionally, a minority (10%) believed that online shopping could only partially replace the physical store experience.
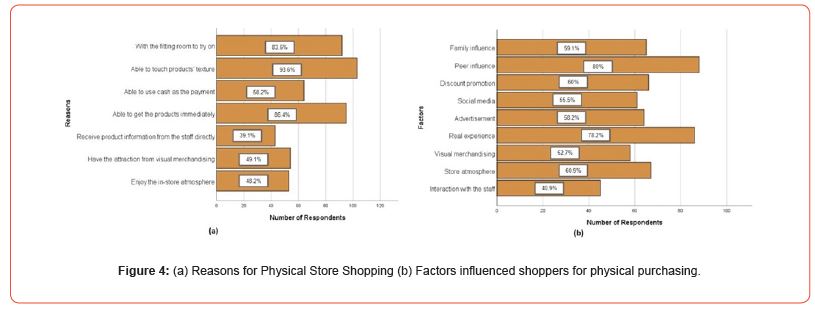
Physical shopping has its advantages, respondents’ opinion was gathered on the benefits of physical shopping and what factors influence their decision to shop in-store. The data on the matter is presented in Figures 4 (a) and (b). People prefer buying from physical stores over online platforms for three major reasons: they can touch and feel the products, get them immediately, and use trial rooms. Other reasons include paying with cash, being attracted to visual merchandising, enjoying the in-store atmosphere, and receiving product information from staff.
Figure 4(b) delineates various factors that influence consumers to shop at physical stores. The survey found that 80% of shoppers are influenced by peers and 78.2% prefer physical stores for the real experience where they can touch the product. Other factors include family influence, discounts, social media, and store atmosphere. Only 52.7% of respondents are influenced by visual merchandising while 40.9% said that they shop at physical stores because of the interaction with staff.
From the questionnaire, it has been noticed that there is a promising opportunity for a change in consumer behaviour toward online shopping if the obstacles are eliminated. Over 61% of participants expressed a willingness to engage in digital commerce, while only 17% showed no interest in online purchasing. The remaining 22% acknowledged the possibility of exploring online shopping in the future.
Influence of brand and higher price
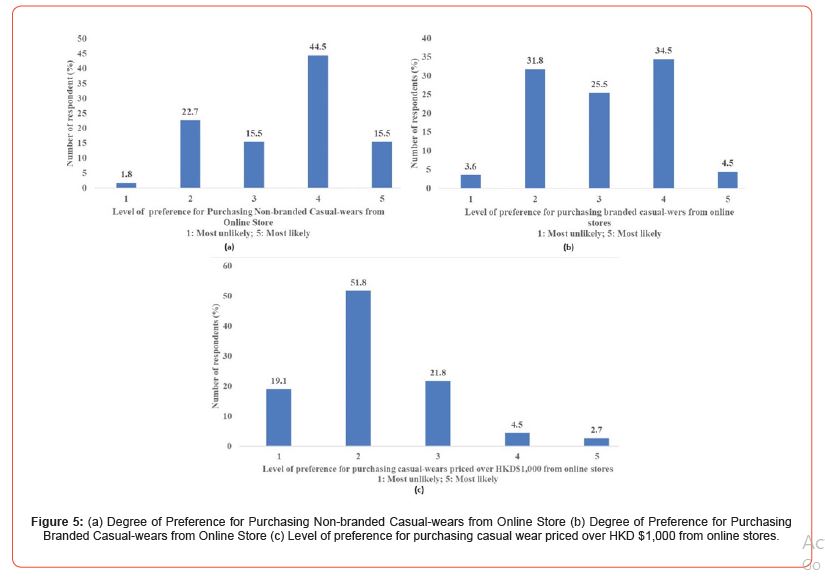
Figure 5 presents the degree of preference for online stores over physical stores for non-branded, branded, and costly casual-wear products. For nonbranded products (see Figure 5 (a)), 44.5% of the respondents partly prefer (Likert-scale rating is 4) and 15.5% fully prefer ((Likert-scale rating is 5) buying apparel from online stores; whereas, 22.7% of the respondents partly agree (Likert-scale rating is 2) and 1.8% fully agree (Likert-scale rating is 1) to buy them from physical stores. Only 15.5% of the respondents expressed a neutral opinion (Likert-scale rating is 3).
For branded casualwear (see Figure 5(b)), an increase has been observed towards physical stores. Only 39% (34.5% and 4.5%- Likert 4 and 5) prefer buying from online stores, while 35.4% are inclined toward Physical stores (Likert 1 and 2). Around 25.5% of respondents seems to have no effect of the brand name on their preference (rated 3 on the Likert scale). For expensive casual garments (price over HKD$1,000), buyers prefer physical stores (see Figure 5(c)) over online stores. According to the graph, the majority of respondents (over 70%) prefer purchasing from physical stores (rated 1 and 2 on the Likert scale), while only around 7% (3 and 4 on the Likert scale) of respondents prefer online stores. This is because they want to see and feel the product before paying such huge amount. 21.8% of the respondents expressed their neutral opinion on this question (Likert-scale rating is 3)
Reliability test
To ensure the reliability and authenticity of consumer data obtained from a survey, it is crucial to examine the robustness of the study. Cronbach’s alpha ranges from 0 to 1 and measures the internal consistency of a composite score. A value above 0.7 suggests the parameters in a composite test are reliable. In our case, Cronbach’s alpha is 0.792 indicating that the five consumer choice parameters (preference of apparel, preference for branded apparel, preference for non-branded apparel, preference from apparel priced above HKD 1000/-, and replacement). are consistent and reliable. Table 2 provides the reliability statistics of these five keys parameters, and displays the values of Cronbach’s alpha of individual parameters when deleted from the list. All five parameters have a lower value (total preference: 0.726, preference for branded apparel: 0.749, and replacement: 0.779, preference for non-branded apparel: 0.786, and preference from apparel priced above HKD 1000: 0.723) than the combined value of 0.792. This indicates that each factor is necessary for the consistency of the whole study. The correlation values (corrected item-total correlation) of the factors are high enough to imply a consistent correlation among the factors except for two parameters (preference for non-branded apparel: 0.486, and Replacement : 0.488.
Regression analysis
A regression analysis was conducted to assess how a particular factor impacts various other factors that influence consumer purchasing decisions. Pearson’s correlation model was utilized to examine the relationships between these factors. The correlation between consumers’ gender and their apparel preferences and preference for replacements was obtained. The correlation regression values indicate a strong correlation of 0.233 (with regard to preference) and 0.284 (with regard to replacement) with consumers’ gender. The p-values of 0.014 and 0.003 confirm the null hypothesis for preference and replacement factors respectively, falling within α < 0.05 threshold.
Upon examination of the correlation between the price of items above HKD 1000 with a price range and the employment status of the consumers, significant correlations were observed. Pearson’s correlation regression values were 0.336 (with respect to price range) and 0.205 (with respect to employment status), indicating strong associations between these factors and the price of items above HKD 1000. Furthermore, the p values of 0.001 (with respect to price range) and 0.032 (with respect to employment status) fell well within α < 0.05, thus supporting the null hypothesis.
Impact assessment by Box-Behnken Design
Based on the above analysis, it is clear that four key variables - type of item, item price, retailer-related factors, and socio-technical factors - have a significant impact on a consumer’s decision to buy online or offline. It’s crucial to understand the statistical impact of these factors on consumer choice [20]. To achieve this, a response surface methodology (RSM) using the Box-Behnken Design (BBD) was used to analyze the impact of these categories, as demonstrated in Table 3. The BBD analysis involved 27 respondents, and the results are shown in Table 4, which displays the actual and predicted ratings of respondents on a 1-5 preference scale (where 1 indicates the least preference for online shopping, and 5 indicates the highest preference). The predicted values closely align with the actual ratings, indicating the robustness of the design. This robustness is confirmed by the regression coefficient (R2), which is 0.9559, meaning that 95.59% of the variability in these four factors can be explained by the Box-Behnken Design model. According to the literature, an R2 greater than 0.90 suggests a high correlation for a Box-Behnken Design [21].The adjusted R2 of 0.9044 is very close to the experimental R2, further highlighting the significance and robustness of the BBD.
Table 2: Item-total statistics of five factors (preference of all apparels, preference for branded apparels, preference for non-branded apparels, preference from apparels priced above HKD 1000, and replacement).

Table 3: Design of experiment with significant factors using Box-Behnken Design.

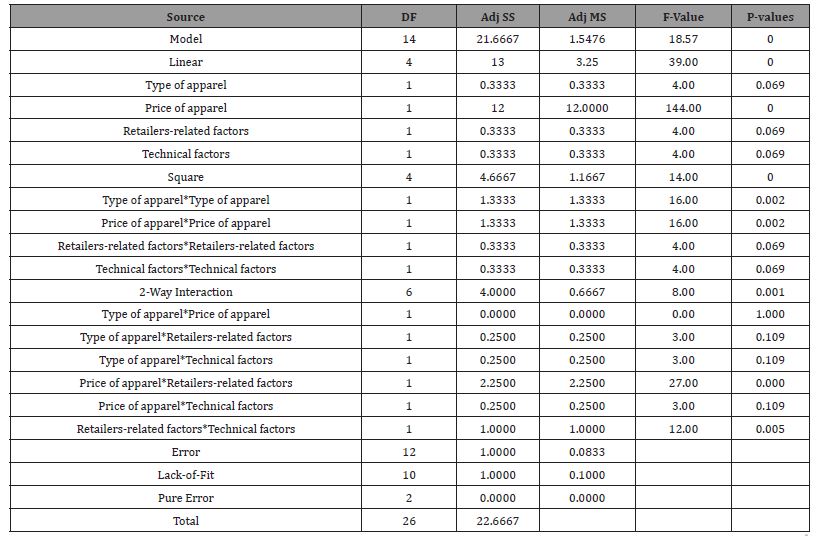
Based on the information presented in Table 5, the p-values of the factors demonstrate the accuracy and robustness of the design. The lowest p-values are attributed to the prices of the items, indicating that the prices of the items are the most important factor to consider when making a purchase from online stores. Upon analyzing the sub-factors in Table 4, we found that there was no significant difference between predicted and actual ratings in Runs 6, 7, 9, 12, 17, and 20. This suggests that the price range of HKD 301-600 is preferred by consumers, with other sub-factors varying to some extent. The regression equation that incorporates these four factors in BBD is provided below:
Response = 4.000 + 0.1667 * a + 1.0000 * b - 0.1667 * c - 0.1667 * d + 0.500 * a * a
0.500 * b * b - 0.250 * c * c - 0.250 * d * d - 0.000 * a * b - 0.250 * a * c
- 0.250 * a * c + 0.750 * b * c + 0.250 * b * c + 0.500 * c * d
Where, a is “types of apparel”, b is “prices of apparel”, c is “retailers’-related factors” and d is “socio-technical factors”.
Table 4: Results of experimental design of factors of Box-Behnken Design.
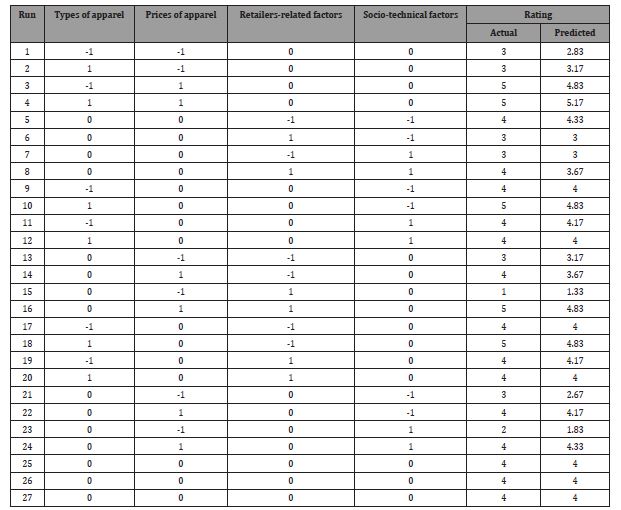
Table 5: Analysis of Variance of the BBD.
Conclusion and Limitations
The results of the study show that a significant majority of young people in Hong Kong (over 80% of those surveyed) prefer to purchase their clothing from online stores rather than physical ones. This is due to the convenience of e-commerce, which offers faster delivery and lower prices. Physical stores are experiencing a decline in foot traffic as a result. The study also found that 43.8% of respondents believe that online fashion retail has replaced physical stores. To enhance the online shopping experience, it is recommended to prioritize factors such as price, taking into consideration that consumers tend to prefer items priced between HKD 301-600. Additionally, offering discounts, virtual try-on features, and a wider range of products can contribute significantly to the overall satisfaction of consumers.
This survey revealed that technology influences customers’ preference for shopping casual wear online or offline. People could not only buy what they want and need in a physical store, but they could also make their purchases wiser online. From respondents’ feedback, it can be said that the preferred shopping channel has dramatically switched from physical to online stores.
Present survey also found that consumers’ choices of shopping habits will change in different situational settings. When deciding on a shopping platform, customers will often compare brand prices across multiple sites before making a purchase. For the purchase of non-branded products, 60% of respondents will choose e-commerce platforms; whereas for branded products, only 34.5% of respondents prefer the same platform, and a sizable 31.8% will choose a physical store. Interestingly, for purchasing a product of more than HK$1,000, 70.9% of respondents will choose a physical store.
The present study focused on the shopping habits and opinions of Gen Y and Z customers in Hong Kong. To improve the study, future research could focus on narrower age groups and larger sample sizes. Additionally, the cultural component was not included, so results may vary across different nations. It’s important to note that this survey was conducted on a small group of young people living in Hong Kong, which doesn’t necessarily reflect shopping trends in other parts of China or Asia.
Acknowledgement
The authors give appreciation to the School of Fashion and Textiles L & T Development Grants—2023/24, Hong Kong Polytechnic University. The authors also express gratitude to the LTC(TDG) 2022-25 Projects fund (Project Code: TDG22-25/R2/ SMS-16), The Hong Kong Polytechnic University.
Conflict of Interest
Authors declare no conflict of interest.
References
- Hudders L, Pandelaere M (2011) The Silver Lining of Materialism: The Impact of Luxury Consumption on Subjective Well-Being. Journal of Happiness Studies 13(3): 411-437.
- Oberlo (2023) How many people shop online? (2020-2025).
- Cramer-Flood E (2023) Worldwide Ecommerce Forcast 2023.
- Statista (2024) Number of users of e-commerce in Hong Kong 2019-2028.
- Chan, H.-L., Kwok, Y.-K, Wong, S.-M (2022) Marketing and operational strategies during the COVID-19 pandemic: a case study of a Hong Kong footwear enterprise. Journal of Fashion Marketing and Management: An International Journal.
- World-Bank (2023) Logistics Performance Index.
- Verhoef PC, Neslin SA, Vroomen B (2007) Multichannel customer management: Understanding the research-shopper phenomenon. International Journal of Research in Marketing 24(2): 129-148.
- Lin YL, Wang MJJ(2015) The development of a clothing fit evaluation system under virtual environment. Multimedia Tools and Applications 75(13): 7575-7587.
- Katawetawaraks C, Wang CL (2011) Online Shopper Behavior: Influences of Online Shopping Decision. Asian Journal of Business Research 1(2).
- Bonnin G (2020) The roles of perceived risk, attractiveness of the online store and familiarity with AR in the influence of AR on patronage intention. Journal of Retailing and Consumer Services 52: 101938.
- Kim J, Forsythe S (2008) Adoption of Virtual Try-on technology for online apparel shopping. Journal of Interactive Marketing, 22(2): 45-59.
- Lim H, Dubinsky AJ (2004) Consumers' perceptions of e‐shopping characteristics: an expectancy‐value approach. Journal of Services Marketing 18(7): 500-513.
- Park CH, Kim YG (2003) Identifying key factors affecting consumer purchase behavior in an online shopping context. International Journal of Retail & Distribution Management 31(1): 16-29.
- Kim S, Park H, Kader MS (2022) How augmented reality can improve e-commerce website quality through interactivity and vividness: the moderating role of need for touch. Journal of Fashion Marketing and Management: An International Journal 27(5): 760-783.
- Park HH, Sullivan P (2009) Market segmentation with respect to university students' clothing benefits sought. International Journal of Retail & Distribution Management 37(2): 182-201.
- Tao Q, Xu Y (2018) Fashion subscription retailing: an exploratory study of consumer perceptions. Journal of Fashion Marketing and Management: An International Journal 22(4): 494-508.
- Vehmas K, Raudaskoski A, Heikkilä P, Harlin A, Mensonen A (2018) Consumer attitudes and communication in circular fashion. Journal of Fashion Marketing and Management: An International Journal 22(3): 286-300.
- Kim J, Leung XY, McKneely B (2023) The effects of Instagram social capital, brand identification and brand trust on purchase intention for small fashion brands: the generational differences. Journal of Fashion Marketing and Management: An International Journal 27(6): 988-1008.
- Lee HK, Choi D (2022) Can I touch the clothes on the screen? The mental simulation for touch in online fashion shopping. Journal of Fashion Marketing and Management: An International Journal 27(3): 418-435.
- Chakraborty R, Samanta AK, Vankar PS (2023) Statistical Optimization of Process Variables for the Dyeing of Jute with Marigold Petals Using a Dual Mordant System. AATCC Journal of Research 11(1): 20-36.
- Venkataraghavan R, Thiruchelvi R, Sharmila D (2020) Statistical optimization of textile dye effluent adsorption by Gracilaria edulis using Plackett-Burman design and response surface methodology. Heliyon 6(10): e05219.
-
Man Sum Wong, Ritwik Chakraborty, Ka Man Mok, Ka Man Tang and Manas Kumar Sarkar. Technological and Social Impact on Hong Kong’s Young Consumers’ Online Shopping Behavior for Fashion and Casual Apparel: A Statistical Analysis. J Textile Sci & Fashion Tech 10(4): 2024. JTSFT.MS.ID.000746.
-
E-commerce, Online shopping, Fashion retailing, Consumer preference, Try-on Technology
-

This work is licensed under a Creative Commons Attribution-NonCommercial 4.0 International License.


