 Research Article
Investigation of the Water–Based Ink Hold onto the Thermoplastic Composites Reinforced with Sisal Fibers
Oguz Eryilmaz1*, Sinan Sonmez2, Sabih Ovali3 And Kumar Jois4
1Department of Textile Engineering, Faculty of Technology, Marmara University, Turkey
2Department of Printing Technologies, School of Applied Sciences, Marmara University, Turkey
3Department of Textile Engineering, Faculty of Engineering, Adıyaman University, Turkey
4Institut für Textiltechnik, RWTH Aachen University, Germany
Oguz ERYILMAZ, Department of Textile Engineering, Faculty of Technology, Marmara University, Goztepe Campus, Kadikoy, Istanbul, 34720 Turkey.
Received Date: May 01, 2020; Published Date: May 13, 2020
Abstract
In this study, the surface adhesion of the ink on composite materials was examined. For this purpose, composite materials were produced by adding polypropylene, thus polyethylene thermoplastic matrices were reinforced with sisal fibres. After the production of composites, the screenprinting process using water-based ink was applied to composite surfaces to investigate printing performance. As a result of these applications, the printability of the PE was found to be better than the PP. Also, the ink was adhered to the surface by forming a bond with the composite surface at polyethylene materials, but meanwhile not being able to hold onto the polypropylene composite surface.
Keywords: Sisal; Polypropylene; Polyethylene; Composite materials; Printability
Introduction
Over the last few decades, more attention is given to cellulosebased fibers as reinforcement fillers in the polymer composites owing to the environmental pollution caused by the extensive usage of synthetic fibers such as glass fibers to produce composite materials [1]. Unlike synthetic fibers, natural fibers possess lightweight, high strength, and are readily available, environmentally friendly and biodegradable. The utilization of natural fibers for the generation of composites has many advantages, for example, recyclability, eco-friendly products, etc. Many different types of natural fibers are being exploited for the production of biodegradable polymer composites [2-6]. More than a thousand types of natural fibers are already available [7]. Among these, sisal fibers (SF) are one of the best reinforcing materials for polymer composites owing to their higher cellulose content (78%), good tensile strength (>600 MPa), easy availability and low cost [8]. However, similar to other natural fibers, sisal fibers are poorly compatible with the matrices of thermoplastics, due to their hydrophilic surface which in turn reduces the thermal and mechanical properties of sisal fibers reinforced thermoplastics. Especially in the fiber-matrix interfaces, the hydrophobicity of the fibers causes poor mechanical strength and hence limits their applications studied the mechanical and rheological properties of different lignocellulose fiber materials reinforced polypropylene composites [9,10]. It has been observed that using different types of fibrous materials tensile modulus improved by more than 10% for fiber-reinforced polypropylene composites [11].
FRP is a composite material consisting of a polymer matrix embedded with high- strength fibers, such as glass, aramid, and carbon. Generally, the polymer can be classified into two classes, thermoplastics and thermosets. Thermoplastic materials currently dominate, as matrices for bio-fibers; the most commonly used thermoplastics for this purpose are polypropylene (PP), polyethylene (LDPE and HDPE), and polyvinyl chloride (PVC); while phenolic, epoxy and polyester resins as thermosetting matrix [12].
Polyethylene (PE) polymers have peculiar mechanical properties due to the high strength to weight ratios and stiffness to weight ratios. Because of these unique properties, PE polymers possess huge potential for the use of composite structures, especially where the crucial damping properties are required. Hence, sisal fibers are being utilized with the combination of viscoelastic PE to attain a high-quality balance of damping behaviour [13,14].
All information about the product in the package must be found on the composite surface to be employed as packaging material. According to other printing systems, Screen – printing technique is widely preferred as a printing system due to its advantages of low cost, controllable thickness, and film uniformity as well as effective printing quality on different printing surfaces. It is also an environmentally friendly printing system for water-based inks expended in printing and for recycling [15].
In this work, environmentally friendly water-based ink, which is demanded extensively in the industry, were each printed on the polyethylene and polypropylene (PP) composite materials reinforced with sisal fiber surface using the screen – printing technique. After the printing, the ink adhesion on the surface of the composite materials, their roughness was investigated.
Experimental
Materials
In this study, it was investigated the ink adhesion on the surface of composite materials using textile fabrics. For this purpose, polyethylene (PE) and polypropylene (PP) was exerted as a thermoplastic resin and reinforced with sisal fiber (SF) to produce composite samples. The properties of the materials for the production of the composites are given in Table 1.
Table 1:Properties of PP, PE, and SF [16,17].

Composite production method
Figure 1 show that the hot – compression molding system (Hürsan Hydraulic Press 77/370 model) was served to fabricate using polyethylene (PE), polypropylene (PP) chips and sisal fibers for composite materials.
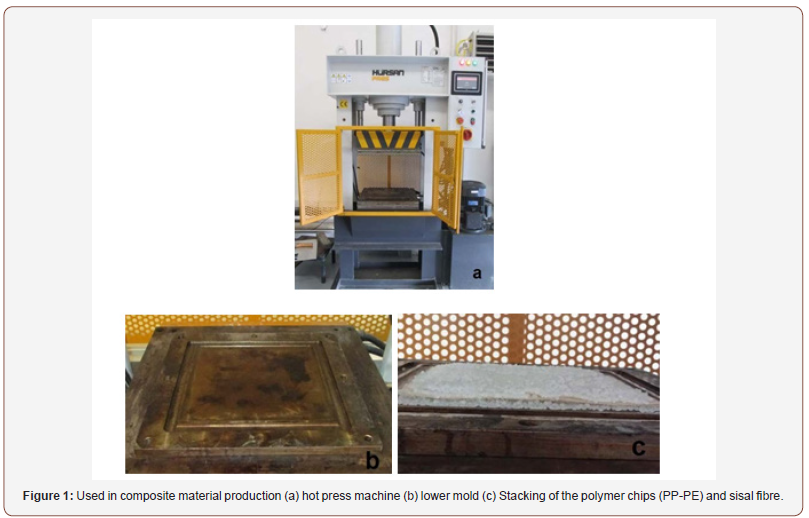
Sisal fibers, PP and PE polymer chips were put in 30x30 cm2 sample molds. Polivaks SV-6, a cream-like high-performance wax, was used to separate the thermoplastic materials homogeneously all over the mold. Figure 2 shows the simple diagram of the hot – compression molding process used to produce the SF/PP-PE composites in a representative manner.
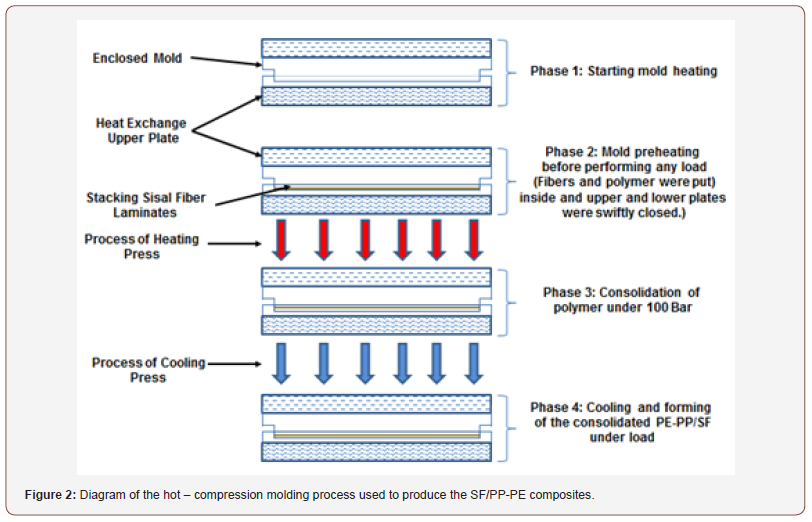
The temperature of the hot press machine is 200 °C both lower and upper plate and the pressure condition is 100 Bar. The processing time is defined 15 min for the production of the PE and PP composites reinforced with sisal fibers. The produced composite material properties have been given in Table 2.
Table 2:Properties of produced SF/PP and SF/PE composites.

The cross-section of produced composite samples is given in Figure 3. The images have shown sisal fiber and plastics structures.

Methods
The chemical structures of the synthesized monomer were identified by FT-IR. The FT-IR spectrum was recorded on a Shimadzu 8303 FT-IR spectrometer (Shimadzu Corporation, Kyoto, Japan). The surface roughness of these bio-composite materials was measured using a portable MarSurf M 300 roughness measurement device (Mahr GmbH, Göttingen, Germany) with a 5.6mm traversing length according to DIN EN ISO 4288 [18], and the values of the surface roughness “a” (Ra; an arithmetic average of absolute values) and the surface roughness “z” (Rz; average distance between the highest peak and lowest valley in each sampling length) were recorded.
The contact angle of the PP and PE composite samples was measured using a PG-X Goniometer (Paul N. Gardner Company, Inc., FL, USA) based on TAPPI T 558 [19]. One- color printing with environmentally friendly water-based cyan ink was applied on the PP and PE composite samples through the screen-printing technique. The equipment operated for printing was a semiautomatic screen-printing machine. The mesh number was 120 threads per cm (tpc), and the dot per cm was 40 (dpc). The angle of the squeegee was 45°, and the hardness of squeegee was 75 Shore [20]. The density values of the PP and PE composite samples were measured by a Gretag Macbeth SpectroEye instrument (45/0°) (X-Rite, Inc., MI, USA). Also, the CIE L*, a*, and b* values of the PP and PE composite samples were measured by the D50 illuminant/2° observer values using the same instrument.
Scanning electron microscopy (JEOL JSM - 5910LV) was used to characterize the surface morphology of SF/PE and SF/ PP composites. The samples were coated with a thin layer of gold before observation under the microscope mark, in order to increase the sample conductivity.
The IPC-TM-650 Adhesion, Tape Testing Method was performed to test the ink adhesion on the bio-composite surface [21].
Finally, the digital micrographs were taken from using SZ60 – PT OLYMPUS Stereo Microscopes to magnify the composite layers.
Results and Discussion
Surface properties
Roughness: Table 3 showed the Roughness values of PE and PP samples, which are measured as a MarSurf M 300 roughness measurement. Ra values closer to zero indicate a smoother surface. A smoothness surface decreases dot gain and ensures prints, which contain sharp image [22,23].
Table 3:PE and PP sample roughness values.

Ra value of PE sample has higher than the PP sample. It means the PP sample is smoothness other samples. It is so important to obtain a sharper print dot. Hence, Print quality will be increased.
Surface contact angle: The degree of wetting when a solid and liquid interact is called Contact angles. A contact angles Less than 90 degrees correspond to high wettability, while a contact angles greater than 90 degrees corresponds to low wettability. Poor ink wettability shows low surface energy has high contact angles [24].
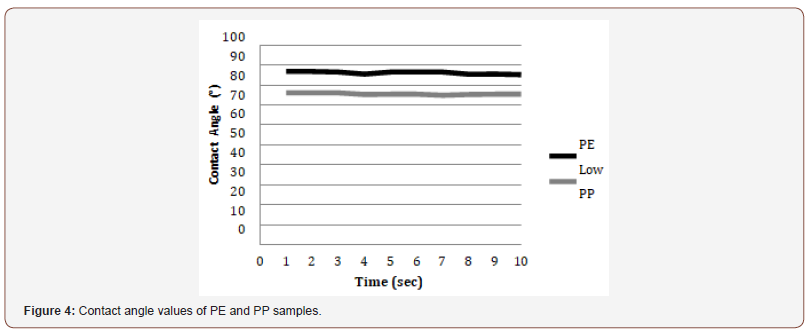
During the 10 s test, the contact angles of the samples declined slowly, indicating that there was less ink spreading or ink immobilization (Figure 4). This could provide improved image resolution and sharpness. The contact angle assessed on the PP surface was higher than on the PE. PE surface was more hydrophilic than the PP surface. This was an important factor for ink adhesion during the printing process.
Yellowness: After print, printed color expects to match the original image. It is so important a qualified print. Though, the quality and kind of pigment including print ink and the yellowness values of having print substrate have a negative effect on printed color [25].
The yellowness values of the samples are given in Figure 5. The yellowness values of the PP sample are higher than the other sample. So, the chromatic deviation of printed color on the PP sample is significantly more than in other samples. The print quality may have lower than expected.

Printability properties
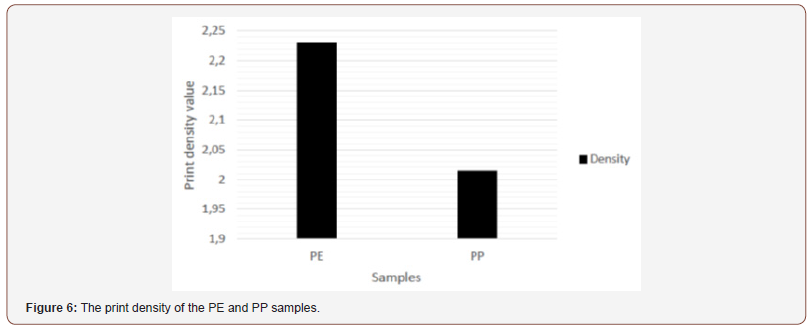
Optical print density: The optical print density is a measure of contrast between the unprinted substrate and printed space after printing. A good print of the contrast between the print and substrates determines an important factor. The ink penetration affects the print density. A lower porosity results in a higher print gloss and a higher print density due to the lower ink penetration in the z-direction. The print density is affected by the ink ingredients spent and mechanical and environmental print conditions [26,27].

where DS is the print density of the printed region, R∞ is the reflectance factor of the substrate and RS is the reflectance factor of the printed region.
The printing density value of the PE is slightly higher than the PP samples. PE has positively affected print density (Figure 6).
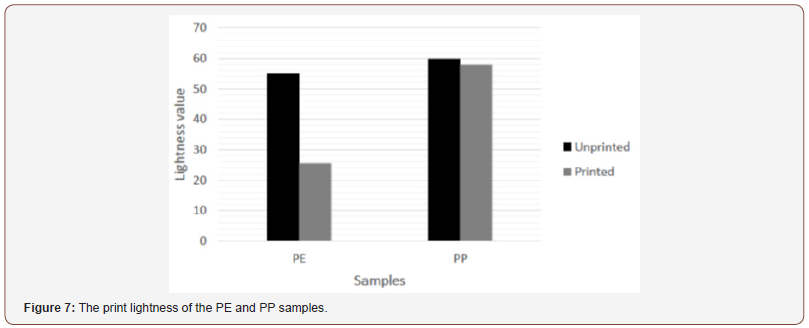
Print lightness: The lightness (L*) value shows the saturation of the color. The lightness value ranges from 0 to 100. L* is nearer to 0, the obtained print is Darker. On the contrary, lighter prints are obtained [28].
Figure 7 show the L* values of the printed and unprinted composite samples. The printing lightness value of unprinted composite samples was higher than printing the lightness value of printed composite samples. While this difference is clearly in the PE sample, it is much less in the PP sample. Printed PP samples have a higher printing lightness noticeably. Thus, the obtained shade for the printed PP samples was lighter than what was desired.
Print chroma: The chroma refers to the color, and it can be measured through the color intensity or saturation [29]. A high chroma indicates high color saturation, which is an important property for good quality prints. Another important property is the high color gamut. The print chroma value (Cab) was calculated by Equation 1 [30].

Where Cab is the print chroma. a*, negative values indicate green, while positive values indicating magenta. b*, negative values indicate blue, and positive values indicate yellow.
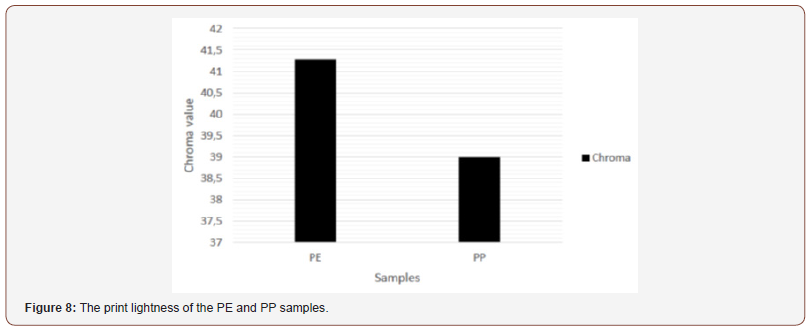
Figure 8 shows the print chroma values of the PE and PP samples. The print chroma value of the PP sample was lower than PE. It showed that the PE sample has the possibility of attaining a wider color range than PP. This was an important parameter to obtain a good print.
Ink adhesion: The determination of the ink adhesion of printed composite samples, Printing side of the printed PE and PP samples has pasted the tape. Then the pasted tape was removed from the surface. The testing procedure is shown in Figure 9.
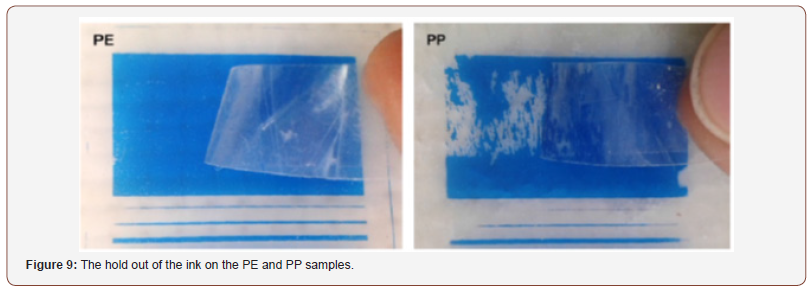
While the ink was removed with the tape from the surfaces of the PP samples, the ink remained on the surfaces of the PE sample.
The results showed that the ink was adhered to only physically via drying on the surface of the PP sample. Thus, the ink was removed from the surface. Did not occur the ink of the removed tape on PE shows the permanent adhesion that the most important characteristic of printability is.
SEM Images

Figure 10 present the surface morphology of the composite samples used for the experiment was examined through scanning electron microscopy in order to get insight into fiber – matrix adhesion between PE/SF and PP/SF samples. When the SEM images of composite materials are examined, it is seen that the necessary binding (adhesion) occurs between the surface treated sisal fiber and the thermoplastic-based PE/PP matrix, and a physical attachment occurs between the fiber and the matrix. However PE matrix has slighter surface morphology behaviour than PP, so this situation led better ink hold onto the composite.
FT-IR Spectrum
The FT – IR spectra were attained by utilizing the Attenuated Total Reflectance (ATR) module. The spectra show the functional groups on the composite material surface and water-based ink. Figure 11 (a) shows the FT-IR spectrum of the environmentally friendly water- based ink.
There is a –OH absorbance band as it stems from the nature of the water-based ink and also its peak is around 3235 cm-1. Between 2850 cm-1 2990 cm-1, –CH2 and –CH3 aliphatic groups have been located in the FT-IR spectrum. In the range of 1638 cm-1 to 1729 cm-1 indicated that ink has a C=O group from its characteristic.
The FT – IR spectrum of the composite polyethylene matrix surface reinforced by glass fibers is seen in Figure 11 (b). As it is clearly understood from the FT – IR spectrum analysis, –CH2 and –CH3 aliphatic groups have been seen and their peaks situated around 2921 cm-1.
In Figure 11 (c), FT – IR spectrum of the composite polypropylene matrix surface reinforced with glass fibers is shown. Polypropylene has a characteristic –CH2 and –CH3 aliphatic groups and they are found in the range of 2850 cm-1and 2990 cm-1, but in the analysis, its peak is very weak due to with a combination of the sisal fiber, polypropylene’s peak can be seen very slightly.
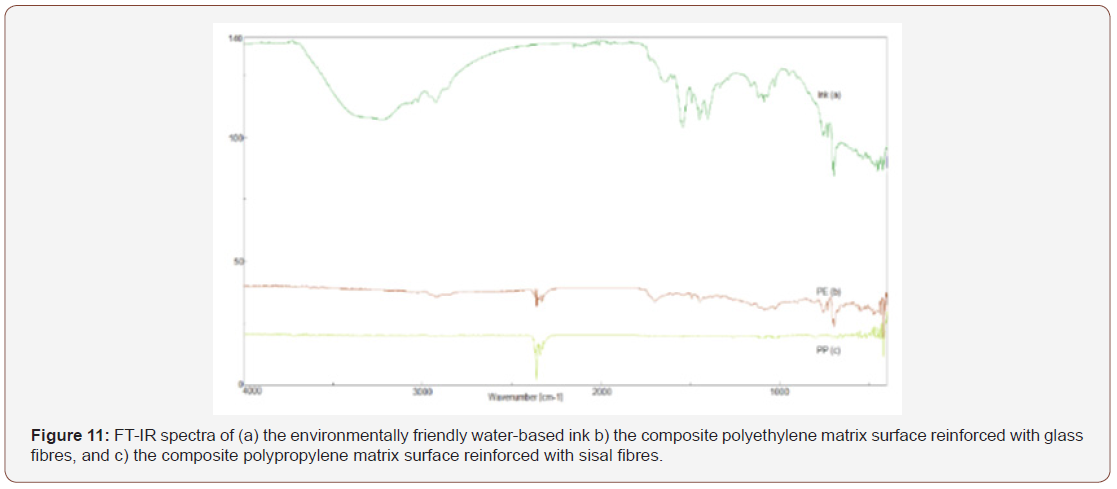
Table 4:Drop views on the PE and PP samples in the first and 10th sec.

Conclusions
• PP used in the composite was decreased roughness that it is important factors obtain for a good print surface because of increasing the composite surface smoothness. Due to decreased ink absorption of a smoother surface will increase the print density. But, the PE having a high surface roughness has a further increase in the ink holding on the surface due to the greater settlement of the ink pores.
• Yellowness values increased in printed composite samples. Especially, PP has higher Yellowness than other samples. It shows that the chromatic deviation of printed color on PP is ahead.
• Because the print lightness values of PP used in the composite are increased, the obtained shades in the print will be caused lighter. As a result, the print quality will be negatively affected.
• The PE surface is more hydrophilic than PP surfaces. So, the image transfers onto PE surface printed using environmentally friendly water-based ink and the drying stages have not displayed better performance and printability. Also, the use of PE in composites is narrowing the color gamut. So, color values, which can be achieved, will be more limited. However, while the ink of the removed tape on the PP sample occurs the ink of the removed tape on the PE sample shows the permanent adhesion that the most important characteristic of printability is.
Acknowledgement
This research project was sponsored by Marmara University Scientific Research Project Committee with grant number FEN-CYLP- 100616-0277.
Conflict of Interest
None.
References
- Herrmann AS, Nickel J, Riedel U (1998) Construction materials based upon biologically renewable resources – from components to finished parts. Polym Degrad Stab 59(1-3): 251-261.
- Satyanarayana KG, Arizaga CG, Wypych F (2009) Biodegradable composites based on lignocellulosic fibers–an overview. Prog Polym Sci 34(9): 982-1021.
- Abdul Khalil HP, Bhat AH, Ireana Yusra AF (2012) Green composites from sustainable cellulose nanofibrils: a review. Carbohydr Polym 87(2): 963-979.
- De Rosa IM, Kenny JM, Puglia D, Santulli C, Sarasini F (2010) Morphological, thermal and mechanical characterization of okra (Abelmoschus esculentus) fibres as potential reinforcement in polymer composites. Compos Sci Technol 70(1): 116-122.
- Mwaikambo LY, Ansell MP (2002) Chemical modification of hemp, sisal, jute, and kapok fibers by alkalization. J Appl Polym Sci 84(12): 2222-2234.
- Li Y, Mai YW, Ye L (2000) Sisal fibre and its composites: a review of recent developments. Compos Sci Technol 60(11): 2037-2055.
- Zhou F, Cheng G, Jiang B (2014) Effect of silane treatment on microstructure of sisal fibers. Appl Surf Sci 292: 806-812.
- Mahjoub R, Yatim JM, Mohd Sam AR, Hashemi SH (2014) Tensile properties of kenaf fiber due to various conditions of chemical fiber surface modifications. Constr Build Mater 55: 103-113.
- Paraparita E, Darie RN, Popescu CM, Uddin MA, Vasile C (2014) Structure morphology-mechanical properties relationship of some polypropylene/ lignocellulosic composites. Mater Des 56: 763-772.
- Cho D, Lee H, Han S (2009) Effect of Fiber Surface Modification on the Interfacial and Mechanical Properties of Kenaf Fiber-Reinforced Thermoplastic and Thermosetting Polymer Composites. Composite Interfaces 16(7-9): 711-729.
- Vasile C (2014) Structuremorphology-mechanical properties relationship of some polypropylene/ lignocellulosic composites. Mater Des 56: 763-772.
- Luyt AS, Molefi JA, Krump H (2006) Thermal, mechanical and electrical properties of copper powder filled low-density and linear low-density polyethylene composites. Polymer Degradation and Stability 91(7): 1629-1636.
- Nabi Saheb D, Jog JP (1999) Natural fiber polymer composites: a review. Advances in Polymer Technology 18(4): 351–363.
- Scudamore RJ, Cantwell WJ (2002) The effect of moisture and loading rate on the interfacial fracture properties of sandwich structures. Polymer Composites 23(3): 406- 417.
- Wang LL, Tay BK, See KY, Sun Z, Tan LK, et al. (2009) Electromagnetic interference shielding effectiveness of carbon-based materials prepared by screen printing. Carbon 47(8): 1905-1910.
- Ku H, Wang H, Pattarachaiyakoop N, Trada M (2011) A review on the tensile properties of natural fiber reinforced polymer composites. Composites Part B: Engineering 42(4): 856-873.
- Wambua P, Ivens J, Verpoest I (2003) Natural fibers: can they replace glass in fiber reinforced plastics? Composites Science and Technology 63(9): 1259-1264.
- DIN EN ISO 4288 (1998) Geometrical product specifications (GPS) - Surface texture: profile method - rules and procedures for the assessment of surface texture. Beuth Verlag GmbH, Berlin, Germany.
- TAPPI T 558 (2010) Surface wettability and absorbency of sheeted materials using an automated contact angle tester. TAPPI Press, Atlanta, USA.
- Sonmez S (2017) Development of printability of bio-composite materials using luffa cylindrica fiber. Bioresources 12(1): 760-773.
- (2016) IPC-TM-650 test methods manual: adhesion, tape testing.
- Sonmez S (2017) Comparison of into the effects of ultraviolet flexo ink on printability of the paperboards coated with carboxymethyl cellulose and polyvinyl alcohol. Journal of Polytechnic 20(4): 985-991.
- Gencoglu E, Ozden O, Simseker O (2010) Effects of carboxymethyl cellulose as a surface sizing agent on the printable properties of the newspaper. Asian J Chem 22(7): 5561-5566.
- Sonmez S (2011) Interactive effects of copolymers and nano-sized pigments on coated recycled paperboards in flexographic print applications. Asian J Chem 23(6): 2609- 2613.
- Sonmez S, Elmas GM (2017) Printability effect on asam rumex extracted papers (handsheets) for vegetable-oil inks. Oxidation Communications 40(1-2): 441-450.
- Jeong K, Koseki K (2007) Transfer characterization of UV flexographic ink: Relationships between printability and rheological properties. Nordic Pulp & Paper Research Journal 22(3): 293-298.
- Sonmez S, Fleming PD, Joyce MK, Ozden O (2010) Effects of coat weight and pigment selection on flexographic printability of coated test liners. Tappi PaperCon, Atlanta, USA.
- Viscarra Rossela RA, Minasnya B, Roudiera P, McBratneya AB (2006) Colour space models for soil science. Geoderma 133(3-4): 320-337.
- Elmas GM, Sonmez S (2011) Printability properties of some alkaline sulfite- anthraquinone-methanol handsheets. Asian J Chem 23(6): 2515-2519.
- Fairchild MD (2004) Color appearance models: CIECAM02 and beyond.
-
Oguz ERYILMAZ, Sinan SONMEZ, Sabih OVALI, Kumar JOIS. Investigation of the Water–Based Ink Hold onto the Thermoplastic Composites Reinforced with Sisal Fibers. J Textile Sci & Fashion Tech. 5(3): 2020. JTSFT.MS.ID.000612.
-
Sisal, Polypropylene, Polyethylene, Composite materials, Printability, Fiber materials, Textile fabrics, Polymer
-

This work is licensed under a Creative Commons Attribution-NonCommercial 4.0 International License.


