 Research Article
Color Measurement and Colorfastness of Different Weaves and Dimensional Forms
Usha Chowdhary, Department of Fashion Interior Design and Merchandising, Central Michigan University, Mount Pleasant, Michigan 48858, USA.
Received Date: March 18, 2021; Published Date: March 31, 2021
Abstract
Color of the apparel plays an important role in deciding to accept or reject the product by consumers. Previous researchers also explored improvement of the color strength and performance, as well as coloration through dyeing and printing. The reported study was designed to bring together several aspects of apparel product development such as textile testing, garment design, and 3-D printing wit implications for fashion merchandising. fashion merchandising This study however, investigated the impact of woven fabric structures (weaves) and three-dimensional forms on their color appearance.
Factorial research design (2x3x3x5) guided the study. Color values of flat fabric were compared against their color values on five different three-dimensional regions of the human torso (chest, shoulder blade front, under arm, shoulder blade back, and side seam) for their impact on the fabric’s color appearance. The investigation involved plain, twill and satin weaves sourced form Cotton Incorporated. All the fabrics were dyed in red and green colors. Structural attributes were evaluated according to ASTM and AATCC standards. Miniature tunics were sewn with plain, twill, and satin weave fabric in red and green color. These tunics were put on to a 3D dress form and color values were measured with a spectrophotometer.
The color data were collected under day, incandescent and fluorescent lights. Eleven null and alternative hypotheses were developed. The collected data were analyzed with IBM SPSS, Minitab and Microsoft Excel software. General factorial regression and Analysis of Variance (ANOVA) were used to test the hypotheses. The results were mixed. Some of the previous findings were supported and some were contradicted. Findings with implications for fashion merchandising.
Introduction
Color has attracted consumer for centuries and has been used in textiles since then. Scholars have examined color for its physical as well as psychological impact. Artists have used it from aesthetic perspective as primary, secondary and tertiary colors, warm and cool colors and advancing and receding colors [1]. Davis also offered several types of color schemes to help you color in aesthetically pleasing manner. Some examples include monochromatic, analogous, complementary, triads and tetrads. Scientists have used it in televisions and computers based on additive (RGB) and subtractive (CYM) theories [2]. CIELAB focuses on L* for lightness and darkness, a* for redness and greenness, and b* for blueness and yellowness. Notation of L*a*b* represents all three colors and is denoted by ΔE. The value of ΔE between 2-5 is reported to be visible to the human eye [3].
Several color management systems are used by the textile industry. Pantone, International Color Authority ICA), and the Color Association of the United States are few such examples [4]. Another source reported that finished garment in three-dimensional form can have different L*a*b* values that the flat fabric [5]. Color is introduced to fabric through dyeing and printing and is used extensively in the textile industry [2,6]. Based on light theory, color refers to the sensation caused by reflection of light from any object. Generally, it is function of light, wave-length and its reflection or absorption [2]. Based on science base, there are two types of color theories: Additive and Subtractive. The additive theory uses red, green and blue as the primary colors and combination of all three creates the white color. In contrast, the subtractive theory uses cyan, yellow and magenta as the primary colors and combining them results in the black color. Pantone color system is based on the subtractive theory.
To measure color, the International Commission on Illumination (CIE) developed CIELAB Color Space. 8,2 CIE identified it as one of the uniform color spaces that did not have the problem of different colors for same distance [8]. The tristimulus concept was introduced in 1931. Difference between the target and sample value determines ΔE. One of the recent studies reported that L value of 100 denotes white color and 0 denotes black color [9]. Rating between 0-100 represents gray color. The a* values refer to red or green A positive a value represents dominance of red and negative value of a indicates supremacy of green. Red and green colors go from East to West. The blue and yellow colors go from North to South. The positive b* value indicates closeness to yellow and negative value to blue. Color difference value (ΔE) is determined by using the formula below (Precision Color Communication, 2007- 2013, p. 22) by Konica Minolta.

Vladic et al. (2014) asserted that visual perception is subjective in nature and adding instrument objectifies the measure process.10 Several studies have reported that spectrophotometry is one such technique that has been used successfully in the textile industry [10-13]. Researchers also examined the influence of threedimensional shape on color acuity [14]. They used concave folded card with magenta paper on one side and white on the other side. Illumination of the card with incandescent light on the magenta side reflected pinkish glow on the white side. However, changing the shape from concave to convex form, the perceived color changed from pale pink to magenta. Other group of researchers studied the color appearance for various geometric shapes in both flat and three-dimensional forms [10].
Both visual and instrumental assessments were conducted to evaluate the color of the textile materials. The scholars used several colors (red, blue, orange, violet and green) and plain and satin weaves. Findings revealed that the satin weave was significantly affected when in flat and three- dimensional form for all the colors. In plain weave, differences were significant only for the red color. It was brightest for the flat as opposed to cylinder or cube forms. The previous studies only used flat, cube and cylinder shape. Human body is more complex than previously examined geometric shapes. Therefore, researchers for the study reported in this manuscript created a body form using Makerbot 3D printer. Computer-Aided- Design (CAD) software was used to create the human body form using Poly Lactic Acid (PLA) as the raw material [15]. Another study examined the impact of 3-D printing process on the mechanical properties of PLA samples [16]. The findings revealed that upright orientation showed lowest strength and stiffness . However, they were highest for the flat and on-edge surfaces. They also found that with increase in thickness and feed rate, ductility decreased.
The previous literature also focused on fabric structure. One source reported that woven materials are produced by interlacing warp and weft yarns at right angles [17]. Three basic weaves are plain, twill and satin. All other weaves are variations of these. The three basic weaves are used universally for various textile uses. Therefore, they were selected for the reported study. Another study systematically examined the influence of textile structures on color [18]. They used textile structures in roving, yarn and woven fabric stages to determine relationship between the three stages and reflectance values of color. They found that type of yarn twist does not impact color properties significantly. Another study examined a relationship between color and weave (plain, satin and twill) using different color warp and filling yarns [19]. Their findings indicated that if higher temperatures were used for dyeing, it resulted in lower colorfastness to crocking than lower temperatures. However, colorfastness laundering was not affected. The scholars also indicated that an increase in alkali, salt and dye concentration, the intake of dye percentage also increased. This increase in dye concentration contributed toward reduced colorfastness to crocking.
Literature indicates that cotton fibers can be dyed with azo direct, reactive and vat dyes [20,21]. However, they also stressed that of reactive dyes fixed the color best on cotton. Reaction of the hydroxyl group (Cotton-OH) with reactive chlorine atom (dye-cl) under mild alkaline condition developed a string covalent bond between the dye and the color molecules. Broadbent reported that the process yielded excellent colorfastness as well as strength properties [20]. Burkinshaw noted that use of electrolytes such as salt – NaCl, sodium sulfate – Na2SO4 can expedite the dyeing process [21]. Another study investigated the effect of dyeing parameters for cotton-elastane and lyocell-elastane blends in knit.
Colorfastness is of critical importance while caring for the apparel. Color is vulnerable to changes due to abrasion, exposure to heat and light, laundering, and perspiration [22]. The study examined colorfastness of 50/50 bamboo/cotton, cotton/viscose, and modal/cotton yarns in plain knit with different stitch lengths. They found that bamboo/cotton blend lost color faster than cotton/viscose and modal cotton yarns. They also reported that stitch length impacted color values more after abrasion for 50/50 bamboo/cotton blend than the other two blends.
As evident from the preceding review, either mixed results were reported parameters were tested in a limited manner. Therefore, the study was undertaken to examine color measurement objectively with spectrophotometer for red and green color for three basic weaves in two and three-dimensional forms for various body parts. The following six hypotheses were created from the original eleven to enhance clarity and precision and reduce repetitiveness for the reported investigation.
Hypothesis I: Color values (ΔE) will differ for flat and threedimensional textile for red and green colors.
Hypothesis II: Color values (ΔE) will differ for flat and threedimensional textile under three different lights (incandescent, Fluorescent, and daylight).
Hypothesis III: Color values (ΔE) will differ for flat and threedimensional textile for three different fabric structures (Plain, Twill, and Satin).
Hypothesis IV: Color values (ΔE) will differ for flat and threedimensional textile under for five different body parts.
Hypothesis V: Color measurement values (L*, a*, b*) will not differ for flat and three dimensional forms.
Hypothesis VI: Color values will differ for body parts and fabric structure by color.
Methodology
The experiment used three fabric structures (plain, twill and satin) dyed in red and green colors. Plain weave is coded as 1, Twill weave as 2, and satin weave as 3 in the follow-up discussions. The specimens were tested in both two dimensional and threedimensional forms for their impact on color. Methodology was completed in the following five steps.
1. Development of three-dimensional body form
2. Development of a tunic prototype
3. Fabric dyeing and colorfastness to crocking
4. Data collection for two and three-dimensional forms on color values for three weaves using spectrophotometer
5. Data analysis using Analysis of Variance and 95% level of confidence
Development of three-dimensional body form
A three-dimensional body form was designed that simulated upper torso of the male figure with Tinkercad. Tinkercad is a web browser-based 3-D designing and modelling software. A human body shape was selected from the Tinkercad’s object data base. The file was then submitted to the MakerBot Innovation Center of the university for printing. The dress form was printed with 1.75 mm Polylactic Acid (PLA) filament. The form took 14 hours and 59 minutes to print. The product was neutral in color and had a weight of 167.31 grams. To create the 3-D model, “Fused Deposition Modeling” was used. It is also known as” FDM” additive manufacturing technology. It was used in conjunction with the MakerBot printer.
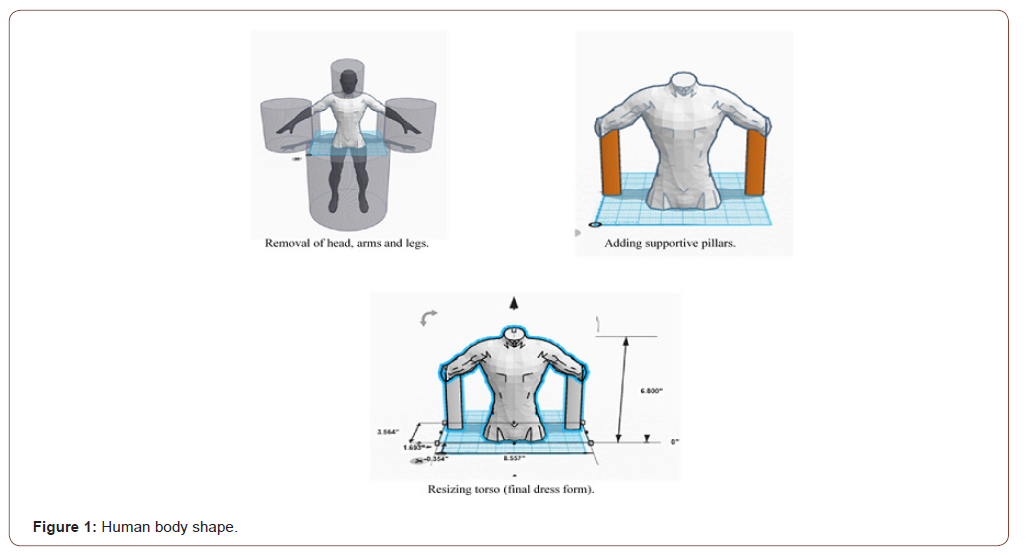
The support pillars were removed after printing as follows. The legs and head were removed from the human body shape using the cylinder hole tool and the arm length were reduced to the elbow utilizing the same tool. The remaining torso was the supported by three pillars. Two supported each arm and one supported the center back. Finally, the model was sized to 6.8” length, 8.577” width, and 3.564” depth. The modeling process is shown in Figure 1. Final dress form was then saved in 3-D object format. This format is compatible for printing using a MakerBot 3D printer. The right arm of the body form was further shortened by quarter of an inch to allow each of donning of the tunic. The finished dress form is shown in Figure 2.

Development of a tunic prototype
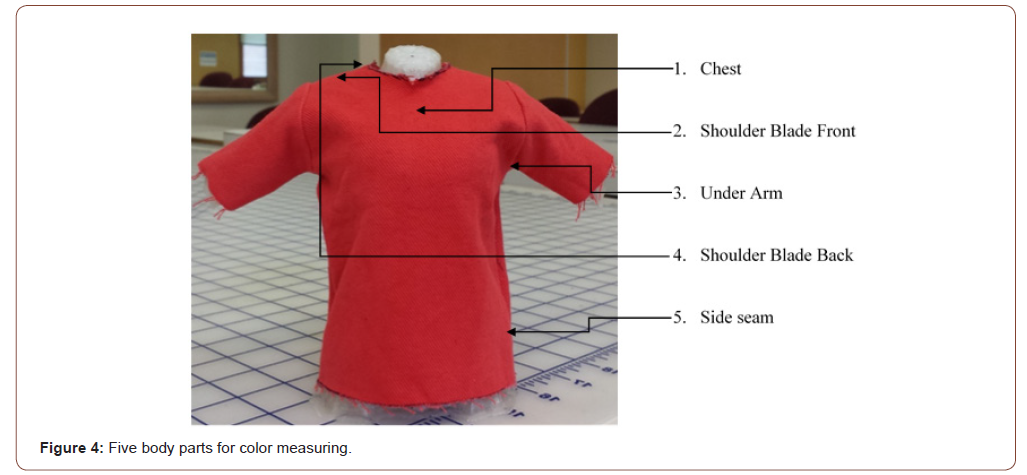
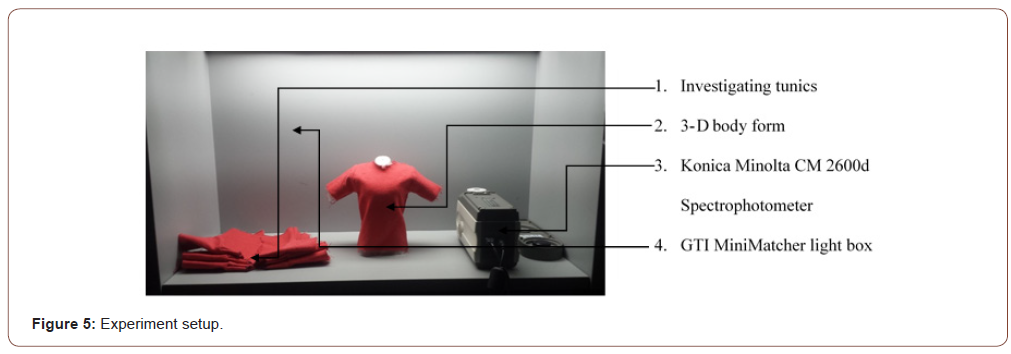
Patterns for the tunic were developed using draping technic and muslin fabric on the finished dress form described in the previous section. Initial pattern measurements were taken and utilized to develop front, back and sleeve patterns. A prototype was made in muslin. Needed alterations were made to fit the tunic on the form. Opening was kept at the back. The final patterns were then drawn using Adobe Illustrator with ½ scale measurements. Figure 3 shows the tunic on the three-dimensional form in plain weave. Same process was used for the other two weaves. Overall, thirty tunics were sewn. Fifteen were made in red and another fifteen in green color. They were made in all three weaves (five for each color). Figure 4 shows five body parts where lite reflection was measured. Figure 5 shows the lightbox with spectrophotometer and dress form donned in red tunic.

Fabric dyeing and colorfastness to crocking
All three weaves were dyed in the same batch to maintain uniform dyeing in red and green colors. All fabrics were acquired from Cotton Incorporated as grey good. They were washed with liquid detergent to remove any dirt, grease or other impurities. One-yard fabric was dyed for each weave in both red and green colors. The during steps used for the study were as follows using industry procedure used by a textile company in Bangladesh.
1. Dye bath was prepared with 3 gallons of water
2. All fabrics were immersed in the dye bath at room temperature with temperature of 70 degrees Fahrenheit for 30 minutes.
3. Dye solution was then prepared in one gallon of boiling water with powdered reactive dye, and salt as electrolyte for enhanced dye penetration.
4. Dyebath was then gradually heated for 10 minutes with electrolyte. Half of the prepared dye solution was added.
5. When temperature reached 80 degrees Celsius, the remaining half of the solution was added, and solution was stirred continually.
6. After 35 minutes fabric was visually inspected for uniform dyeing.
7. The liquid was then drained, and fabric was rinsed for ten minutes with cold water at room temperature.
8. Additional rinsing was done at 70 degrees Celsius.
9. Finally, fabric was washed with liquid detergent until the resulting stock was colorless to demonstrate complete exhaustion of the color.
10. The entire process was repeated for the second color.
AATCC 8-2013 test method was used for colorfastness to dry and wet crocking. The specimens were conditioned following directions from ASTM 1776 prior to testing. Passing values were set as > 4 for dry, and > 3for the wet testing.
Data collection for two and three-dimensional forms on color values for three weaves using spectrophotometer
Color values were measured for all the weaves in two and three-dimensional forms using Konica Minolta CM 2600d Spectrophotometer and its software. The spectrophotometer provides, ΔE as well as L*, a*, b* values for the tested specimens. Figure 5 shows the experimental set-up.
The data were collected in the environmental chamber that controlled the temperature at 70 ∘F-72 ∘F and relative humidity between 63-67%. Chambers lights were turned off. Light from the GTI Mini Master light box provided one of the three lights at the testing time. Konica Minolta’s hand-held CM 2600d model of the Spectrophotometer was used. Specimen for the flat testing was 8”x8” that was placed in the light box in a tension free state. Light was applied uniformly from right angle on to the specimen. The spectrophotometer was then placed at the center of the fabric for the target reading. L*, a*, b* values were recorded using the software. Next, body form donned in red or green tunic in different weaves were measured for five different body parts. Five specimens were used for each condition. The software only provided one ΔE value. Therefore, Connelly’s formula to compute ΔE from the L*, a*, B* values was used.5 ΔE value represents the total color difference between the treated and untreated value using all three dimensions (L*a*b*). A color difference of more than 2 is easily visible to the human eye.
Data analysis using Analysis of Variance and 95% level of confidence
ANOVA was used for various comparisons and confidence level of 95% was established to accept/reject the hypotheses. Linear regression plots were created to visually see the relationships between and among various variables. Visibility of differences based on the ΔE values was interpreted as follows [23].
0 to <1 Not visible to human eye
1-<2 Visible if observed closely
2-3.5 Clearly visible at glance
3.5-<5 Look like different colors
Results and Discussions
Table 1:Characteristic of the patients with AED withdrawal (n=162).

Both descriptive and inferential statistics were used to describe and interpret data. Information on the structural attributes is provided in Table 1. Fiber content was 100% cotton. However, they differed for weight. Plain weave was light weight, twill weave was heavy weight and satin weave was medium weight. Fabric count was highest for plain weave and lowest for twill weave. Fabric thickness pattern was also like the fabric weight.
The study used 2x3x3x5 factorial design. Number 2 of the design represented red and green colors. The first 3 represented three lights (incandescent, fluorescent, and daylight). The second number three indicates plain, twill, and satin weaves as fabric structure. The number five as the last number of the design reflects five body parts (chest, shoulder blade back, shoulder blade front, side seam, and underarm). Results from hypothesis testing are provided below.
Hypothesis I: Color values (ΔE) will differ for flat and threedimensional textile for red and green colors.
Factorial regression results revealed that there was a statistically significant difference between red and green values based on the ΔE values that were much higher for green versus red color (F=14.250, p<.001). Green had a ΔE value of 3.349 for three-dimensional form than red that was 2.840. Hypothesis I was accepted.
Results revealed that green fabrics for all three weaves changed their color when in three-dimensional form more than red colored fabric. None of the previous literature tested color difference in two and three-dimensional body forms for three fabric structures in woven fabrics. Peglar was the only scholar who noted that tints and shades of red work better than green for visual merchandising [24].
Hypothesis II: Color values (ΔE) will differ for flat and threedimensional textile under three different lights (incandescent, fluorescent, and daylight).
Factorial regression results indicated that the average ΔE values differed significantly for three lights (F=4.89, p<.008). Color difference was the highest for the incandescent light (ΔE = 3.375) followed by daylight (ΔE = 3.042) and fluorescent light (ΔE = 2.866). Hypothesis II was accepted.
Pegler is the only scholar who recognized the importance between light and color for interiors and visual merchandising [24]. In visual merchandising, incandescent lights are used for warmth. Fluorescent lights are more effective where silver jewelry is displayed. The finding of the reported study that the green color showed significant differences under different light can be used to improve visual displays and merchandising. The scholar stressed that green light should be avoided on the mannequins and people because it highlights skin imperfections and does not look good on blond and red hair [24].
Hypothesis III: Color values (ΔE) will differ for flat and threedimensional textile for three different fabric structures (Plain, Twill, and Satin).
Factorial regression analysis showed that the ΔE values did not differ significantly for plain, twill and satin weaves (F=0.69, p<.503). All three weaves reflected similar color differences that were large enough to be visible to human eye effortlessly. ΔE value was 3.197 for twill weave, 3.083 for the plain weave, and 3.004 for the satin weave. Hypothesis III was rejected.
This finding is inconsistent with Vladic, et al. [10] who reported that satin weave’s color appearance was significantly impacted by the three-dimensional form. Two-way interactions were used via regression. Results revealed that two colors did not vary for light but did for fabric structures. Differences were significant for twill weave in case of green color. However, those differences were significant for satin weave in red color. Satin weave when interacted with body parts showed significant differences for chest., twill weave for all body parts, and plain weave for all except the shoulder blade back.
Hypothesis IV: Color values (ΔE) will differ for flat and threedimensional textile under for five different body parts. Factorial regression results demonstrated that ΔE values for different body parts differed significantly two and three-dimensional forms (F=88.67, p<.001). Color difference was the highest for the side seams followed by under arm. Differences were very similar for chest and front and back shoulder blade areas. ΔE values for side seam was 5.154 and for the underarm were 4.021. However, for the remaining three measurements, differences were very similar. Hypothesis IV was also rejected.
Two-way interaction with light demonstrated that under daylight, only side seam and under arm showed significant differences. In contrast, differences were significant for all body parts except chest under the fluorescent light. These findings are like two of the previous studies [10,14]. One of the two studies used the geometric shapes like cube and cylinder rather than an apparel item10 and the second study looked at the differences based on the convexity and concavity of the shape or form [14].
Hypothesis V: Color measurement values (L*, a*, b*) will not differ for flat and three-dimensional forms for two colors.
ANOVA (Analysis of Variance) revealed that differences were significant for all body parts for L*a*b* values for green color (Table 2). For red color, differences were not significant for side seam and underarm for L*, side seam for a*, underarm for a* and b*. Null hypothesis was rejected. The results justify that metamerism was justified scientifically.
Table 2:L* a* b* differences for fabric structures by body parts.a
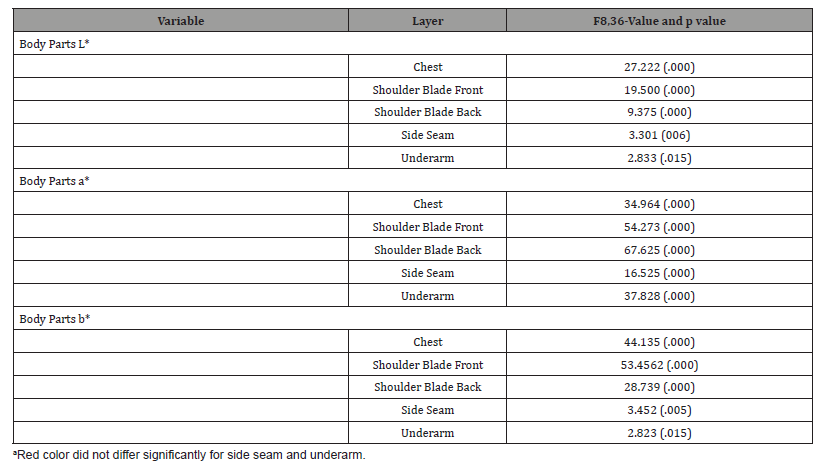
Table 3:Analysis of variance from regression analysis
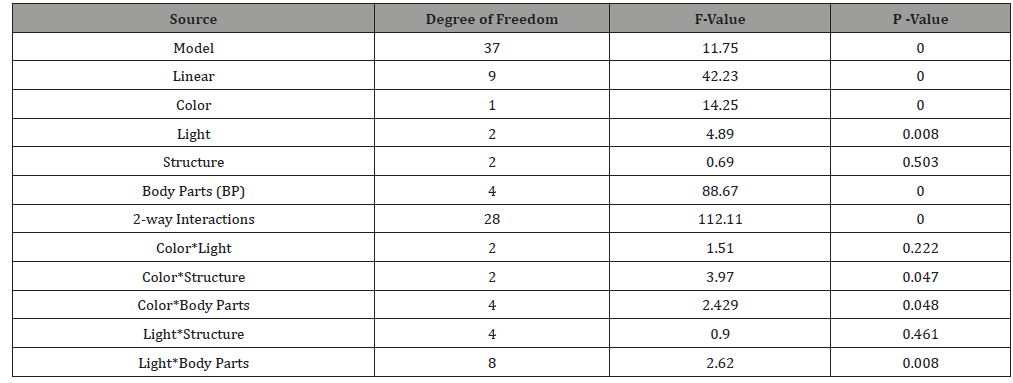
Hypothesis VI: ΔE values are function of color, light, structure and body parts.
ANOVA from regression analysis revealed that model was significant for main effects. Differences were significant for all independent variables except for the fabric structure. Twointeractions revealed that differences were significant between color by structure and body parts; and light by body parts. However, interactions were not significant for color by structure, light by structure, and structure by body parts (Table 3).
Conclusion
The reported study compared several important relationships that were not examined by the previous scholars of color. Specifically, the study also focused on interactions of color with color, light, body parts, and fabric structure. This is a unique contribution of the reported study. Overall, the reported study yielded some new results and reinforced findings from the reviewed literature. Few inconsistencies were also found that could be clarified by additional research. Using three-dimensional tunic was a novel idea and has merit of being used in future. The study used 3-D technology and Modaris software to create body form and paper patterns for it. Tweaking to make the tunic fit was necessary through traditional methods. One of the scholars reported that color also helps with understanding of aesthetic codes that are not clearly defined in the existing literature [25]. Objectified methods used in the reported work can help with reducing ambiguity and offer higher level predicting ability and useful interpretation process.
Implications for Future
The reported study found that receding color green showed differences more than the advancing color red. Other complementary colors should also be examined to determine if one can generalize these findings within the context of advancing and receding colors. The color difference was highest with incandescent light and lowest with the fluorescent light. Impact from the daylight was intermediate. Impact of weaves was also not obvious. This finding has repercussions for visual displays in merchandising also.
For future extension of this work, it will be important to include other structures, fiber contents, and colors. Using fibercontent related dyes to get same degree of saturation could be a challenge. The study can also be extended to female body form that has much more curves in its silhouette than the male form. Making colorfastness to laundering and perspiration will be a useful addition. The reported study is just a beginning in this new direction with implications for textile and apparel industry. Methodology and findings can be used as a springboard to unfold several other aspects of color and its interactions in the apparel product development and promotion. The technology of eye tracking can be used to identify body structures that are consistent with consumers’ focus. Lab testing can also be extended to wear test at full scale in commercial environment in retail and apparel production for comprehensive understanding.
Acknowledgement
None.
Conflict of Interest
Authors declare no conflict of interest.
References
- Davis ML (1996) Visual design in dress. NJ: Prentice Hal, USA.
- Chowdhary U (2009) Textile analysis. Quality control and innovative uses. NY: LINUS.
- Chowdhary U (2018) Lab manual for online FMD 355QR: Textile analysis. NY: LINUS Learning. NY: LINUS.
- Stone E (2008) The dynamics of fashion. NY: Fairchild, USA.
- Connelly RL (2004) Good sample presentation: How to get color measurement results that make sense to color technology in the textile industry, NC: American Association of Textile Chemists and Colorists, pp. 78-83.
- Collier BJ, Tortora PG (2001) Understanding textiles. NJ: Prentice Hall, USA.
- (2019) Celebrate color.
- (2007) Precise color communication. Japan: Konica Minolta.
- Adnan MM (2018) Color Measurement and Colorfastness of Different Weaves and Dimensional Forms. Central Michigan University, USA.
- Vladic G, Novakvic D, Kasikovic N, Avramivic D, Millie N (2014) Color appearance of textile materials applied to various geometric shapes. Textile Research Journal 84(11): 1191-119.
- Gabrijelecic H, Dimittrrovski K (2009) Use of regression methods for determining the relation between theoretical-linear and spectrophotometrical colour values of bicolour woven structures. Society of Dyers and Colourists Coloration Technology 125(2): 74-85.
- Cleve E, Bach E, Schollmeyer E (2000) Using chemometric methods and nir spectrophotometry in the textile industry. Analytica Chimica Acta 420(2): 163-167.
- Vikova M, Vik M (2015) Description of photochromic textile properties in selected color spaces. Textile research Journal 85(6): 609-620.
- Bloj MG, Kersten D, Hurlbert AC (1999) Perception of three-dimensional shape influences color perception through mutual illumination. Nature 402(6764): 877-879.
- Melenka GW, Schofield JS, Dawson MR, Carey JP (2013) Evaluation of dimensional accuracy and material properties of the Makebot 3d desktop printer. Rapid Prototyping Journal 21(5): 618-627.
- Chacón JM, Caminero MA, Garcia-Plaza E, Nunez PJ (2017) Additive manufacturing of PLA structures using fused disposition modelling: Effect of process parameters on mechanical properties and their optimal selection. Materials & Design 124: 143-157.
- Johnson I, Cohen AC, Sarkar AK (2015) Fabric Science. NY: Bloomsbury, USA.
- Moussa A, DuPont D, Steen D, Zeng X (2008) Colour change as a result of textile transformations. Society of Dyers and Colourist, Color Techl 124(4): 234-242.
- Mathur K, Abdel-Fattah Seyam AF (2011) Color and weave relationship in woven fabrics. Advances in Modern Woven Fabrics Technology 7: 129-150.
- Boadbent AD (2001) Basic Principles of Textile Coloration. West Yorkshire, UK: Society of Dyers and Colorists.
- Burkinshaw SM (2016) Physio-chemical Aspects of Textile Coloration. Chichester, West Sussex, UK: Wiley.
- Gun AD, Tibor B (2011) Color, colorfastness, and abrasion properties of 50/50 bamboo/cotton blended knitted fabrics in three different stitch lengths. Textile Research Journal 81(18): 1903-1915.
- Mokrzycki W, Tatol M (2011) Color difference delta E-A survey. Machine Graphics and Vision 20: 383-411.
- Pegler MM (1991) Visual merchandising and display. New York, NY: Fairchild, USA.
- DeLong MR (2020) The way we look. New York, NY: Fairchild, USA.
-
Adnan Mohammed Maruf, Usha Chowdhary. Color Measurement and Colorfastness of Different Weaves and Dimensional Forms. J Textile Sci & Fashion Tech. 8(1): 2021. JTSFT.MS.ID.000676.
-
Color, Weaves, Apparel, 3-D printing, Textile testing, Garment design, Fabric, Spectrophotometer, Fashion merchandising
-

This work is licensed under a Creative Commons Attribution-NonCommercial 4.0 International License.


