 Research Article
Geometry of the Mercator projection from 1569
Gyula Papay, Faculty of Philosophy, University of Rostock, Germany.
Received Date:April 24, 2024; Published Date:May 16, 2024
Abstract
The discovery that Mercator used a special geometric method in the construction of his projection of 1569 opened up the possibility of an exact geometric construction of such a projection, in which the rhumb lines appear rectilinear. The application of this special geometric method, which could be called “planimetric spherics”, does not require the use of either π or trigonometric functions. Its foundations were already implicit in Ptolemaic projection theory. Mercator rediscovered them and developed them further. However, he did not describe his geometric method. As a result, this ingenious and simple method fell into oblivion. This article contains an attempt to reconstruct his method.
Keywords:Mercator map projection; Planimetric geometry; Ptolemy spherical geometry
Introduction
Since the end of the 19th century, numerous solutions have been proposed as to how Gerhard Mercator could have constructed his true-angle projection. Raynhold D’Hollander examined sixteen proposed solutions [1]. His investigation led to the conclusion that none of these proposals could correspond to Mercator’s construction method. Proposed solutions created after 2005 are available from Joaquim Alves Gaspar [2,3] and the author of this article [4-6].
Gaspar’s solution takes up Hermann Wagner’s idea from 1910 of constructing the Mercator projection with the help of rhumb lines. While Wagner used the Mercator globe as a model, Gaspar’s proposal is based on the use of rhumb lines. There are two reasons against this: Firstly, the creation of rhumb line tables was still in its infancy, and secondly, all the evidence that can be substantiated with sources indicates that Mercator created his projection exclusively geometrically. Furthermore, the construction of Mercator’s projection with the aid of mathematically compiled tables was already known at the end of the 16th century. Edward Wright (1561- 1615) did not use the rhumb line tables for this, but secant tables [7].
Krücken first published his construction proposal in 1994 [8]. He recently published a modified version in which he describes his method as a purely geometric construction in which “neither the circle number π nor any mathematical, non-geometric specifications” are required [3]. The problem with this construction method is that although a successive increase in latitude is achieved, these only correspond approximately to the distances of the Mercator projection in the low latitudes. The deviations in the high latitudes are so considerable that no exact geometric construction of the Mercator projection is possible with this method. The author’s previously published proposals [4-6] are preliminary stages of the problem solution and are therefore briefly explained below.
Previously Published Experiments by The Author on The Geometric Construction of The Mercator Projection
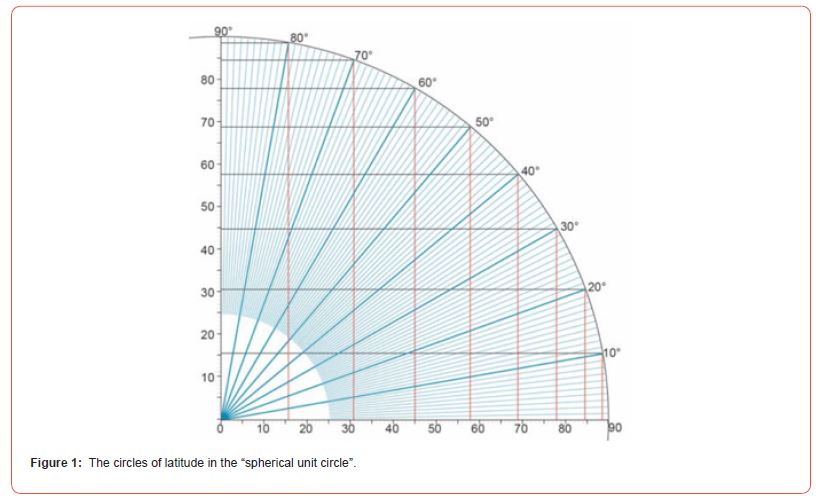
An important basis of knowledge for the experiments was already recognised in the 1990s through investigations into Ptolemy’s projections [9]. At that time it was discovered that Ptolemy used a “transformed great circle” instead of a sphere to determine the geometric basis of his second projection, the circumference of which corresponds to a hemisphere pressed into the surface. The resulting “planimetric sphere”, whose diameter corresponds to half the circumference of the sphere, i.e. 180 units, can also be interpreted as a unit circle in which the radius is divided into 90 parts or units. The “spherical unit circle” also makes it possible to determine such geometric properties of the sphere geometrically, which would otherwise only be possible mathematically using the irrational π. The “spherical unit circle” represents a link between planimetry and spherics. The full potential of this method, which was not explicitly described by Ptolemy, was only discovered decades later. With its help, some previously unexplained aspects of Ptolemy’s projection theory could be explained geometrically [4]. It was then also recognised that this methodological possibility could also be applied to the geometric design of the Mercator projection of 1569 [4]. The realisation that the circles of latitude in the “spherical unit circle” appear as straight lines of equal length was used first (Figure 1).
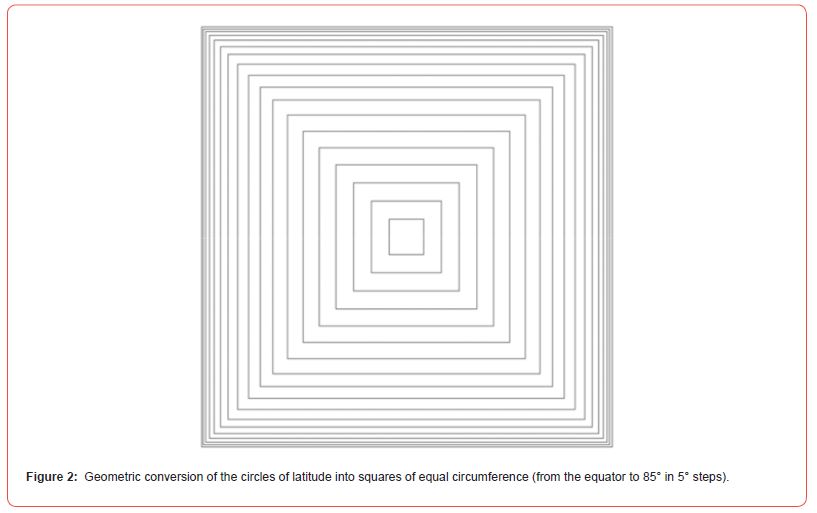
The author has already published two methods for the geometric construction of the Mercator projection. The first method [10,11] is based on a remark by Mercator that the geometric construction of his projection, which dispenses with both the use of π and any trigonometric function, was associated with the squaring of the circle. The “spherical unit circle” makes it possible to convert the circles of latitude into squares whose circumference corresponds to the circles of latitude of the sphere (Figure 2).
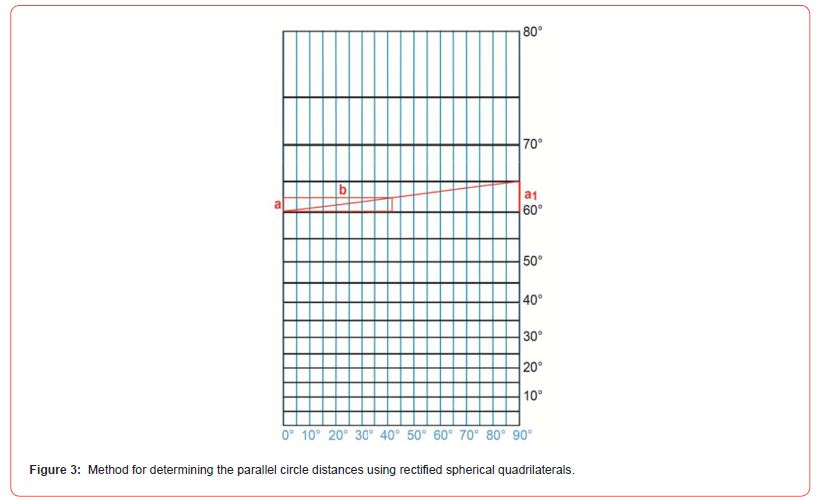
It is also possible to transform spherical quadrilaterals, which are bounded by two circles of latitude and two circles of longitude, into plane geometry in such a way that the side lines form straight lines of equal length. This transformation can be carried out using the “spherical unit circle” without the use of π and trigonometric functions. The rectified spherical quadrilaterals were transformed into rectangles as follows. The length of the lower parallel circle and the length of the upper parallel circle are connected and divided into two equal parts. These parts form the upper and lower boundary lines of the rectangles. By scaling the rectangles to the length of the equator, the parallel circle distances of the Mercator projection are obtained (Figure 3).
The blue lines in Figure 3 represent the meridians in the Mercator projection. The red rectangle shows the rectified spherical quadrilateral between 60° and 65° before scaling. The side length of the rectified quadrilateral labelled “a” is 5 degrees, i.e. 5 units. By increasing the side labelled “b” to 90 units, the distance between the parallel circles of 60° and 65° labelled “a1” is determined.
Another method [5,6] consisted of converting the circles of latitude, which had been transformed into straight lines of true length with the aid of the “spherical unit circle”, into rectangles in such a way that the graphic width of this line is increased to one degree width. When these rectangles are enlarged to the length of the equator, the widths of the rectangles also change (Figure 4).

The blue line in Figure 3 is an example of the 70th parallel circle. This circle of latitude is converted into a rectangle whose width corresponds to one degree. This rectangle, shown in red, is then enlarged so that its length (a) is extended to a quarter of the length of the equator, i.e. 90 units. In this way, the 70th parallel circle is given a graphic width (b) that corresponds to the distance ratio. The graphic widths of the enlarged rectangles thus serve as the basis for creating the map network.
This geometric method can also be used to mathematically determine the graphic widths of the individual circles of latitude. The length of the latitude circles is calculated using the formula U=2ð*r*cos(ö). If the “spherical unit circle” is used, the radius does not need to be included in the calculation. The formula is then: U=90*cos(φ) or a=90*cos(φ). The length of “a” relates to 90° like 1° to the length of “b”. Therefore, the length of “b” is calculated using the following formula: b=90/90*cos(φ) or b=90*sec(φ).
Theoretical Basis of The Correct Method for The Geometric Construction of The Mercator Projection
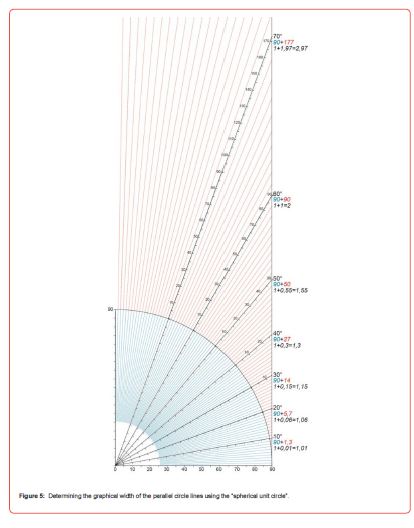
Using the methods described above, it is possible to construct the Mercator projection exclusively geometrically. The only problem is that the cumulative superposition of the usually very small distances makes the method prone to errors. For this reason, further research was carried out into the question of whether the accuracy of the construction methods could be increased. During the research, a further geometric property of the “spherical unit circle” was recognised, which makes it possible to determine the enlarged graphic widths of the individual parallel circle lines with a high degree of accuracy. This previously unrecognised geometric relationship is illustrated in (Figure 5).
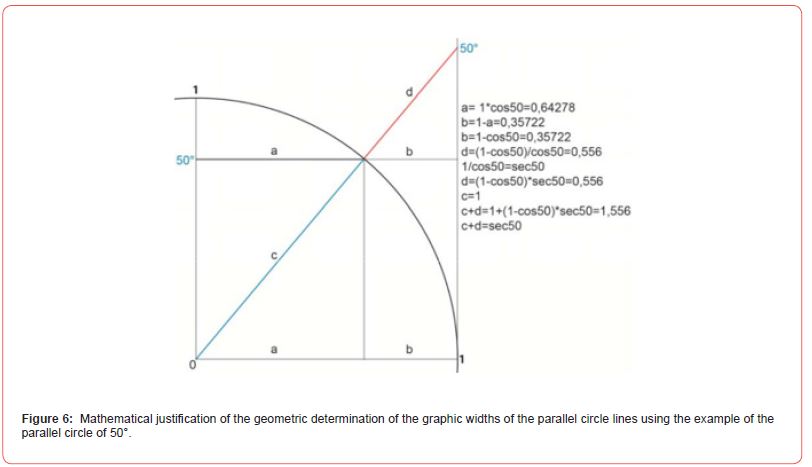
The blue graduation shown in Figure 1 has been extended to the tangent of the “spherical unit circle” (Figure 5). The extensions are marked by red lines. They represent the extent to which the degree lines are to be extended to construct the Mercator projection. The black numbers below represent the reference to the unit circle with radius 1. The geometric construction described here can also be justified mathematically (Figure 6).
The trigonometric relations in the “spherical unit circle” correspond to the trigonometric relations in the unit circle, in which the radius is only one unit instead of 90 units.
The distance “a” corresponds to the parallel circle of 50° in Fig. 5. Its quarter length is equal to the cosine of 50°. The length of the distance “b” can be determined by simple subtraction. As “b” divided by “d” is equal to the cosine of 50°, the length of “d” is obtained by multiplying “b” by the reciprocal of cos50. As the reciprocal value of cos50 is equal to the secant value of 50°, the length of “d” is equal to the multiplication of “b” by the secant value of 50°. As “a” + “b” is equal to 1, “c” + “d” is equal to the secant value for each degree.
Practical Implementation of The Theoretical Findings Presented Here In the Construction Of The Mercator Projection
The one-degree graduation (Figures 5 and 6) clearly explains the theoretical principles of the geometric construction of the Mercator projection. However, the practical realisation is considerably simplified if the half degree division is used instead of the one-degree division. This allows the parallel distances to be determined directly.
Step-by-step explanation of the construction:
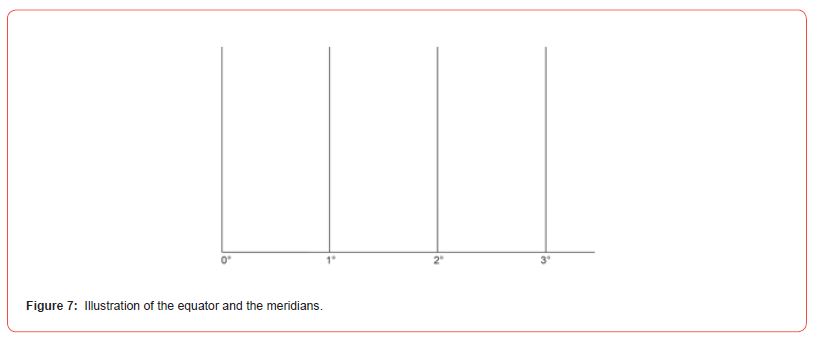
Step 1: Illustration of the equator and the meridians. The distance between the meridians determines the scale (Figure 7).
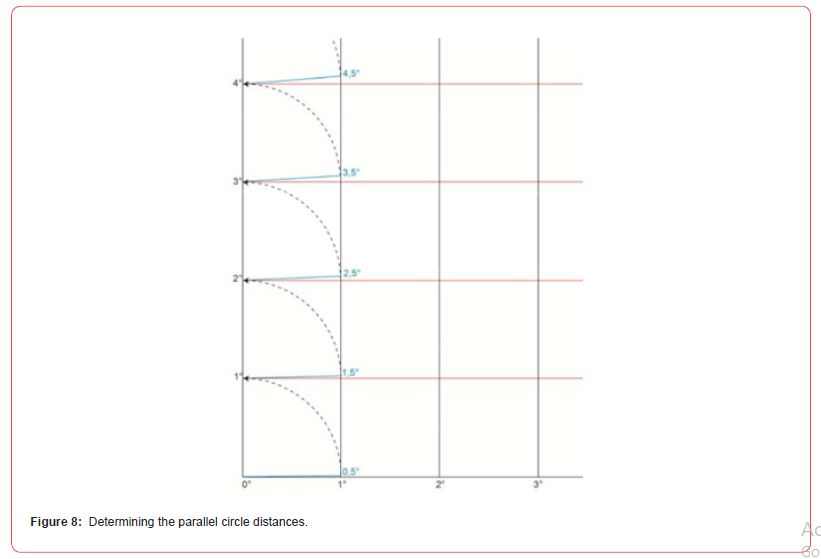
Step 2: Draw a straight line of 0.5° to the second meridian. Use the compass to transfer this straight line to the first meridian. The point of intersection determines the distance of the parallel circle of 1° from the equator. This process is then repeated successively (Figures 8,9).
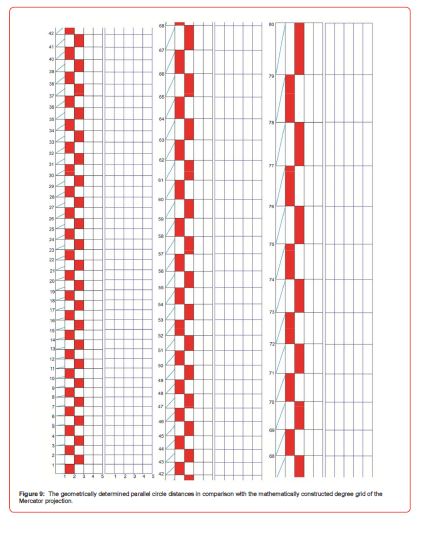
Figure 9 demonstrates the result of the geometric construction in comparison with the mathematically calculated degree grid. a mathematically constructed map grid of the Mercator projection 2. The black grid in Fig. 9 on the left was determined geometrically, the grid on the right was calculated mathematically. The blue lines show the degree lines at intervals of half a degree. The height of the red bars corresponds to the length of the blue degree lines.
Conclusion
In this article it was shown that Gerhard Mercator’s projection of 1569 can be constructed geometrically with high accuracy without using π and without recourse to trigonometric functions. This was made possible by a special geometric method that could be described as “planimetric spherics”. Mercator discovered this method when he was intensively studying Ptolemy’s theory of projection and developed it further. As neither Ptolemy nor Mercator described this method, it remained undiscovered. Its rediscovery cannot be limited to its historical significance, as it represents a contribution to theoretical cartography and also to applied geometry.
Acknowledgement
Special thanks are due to Frank Dickmann, Kurt Guckelsberger, Joachim Neumann, Peter Mesenburg and Alfred Stückelberger for the criticism and suggestions I received during the many years of research, the results of which are presented here.
Conflict of Interest
None.
References
- D'Hollander R (2005) Loxodromie et projection de Mercator. Institut océanographique, Paris, Monaco.
- Gaspar JA (2014) Squaring the circle: rhumbs, globes and the making of the mercator projection (1569). How Mercator constructed his projection in 1569 Imago Mundi 66: 1-24.
- Krücken FW (2023) Von Marinus zu Mercator. Die didaktische Analyse des Hauptsatzes der Begrüßungslegende der Mercator-Karte AUN (Ad Usum Navigantium) von 1569 und ihre methodische Umsetzung. In: Ad maiorem Gerardi Mercatoris gloriam: Abhandlungen zum Leben und Werk Gerhard Mercators; Band pp: 52-56.
- Pápay G (2022a) Ptolemy's methodological principles in the creation of his map projections. KN
- Pápay G (2023a) Mercator's method of constructing his conformal projection in 1569.
- Pápay G (2023b) Konstruktionsmethoden der Kartennetzentwürfe von Etzlaub (1511) und von.
- Wright E (1599) Certain errors in navigation detected and corrected. London.
- Krücken FW (1994) Wissenschaftsgeschichtliche und - theoretische Überlegungen zur Entstehung der Mercator-Weltkarte 1569 ad usum navigantium. Duisburger Forschungen 41: 1-92.
- Pápay G (1994) Die Entwicklung der Kartennetzentwürfe in der Antike aus wissenschaftstheoretischen Sicht. In: Scharfe W (ed.) Vorträge und Berichte Kartographiehistorisches Colloquium Berlin pp: 101-108.
- Pápay G (2022b) Mercator's Geometric Method for Construction of his Projection from 1569.
- Ghim W (1595) Vita celeberrimi clarissimique viri Gerardi Mercatoris Rupelmundani a domino Gualtero Ghymmio, patricio Teutoburgensi ac eiusdem oppidi antiqussimi praetore dignissimo, conscripta. Atlas sive cosmographicae meditationes de fabrica mundi et fabricati figura, Duisburg.
-
Gyula Papay*. Geometry of the Mercator projection from 1569. Iris On Journ of Sci. 1(2): 2024. IOJS.MS.ID.000510.
-
Mercator's projection, Geometric construction, Ptolemy's projection, Cartography, Planimetric spherics, Trigonometric functions
-

This work is licensed under a Creative Commons Attribution-NonCommercial 4.0 International License.
- Abstract
- Introduction
- Previously Published Experiments by The Author on The Geometric Construction of The Mercator Projection
- Theoretical Basis of The Correct Method for The Geometric Construction of The Mercator Projection
- Practical Implementation of The Theoretical Findings Presented Here In the Construction Of The Mercator Projection
- Conclusion
- Acknowledgement
- Conflict of Interest
- References


