


 Research Article
Nexus of Economic Growth and Levels of Education in Algeria: An Empirical Study Using the Principal Component Analysis (PCA)
Received Date: May 25, 2023; Published Date: June 14, 2023
Abstract
The general objective of this paper is to assess the contribution of the different levels education for economic growth in Algeria during the period 1980-2022. To do this, we first rely on a so-called endogenous growth model: the Solow model “Augmented” by the human capital developed by Mankiw, Romer and Weil (1992). Then, we use the assessments of [5] which generate the average number of years of study of the economically active population for the different levels of education. And finally, we build from the Principal Component Analysis (PCA), an indicator composite of human capital to integrate aspects of our empirical model qualitative education alongside the quantitative proxy that is the average number of years of study indeed, our estimates reveal that only the level of primary education has an effect significant in addition, taking into account the quality of education improves our results and allows to assess at 24% the contribution of the primary level to Algerian economic growth.
JEL classification:E13; I21; O40
Keywords: Stock of education; PCA; Economic growth; Algeria
Introduction
Education has become a major issue in today’s economies because it is recognized that it constitutes an effective means to amplify economic growth through training, the creation of new skills, know-how and skills. Indeed, the fight against poverty, the increase in productivity and individual income and then that of the economy of a country go through the implementation of effective education systems [10]. This is why, we see that in recent decades, the educational policy has taken off in all countries of the world and particularly in sub-Saharan Africa (Sow, 2013). Moreover, it emerges from the 2011 edition of the Education For All Global Monitoring Report (EFA) that education spending has increased (in% of GDP), rising from 2.9 in 1999 to 3.8 in 2011 in low-income countries. Particularly in Algeria in recent years have been marked by a greater allo cation of resources to education policies in order to achieve the objective of universal schooling through primary education for all by 2015. Total public expenditure in the education sector (in% of GDP) rose from 2.11 to 4.90 over a period from 1970 to 20122. This has resulted in a considerable increase in demand for education with high enrollment rates at all levels and more education important with establishment with establishments at all levels of education. At the same time, the country’s economic situation has improved steadily from 2007 to the present day. Indeed, in 2007 the growth rate of the gross domestic product, which was only 2.3% rose to 5.6% in 2012 thus characterizing a period of economic recovery. So, the statistics mentioned so far show us clearly that in Algeria, the envelope of the national budget allocated to education on the one hand and the evolution of the growth of the GDP on the oth- er hand, visibly display a joint increase during these last years. So, starting from the assumption that a country’s investments must be directed towards the most profitable sectors in terms of economic and social development, we want to quantify the contribution of different levels of education to economic growth in Algeria based on an endogenous growth model.
Literature Review
This section presents the literature review on the relationship between education and growth, drawing mainly on quantitative and qualitative analyzes of this relationship. Indeed, the idea that education contributes to growth is both the origin and the outcome of the theory of human capital whose founders are Schultz (1961), Mincer (1964) [6]. For these theorists, education accounts for most of total productivity factors, and since the early 1980s there have been many studies tend to confirm this positive role of growth education. We let’s first talk about the results of the classics of this literature, [4] Mankiw, Romer and Weil (1992). In cross section on a hundred countries (including those of the OECD), these measure the effect of education on growth in GDP per capita between 1960 and 1985. The authors measure education by gross enrollment rates. But Barro distinguishes education primary and secondary while Mankiw, Romer and Weil use an average over the period of the gross secondary education rate compared to the population active. Both result in a positive and significant effect of education on growth. African Integration and Development Review Volume 8, 2015 educational levels and economic growth in Algeria 4. In this continuity, Mauro (2000) studies the effect of education in terms of stock on the development of Italian regions over the past thirty years. By testing different models, including those of Islam (1995) and Barro and al. (1997), and by neutralizing unemployment rates and work experience accumulated, Mauro observes a positive and significant relationship between education and long-term growth. These conclusions are shared by Sow, A. (2013) who indirectly tests the effect and the effectiveness of education on the productivity of Senegalese companies. The result of this test found that education has a positive effect on Senegal’s economic growth, through the positive impact of the levels studies of the manager and the employee on productivity. This result corroborates with those of [8], who, considering a panel of 19 countries from Sub-Saharan Africa through the approach of borders, find a positive impact of the overall stock of human capital on the growth of the productivity. In a study, Quenum (2011) which, using the so-called growth models endogenous and data from all eight (08) WAEMU countries on the period 1970 - 2005, arrives at estimates which show that for the countries poor, primary education has a positive effect on growth, while the secondary and tertiary have no significant effect with sometimes even negative coefficients. Indeed, it is recognized that these are the problems of quality of education or human capital skill area which may explain these unexpected effects. For our part, it remains to analyze the specific case of Algeria using the available data in order to be able to grasp the depth of the economic reality of this country in relation to the contribution of education to its growth. The various works mentioned are not exhaustive, because many others research like that of Psacharopoulos and Patrinos (2002), Foko and Brossard (2007) and Nomenyo (2011) confirm the positive effect of education on Economic Growth. However, by the early 1990s, optimism about the positive role of education in economic growth has blunted a little with results of other studies. [7] ask the question next: How is the education level of the affected workforce the production and growth of an economy? Indeed, they could not find the positive relationship described by Mankiw et al. (1992) between capital human and economic growth using the standard approach (that of Mankiw Romer and Weil) which involves processing human capital, measured through the average number of years of labor force study as a factor African Integration and Development Review Volume 8, 2015 Educational levels and economic growth in Algeria ordinary production. [7] who were the first authors question the role of education in economic growth, propose an alternative approach associated with the theory of growth endogenous, which consists of modeling technological progress, or the growth of overall factor productivity as a level production function education or human capital the maximum controversy will come from the empirical studies of Prtichett (2001). He uses the stock data collected by Barro and Lee (1993), de Nehru et al, (1995) and Psacharopoulos (1993) on a large number of countries (91 in total) and over a period from 1960 to 1987. The dependent variable being the rate of GDP growth per worker from the “Penn World Table 1” database, the the results of the estimates are quite surprising. Estimating the impact of the growth of educational capital on the growth rate of income per worker is negative and not significant. A similar result is found when the study is applied to the MENA3 region in cross section. These results deemed “binding” led him to wonder: where did education go? So, for Pritchett (2001), this weak or sometimes non-existent link can be explained essentially by three factors: first, education does not increase capital human but increases private wages, and marginal returns to education is declining rapidly (Psacharopoulos and Patrinos, 2004). Then, the prevailing institutional environment in many countries does not favor the accumulation of human capital already concentrated in annuity activities which stifle economic growth. Finally, the quality of education can be so weak that it lacks the skills required to achieve a economic growth. In the same vein, Islam (1995) implements more complex panel methods. He considers an intermediate form in which human capital is measured directly in stock while capita physics is introduced through the investment rate. The results of this suggest that reversing conclusions is less the result of change of model (equilibrium method versus production function) only taking into account fixed effects by the second generation of estimates. The results of this estimate are close to those of Pritchett, since we led to assume a negative relationship of growth education and in a significant way. So, when the most robust econometric methods are used, it becomes impossible to show a positive relationship between capitals.
Against this backdrop, we examine the impact of remittances on economic growth in Cameroon by bringing out the pronounced positive effect of remittances on economic growth as compared to other external sources of capital. To this end, we employed an econometric procedure as the recently ARDL bounds testing approach which heavily relies on Multivariate Cointegration within an error correction model (ECM) to establish both the short- and longrun relationships between inflows of remittances, and other external inflows in the form of foreign aid, foreign direct investment and openness to trade on economic growth for the period 1960 to 2014.
Methodology
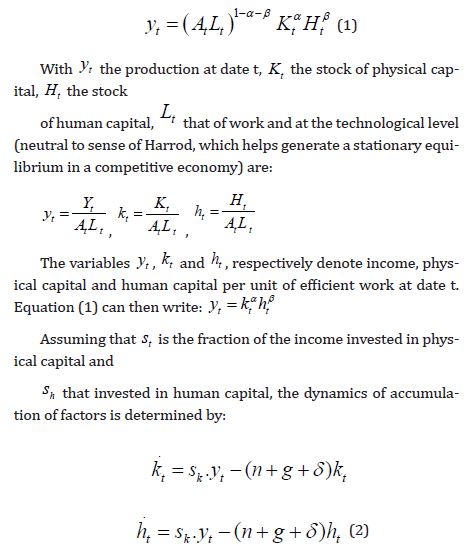
The reference model is inspired by that of Solow increased by human capital developed by Mankiw, Romer and Weil (1992). Indeed, we present first the functional form of the model and the main stages leading to the empirical model, before secondly specifying the model that we used for our empirical analyzes. From a function of Cobb-Douglas type production, the model is as follows.
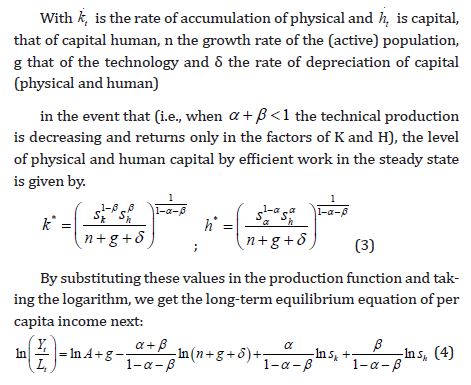
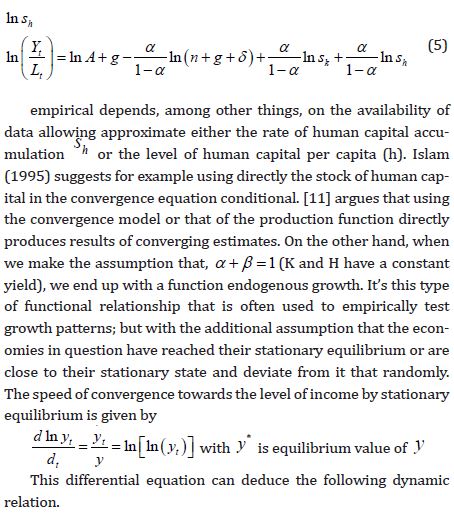
This equation shows how per capita income depends negatively on population growth rate and positively the accumulation of physical and human capital. Another way to reveal the role of human capital is to express the previous equation (4) as a function of the level of stationary state human capital.
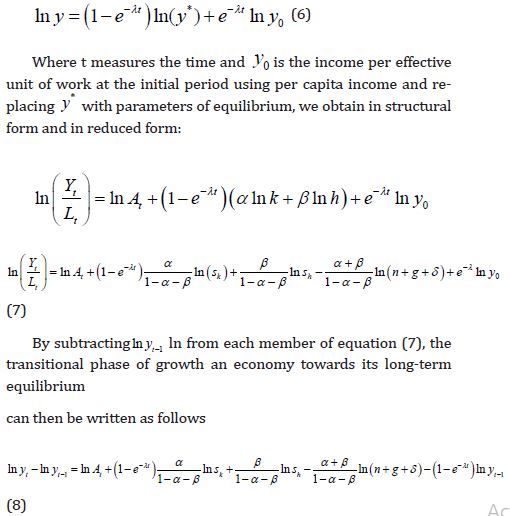
To assess the contribution of human capital to growth, this latter specification (8) has the advantage of not requiring that the economy studied be on their balanced growth path. The growth rate of GDP per capita therefore depends here on the initial position of the economy (convergence effect) and on the variables defining the long-term equilibrium towards which it converges. According to this relation (8), the rate of growth of GDP per capita is also a function of the rate of investment in physical capital, the sum of the rate of population growth, the rate of depreciation of physical capital and the rate growth of technical progress. Long-term income is also function of human capital.
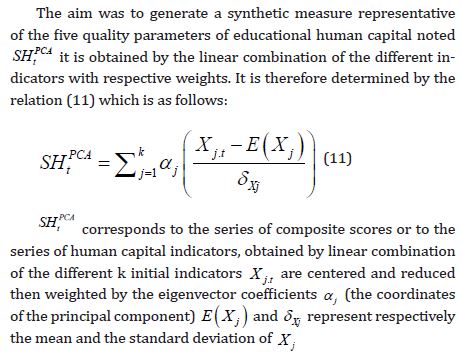
In our work, we were inspired by the endogenous growth model of Solow, presented above to define that of our analysis. Indeed, we specify a model with two (2) equations: the first (9) takes into account the stock of global human capital while the second (10) separately integrates the different stocks of human capital by level of education. In addition, we have chosen to integrate the qualitative aspects of human capital (Boccanfuso, D., Savard, L. and Savy, B., 2009). To do this, we carried out a Principal Component Analysis (PCA) based on different qualitative indicators such as: the pupil per teacher ratio, public education expenditure, public expenditure per pupil, etc. in order to determine a composite indicator of human capital SHPCAwhich once constructed, will be introduced into each of the equations alongside the usual proxy of the stock of human capital, the average number of years of study that does not appreciate than the quantitative aspect. So, the equations are as follows:
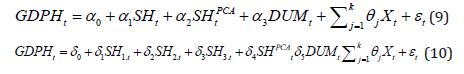
From equation (9) to equation (10) and from left to right, are labeled: GDPH: GDP per capita, this is the explanatory variable of the model.
Data Of Study
For more than two decades, the Algerian education system has experienced enormous difficulties arising from the socio-political crises of the 1990s which led to the suspension of international cooperation. The suspension of aid has had the effect of weakening the state’s institutional capacity, hampering the provision of education services and eroding the quality of basic public infrastructure. Nevertheless, despite this unfavorable macroeconomic context, the Government has always endeavored to guarantee budgetary arbitrations favorable to the education sector. At the beginning of the 2000s, the country embarked on an effort to analyze, modernize and restructure its education system by placing its action within the framework of achieving the objectives of the Dakar World Forum (2000) as well as objectives adopted by the United Nations Millennium Declaration (MDG, 2000).
This is how the Algerian education system was the subject of a first sectoral diagnosis in 2002. Improved updates of this first version were carried out in 2007. On the basis of this analytical work, and thanks to the political stability regained and upon the return of cooperation with its main donors in 2008, Algeria adopted in 2009, a letter of declaration of sectoral education policy defining new directions and options for government policy, particularly in the areas of access to school, quality of learning, piloting and management of the system. The process of preparing and implementing the national strategy for the education sector therefore took place in a context that had become much more favorable thanks to a return to economic growth, a substantial reduction in public debt as well as ‘’ resumption of dialogue with the main donors (PSE, 2014) .In these conditions, the analyzes show a positive and significant change in school coverage throughout the education system, a sign that quantitative progress has been made during in recent years in terms of education. Indeed, between 2018 and 2019 primary, middle and secondary between 2018 and 2019 (Table 1). These data rank above the average for countries with a comparable level of economic development. With regard to the education sector, the State gives it priority budgetary. Indeed, the increase in total public resources has led to an increase in public spending on the education sector.
Table 1: The main aggregates for the 2018-2019 school year.

Results and Discussion
Main results of the Principal Component Analysis (PCA)
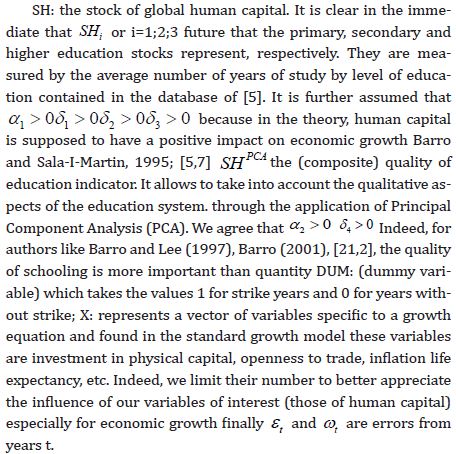
Principal component analysis is a descriptive technique multidimensional to study the relationships between quantitative variables without a priori considering any structure, no variables or individuals. So, it’s a mathematical method of analysis data which consists in looking for the directions of the space which represents the the better the correlations between n random variables. Whatever the matrix of correlation, there is always a PCA solution that maximizes the variance explained (Kouani et al., 2007; Duquenne, 2012). She permits also to synthesize a dataset by identifying redundancy in this one. this method is used in this study to build a synthetic indicator of human capital based on five variables quantitative: the pupil- ratio in primary education (PPEE), -expenditure education in% of GDP per capita (EEP), the number of teachers trained for primary compared to total teachers (NTP), expenditure per pupil in primary education (EPPE) and finally public expenditure per pupil in secondary (PEPS) we use MINITAB and SPSS to generate the main components (Figure 1).

Tests validating the use of PCA
We can use the size of the eigenvalue to determine the number of principal components. Retain the principal components with the largest eigenvalues., using the Kaiser criterion, you use only the principal components with eigenvalues that are greater than 1. To visually compare the size of the eigenvalues, use the scree plot. The scree plot can help you determine the number of components based on the size of the eigenvalues (Figure 2). In these results, the first two principal components have eigenvalues greater than 1. These two components explain91.6% of the variation in the data. The scree plot shows that the eigenvalues start to form a straight line after the second principal component. If 91.6% is an adequate amount of variation explained in the data, then you should use the first three principal components.
Proportion
a principal component with a proportion of 0.717 explains71.7 % of the variability in the data. Therefore, this component is important to include. Another component has a proportion of 0.001, and thus explains only 0.1 % of the variability in the data. This component may not be important enough to include. In these results, the score for the first principal component can be calculated from the standardized data using the coefficients listed under PC1 (Figure 3).


PC1=0.411PPEE+0.343EEP-0.472NTP+ 0.518EPPE-0.471PEPS
In this loading plot: the pupil- ratio in primary education (PPEE), -expenditure education in% of GDP per capita (EEP), the number of teachers expenditure per pupil in primary education (EPPE) have large positive loadings on component 1, so this component primarily measures applicant’. the number of teachers trained for primary compared to total teachers (NTP) and public expenditure per pupil in secondary (PEPS), have large negative loadings on component 2.
Conclusion
In this study, we applied the Kaiser criterion to determine the number of components to extract. Indeed, according to Kaiser (1960), the extraction of the components must therefore stop as soon as an eigenvalue becomes less than 1. On this basis, we have extracted two main components. In fact, the algorithm used in PCA makes sure to maximize the variance explained by the first component. We therefore succeeded in reducing the data of 5 variables to two permanent components while succeeding in reporting more than70.14% of the initial variance. Consequently, the percentages of inertia are 65.24 % for axis 1 (horizontal axis) and 18.34 % for axis 2 (vertical axis). Thus, the analysis of the component of the eigenvector exposed in the following table clearly indicates that the variables are positively correlated with each of the components. So, she would represent them all pretty much the same way.
Acknowledgement
None.
Conflict of Interest
No conflict of interest.
References
-

This work is licensed under a Creative Commons Attribution-NonCommercial 4.0 International License.


