


 Research Article
Fiscal Rules in A Context of New Consensus Macroeconomics and Economic Crisis: Lessons from Brazil and Spain
Received Date: May 09, 2023; Published Date: May 24, 2023
Abstract
In this article we compare the economic performance of public finances in Brazil and Spain, which applied economic policies based on the New Consensus Macroeconomics (NCM). After reviewing some considerations of the NCM and Stability Growth Pact theoretical bases, we have compared the Brazilian and the Spanish macroeconomic policies and their results during the 2000s years. Finally, we have conducted a simulation exercise to investigate to which extent the use of explicit fiscal rules would have improved the macroeconomic performance in Brazil and Spain. We conclude that the more flexible performance of fiscal policies in Brazil seems to have been more successful than that of the stricter European fiscal requirements that guide the Spanish fiscal results.
Keywords:Macroeconomic policies; Fiscal rules; Economic crisis; Brazil; Spain
Introduction
Since the 1990s the globalization process (that is, the increased international mobility of trade and, mainly due to the financial liberalization, capital) and the conventional economic wisdom, based on the New Consensus Macroeconomics (NCM) framework (linked to the Inflation Targeting Regime (ITR), fiscal surplus regime, and flexible exchange rate regime), the world economy has faced several economic crises. Among these crises should be noticed the Mexican peso crisis in 1994-1995, the Asian crisis in 1997, the Brazilian crisis in 1998–1999, the Argentinean crisis in 2001-2002, the 2007-2008 international financial crisis (IFC) and, as a result, the 2009 Great Recession (GR)1 and the Euro crisis in 2011-2012. The effects of these crises were not neutral in economic and social terms. Moreover, focusing attention on the IFC and, as consequence, the GR, it is possible to observe that both crises have substantially altered the dynamic process of the international economy and represent a major turning point. Governments of both the G7 countries and the emerging countries have responded to the IFC and GR with massive countercyclical fiscal and monetary policies.
As is well known, in The General Theory of Employment, Interest and Money [1], hereafter GT, shows that in monetary economics, fluctuations in effective demand and level of employment occur because, in a world where the future is uncertain and unknown, economic agents prefer to withdraw currency, and consequently their decisions to spend, whether on consumption or investment, are postponed. In other words, agents withhold currency as a kind of safeguard against the uncertainty entailed by their precarious knowledge about expected yields from their production plans. This situation occurred during the IFC and the GR and, for this reason, Keynesian macroeconomic policies, in both conception and practice, were implemented to aim at recovering levels of effective demand for the purpose of mitigating the impacts of both crises.
Moreover, for that purpose, Keynesian macroeconomic policy should be coordinated in such a way as
(1) To operationalize fiscal policies designed to expand effective demand and reduce social inequalities,
(2) To make for more flexible monetary policy so as to galvanize levels of consumption and investment, and
(3) To coordinate and regulate financial and foreign-exchange markets in order to stabilize capital flows and exchange rates. In short, following [2], there is a need for state intervention and regulation through Big Government and Big Bank.
Given that, the purpose of this article is to analyze the macroeconomic policies, more specifically the fiscal policy, and the economic performances of Brazil and Spain, from 1999 to 2019. Why these countries? We choose Brazil and Spain for two reasons: first, because, despite both countries have adopted a similar macroeconomic model in 1999 (that is, the NMC model in Brazil and the Stability Growth Pact (SGP) in Spain), the Brazilian and Spanish economies presented different results in terms of GDP growth and unemployment rates;2 and second, due to Brazilian and Spanish economies have similar structures and the trade relationships, in the 2000s, between both countries became relevant.
In the article, we argue that the different economic performances of the Brazilian and the Spanish economics in 2000s are due to how macroeconomic policies, mainly fiscal policy, were managed in Brazil and in Spain, given the theoretical underpinning of the NCM and SGP.
To aim its goal, this paper, besides this brief Introduction, has five more sections. Section 2 presents, briefly, some considerations of the NCM and SGP in the context of the Brazilian and Spanish economies. Sections 3 and 4 analyze, respectively, the Brazilian and the Spanish macroeconomic policies and their results during the 2000s years. Section 5 shows and compares the performance of fiscal rules and the policy responses of Brazil and Spain during and after the IFC and the GR. Finally, section 6 summarizes and concludes.
The NCM and the SGP: Brief Considerations
The experience of the NCM in the Brazilian economy: theoretical underpinning and performance
As is well known, the NMC model emerged in the beginning of the 1990s, and, since then, has become highly influential in terms of both macroeconomic thinking and macroeconomic, especially monetary, policy. The basic NMC model is characterized by three equations: the IS equation representing the demand side; the Phillips Curve equation representing the supply side; and the monetary policy rule equation [3]. In Brazil, since 1999, the NCM model has been adopted by the Brazilian’s Economic Authorities (EAs) as follows: a monetary rule based on the ITR,3 a target for primary fiscal budget as share of GDP4 and a floating exchange rate regime. According to Arestis, Ferrari-Filho and Paula (2011), the theoretical framework of the NCM, adopted by the Brazilian’s EAs, can be summarized as follows:
1. Price stability is monetary policy’s long-term primary objective. In addition, the price stability goal may be accompanied by output stabilization so long as price stability is not violated. In this this approach, “expected inflation” and the transparency of inflation forecasts are important elements of the policy. Thus, it means that monetary policy is the main instrument of macroeconomic policy, and it should be operated by an independent central bank;5.
2. Fiscal policy is no longer viewed as a powerful macroeconomic instrument for stabilizing the economy. Hence, the EAs should adopt a fiscal target in terms of primary budget surplus.
3. Given that, the monetary and fiscal rules, the level of economic activity fluctuates around a supply-side equilibrium. This means that the level of effective demand does not play an independent role in the long-run level of economic activity.
4. A flexible exchange rate has a crucial importance, that is, it keeps the balance of payments in equilibrium.
Foot Notes
1. It is important to mention that the IFC occurred after a period of prosperity in the world economy running from 2003 to 2007. According to the International Monetary Fund (IMF, 2020) data, the growth rates in 2009 of the United States, the Euro Area and Japan were, respectively, -2.4%, -4.0% and -5.1%. Moreover, according to the World Trade Organization (WTO, 2020) data the volume of world trade shrank 12.0% in 2009.
2. Based on Tables 1 and 2, it is possible to observe that, from 1999 to 2019, the annual average economic growth rates of Brazil and Spain were, respectively, 2.3% and 2.9%, while, in the same period, the unemployment rates of Brazil and Spain presented the following results: in Brazil, it increased in the period 1999-2004, it was stable from 2005 to 2009, it decreased substantially in the period 2010-2015 and it increased dramatically from 2016 to 2019; and in Spain the unemployment rate decreased from 1999 to 2007, it increased substantially in the period 2008- 2014 and it decresead from 2015 to 2019.
3. The ITR was implemented in June 1999.
4. In March 2000 the Brazilian government implemented the Fiscal Responsibility Law (FRL), that is, a set of public finance rules applies to the Federal government, the States, the Federal District, and the Municipalities to assure fiscal balance.
5. The Brazilian Central Bank (BCB) Monetary Policy Committee (COPOM) has to achieve the inflation target through the use of the base interest rate, SELIC. Inflation targets are based on the headline inflation index, i.e., extensive national consumer price index (IPCA).
Since the adoption of the NCM, the experience of the Brazilian economy with the NCM model shows that:
a. In terms of inflation, based on Table 1, from 1999 to 2019 the annual inflation rate was 6.4% per year, relatively high when it is compared with the other emerging countries that have adopted the ITR. Moreover, over this period, the upper limits of tolerance were missed for the years 2001, 2002, 2003 and 2015 by a substantial margin, especially in 2002 and 2015, while in 2004 the inflation target was only met after it was raised by mid-2003. Finally, the inflation rates were above the point targets in eleven years (1999, 2004, 2005, 2008, and 2010-2016 and 2019);6
b. Monetary policy has been characteristically tight, placing Brazil in the ranking of countries with the highest interest rates in the world: in the period 1999-2019, the average nominal interest rate was 10.8% per year7. Thus, by analysing the relationship between the interest rate and inflation, it is possible to observe that this relationship is, at most, weak;
c. According to Table 1, from 1999 to 2008 the average rate of the primary fiscal result over GDP was 3.3%, above the targets suggested by the International Monetary Fund. In 2009 and 2010 this ratio dropped to around 2.4% per year, mainly due to the IFC and the GR. It increased to 3.1%, in 2011, and from 2012 to 2019 the relationship between the primary fiscal resell and GDP dropped dramatically, becoming negative in the period 2014-2019.
d. Finally, analyzing the flexible exchange rate regime, from 1999 to 2019 the nominal exchange rate, real against US dollar, based on BCB (2020) data, was quite volatile: in the period 1999- 2003 it was devaluated, year after year; from 2004 to 2008 the exchange rate appreciated; in 2009 and 2010 it was devaluated due to the IFC; from 2011 to 2019 it was devaluated. 8
To sum up, the NCM model has not been successful to assure macroeconomic stability in the Brazilian economy, that is, inflation under control, sustainable economic growth and fiscal and external equilibria.
The experience of SGP in the Spanish economy
As in the case of Brazilian fiscal policy, the SGP’s monetary and fiscal policy strategy is based on the NCM, as Arestis and Sawyer (2005, 2017) pointed out. According to them, the main theoretical features of the NCM model can be summarized as follows:
A. Price stability is the monetary policy’s long-term primary objective of the common monetary policy;
B. ITR is a monetary policy framework whereby public announcement of official inflation targets is required. In this approach, “expected inflation” and the transparency of inflation forecasts are important element of the policy;9
C. Fiscal policy is the only independent demand side instrument for stabilizing the economy in the member states of the monetary union;
D. The level of effective demand plays no role in determining long-term economic activity and, therefore, that adjustment should be determined by the supply side.
In the context of the European Monetary Union (EMU), since 1999, Spain has adopted a fiscal policy in accordance with the objectives established by the SGP. In fact, the Maastricht Treaty emphasizes that EMU member states must avoid excessive deficits, and the reference values for the deficit/GDP and debt/GDP ratios have worked in practice as an explicit fiscal rule10. In addition, the SGP establishes a set of mechanisms for monitoring and supervising the fiscal results, as well as a corrective component for those countries that incur an “excessive deficit”, that is, that did not comply with the fiscal rule.
Foot Notes
6 For additional details, see, for instance, Ferrari-Filho and Milan (2018).
7 Average rate calculated by the authors based on Table 1.
8 It is important to mention that in 2015 there was huge devaluation and in 2017 the exchange rate appreciated.
9 In the Euro Area, the monetary policy is conducted by the European Central Bank (ECB) that establishes an inflation target of around 2.0%.
10 A budget deficit of less than 3.0% of GDP and a government debt lower than 60.0% of GDP.
Table 1: Some Macroeconomi Indicators of the Brazilian Economy

As a consequence of the debt crisis in the EMU countries, the SGP has been reformed, following the economic policy guidelines derived from the NMC [4], to promote economic recovery from the supply side, with a strong fiscal restriction (austerity)11. A set of measures was introduced in the SGP to strengthen the mechanisms of surveillance, supervision, although, above all, the application of the Excessive Deficit Procedure (EDP)12. In addition, the Stability, Coordination and Governance Treaty was signed (January 2013) forcing the countries to introduce in the national legal systems the requirement to have a balanced budgetary rule (Fiscal Pact13).
Since the adoption of the NCM, the experience of the Spanish economy with the NCM model could be briefly summarized, as follows.
Foot Notes
11 A new, more restrictive fiscal rule was established, which limits the structural deficit to a maximum of 0.5% of GDP, in the medium term, for countries with debt greater than 60.0% of GDP; and 1.0% for those with debt less than 60.0% of GDP. In addition, countries with excessive deficit procedure (EDP) must present budget deficit reduction plans, also present an Economic Partnership Program, which includes detailed fiscal and structural reforms, such as the pension system, tax and social services, to correct their deficits on a lasting basis. These programs will be submitted to the the European Commission (EC) for their approval and monitoring.
12 The so-called Six Pack (December 2011) aimed at increasing budgetary surveillance and supervision of the Member States and the implementation of the EDP, in addition to a set of specific measures for the countries of the Eurozone (Two Pack - May 2013), with measures aimed at to guarantee the correction of excessive deficits and economic and budgetary supervision to the rescued countries, including Spain.
13 Or “fiscal suicide pact”, according to Arestis, Fontana and Sawyer (2013).
A. In terms of inflation, according to Table 2, from 1999 to 2019, the annual inflation rate was in average 2.1%, very close to the ECB’s inflation target, although relatively high when compared to the other Euro Area countries, which was 1.7% (this means that the Spanish economy has lost competitiveness over these years). During this period, the trajectory of Spanish inflation exceeded the ECB’s inflation target every year between 1999 and 2008, leaving the average in 3.2%. However, from 2009 to 2019, when economic growth reduced significantly, the Spanish annual inflation reduced to 1.1% in average, lower than the average of the Euro Area (1.3%), which is an symptom of the sharp economic depression experienced by Spain and the region since the IFC;
B. The monetary policy in the Euro Area has had a positive impact on Spain in terms of greater price stability and lower financial cost. Interest rates have followed a downward trajectory from before the introduction of the euro until 2004, the period of greatest Spanish economic growth, and thereafter following an upward trajectory until the outbreak of the crisis (2007) and again descending until 2019, as a consequence of the IFC. However, as De Grauwe (2018) analyses, the fact that the EMU is an incomplete monetary union, without a common financing mechanism, has produced differential interest rate among the Euro Area countries, reflecting the risk differential attributed to the countries. In the case of Spain, although it has always been positive, the inaction of the ECB at the beginning of the crisis and the late reaction, through the monetary policy of quantitative easing (QE) only since March 2015, made the financial costs of the debt higher than the Euro Area average, further reducing the Spanish margin of fiscal maneuver in the midst of the economic depression.
C. According to Table 2, from 1999 to 2008, the average rate of the primary fiscal result on GDP was 2.0%, above the targets suggested by the SGP. However, since 2009 Spain entered EDP, with an average deficit of 8.0% between 2008 and 2013, subsequently following a downward trajectory until reaching a deficit of 0.5% in 2018, when Spain exited EDP and ceased to have its fiscal policy intervened by the European Commission.
D. Finally, analyzing the flexible exchange rate regime, from 1999 to 2019 the nominal exchange rate, euro against US dollar, was quite volatile: in the period 1999-2002 it was appreciated, year after year; from 2003 to 2008 the exchange rate depreciated; in 2009 it appreciated and then maintained that level until 2015; and in 2016 it appreciated again and the volatility increased from 2017 to 2019.
In summary, the NCM model has not been successful to assure macroeconomic stability in the Spanish economy, that is, it has not been enough to assure sustainable economic growth and, mainly, as the Maastricht Treaty propose, inflation close to ECB’s inflation target and fiscal and external equilibria.
Table 2: Some Macroeconomi Indicators of the Spanish Economy

The Brazilian macroeconomic policies and main results in the 2000s years
This section presents the main macroeconomic policies and economic results during the Fernando Henrique Cardoso (FHC) second term, 1999-2002, Lula da Silva first and second terms, respectively, 2003-2006 and 2007-2010, Dilma Rousseff first term, 2011-2014, and second term (from 2015 until her impeachment in August 2016), Michel Temer period (from September 2016 to December 2018) and the first year of the Jair Bolsonaro term (2019-2020). In the beginning of the second government of FHC, after a huge devaluation of the of the exchange rate, there was a degree of skepticisms regarding the Brazilian economy in terms of inflation and GDP performance: the market expectations were that, at the end of 1999, the inflation rate would increase explosively, and the economic activity would go into recession with consequent increasing unemployment. However, a few months after this economic turbulence brought about by the exchange rate devaluation, surprisingly, Brazil’s economy, mainly due to the implementation of the ITR in June, seemed to rally once more and began to show signs of recovery. Thus, at the end of 1999, the inflation rate and the GDP growth rate were, respectively, 8.94% and 0.5% . The economic situation improved in 2000 due to, at least, two reasons: first, Brazil implemented the FRL, which was applicable to all levels of governments (Federal, States and Municipalities) to assure fiscal balance; and second the trade balance and the current account deficits decreased, and the inflows of portfolio capital and international direct investments rose. Thus, at the end of that year, the GDP growth rate increased 4.4%, and inflation dropped, comparatively with the previous year, to 5.97% (Table 1).
In 2001 and 2002, the Brazilian economic performance was determined by two special factors: first, in 2001, the turbulence on international markets (effects of 11th September 2001 and Argentina’s exchange rate crisis); and second, in 2002, the Presidential election in Brazil. Given that factors, the Brazilian’s EAs were so conservative in terms of macroeconomic policies: the base interest rate increased to 19.0%, in 2001, and 25.0%, in 2002, and the fiscal target rose to 3.3%, in both years. As a consequence, Brazil did not suffer a contagion crisis, but the economic growth became unstable (1.4%, in 2001, and 3.1%, in 2002), while inflation rate increased 7.9%, in 2001, and 12.53%, in 2002, mainly due to the huge exchange rate devaluation (Table 1).
The first term of Lula da Silva government was marked by the continuation, and in some aspects radicalization, of FHC’s second term economic policies, that is, the NCM model. Thus, monetary policy was explicitly recessive to aim at keeping inflation under control, and fiscal policy was dominated by the goal of obtaining a primary surplus of 3.75% of Brazilian GDP, from 2003 to 2006, to guarantee the service of the public debt. At the same time, some liberal reforms were implemented, such as social security reform, in 2003, and tax reform, in 2004, as well as, in 2015, new steps of the capital account liberalization were taken. Despite the adoption of orthodox fiscal and monetary policies and the implementation of liberal reforms, during the period 2003-2006 the Brazilian economy recovered pushed by the strong boom in commodities’ exports that resulted from the greater real of economic growth in the global economy (Table 1). Shows, from 2003 to 2006 the trade balance and current account accumulated, respectively, a surplus around of US$ 150.0 billion and US$ 43.5 billion).
At the end of the first term of the Lula da Silva government, the average economic growth and inflation rates were around 3.5% and 6.4%, respectively, per year. In the beginning of Lula de Silva’s second term, despite the fact BCB continued to implement monetary policy in such a way as to meet inflation targets, the government adopted some structural initiatives – such as the expansion of the social protection and income transfer programs, a real increase in the the minimum wage, and an expansion of public investment, specially under the Growth Acceleration Program (Programa de Aceleração do Crescimento, PAC)14. Because of these measures, in 2007 and 2008 the GDP growth rate increased, respectively, 6.1% and 5.1%, and the inflation rate was 4.46%, in 2007, and 5.9%, in 2008 (Table 1).
However, as it was mentioned in the Introduction, the IFC, after September 2008, caused the world economy to collapse. At that time, the Brazilian government’ policy responses to the contagion of IFC and the GR were completely different form the other international crises during the 1990s and the beginning of the 2000s. Why on that occasion it was different? Mainly because the reduction in public external debt, the previous policy of international reserves accumulation and the reduction and improvement in the composition of public debt provided some policy space for the introduction of countercyclical policies in Brazil to mitigate the effects of the IFC. Despite the quick response of the Brazilian’s EAs to the IFC, by the end of 2008 the Brazilian economy had fallen into recession: in 2009 the GDP growth rate was negative (Table 1). Moreover, the trade balance in Brazil deteriorated between 2008 and 2009 due to the fact that their most important trade partners, such as the United States and the countries of the Euro Area, had fallen into recession. It is important to mention that another reason for the deterioration of the trade balance and current account was the sharp drop in commodity prices by the end of 2008 – compared to the prices of the 2004-2008 period – and the capital outflow.
Indeed, Brazil recovered sharply in 2010. Such a recovery was the consequence of a combination of external factors with domestic ones. On the one hand, the external factors are related to (i) the recovery of the international trade by the middle of 2009 favored by the recovery of the Chinese economy through the use of expansionary policies that once again increased the demand for basic goods, and (ii) the return of the capital inflows to emerging economies, boosted by the expansionary monetary policy adopted by developed economies. On the other hand, the domestic factors are related to the successful implementation of countercyclical policies in Brazil, such as:
a. The BCB provided foreign currency liquidity to the private sector, to ensure both the operation of foreign exchange markets and the continuous availability of external financing. Moreover, the BCB, with some delay, eased monetary policy by lowering the base interest rate from 13.75% in December 2008 to 8.75% in September 2009.
b. State-owned banks – Banco Nacional de Disinvolvement Econômico e Social, Banco do Brasil, and Caixa Econômica Federal – were encouraged to expand their credit operations, compensating for the deceleration in the credit supply by private banks.
c. The Brazilian government made use of countercyclical fiscal policy, by reducing taxes – such as reduction in the industrialized products tax (IPI) burden on motor vehicles, consumer durables and construction items – to stimulate investment and consumption and also by increasing public expenditures. It was launched a program of government incentives and subsidies for housing construction, called My House, My Life (Minha Casa, Minha Vida), targeted at low and middle-income households.
d. The minimum wage increased, in real terms, and the value number of social programs rose.
As a consequence of all macroeconomic policies, the GDP growth rate increased 7.6% at the end of 2010 (Table 1). However, the Brazil’s economic success of the Lula da Silva’s response to the 2007-2008 IFC changed the course of the original NCM model, that is, the fiscal target was reduced and the monetary became less tight. The first term of Rousseff government is characterized by two phases: from 2011 and 2012, the Brazilian’s EAs adopted some orthodox macroeconomic policies to keep inflation under control and to improve the macroeconomic fundamentals; and from 2013 to 2014 some countercyclical macroeconomic policies were implemented to mitigate the impact of the Euro crisis.
Given that, from 2011 to 2014 the Brazilian economy presented some signs of an impending crisis: GDP dropped from 4.0% (2011) to 0.5% (2014), inflation rose to 6.41%, the primary fiscal result over GDP was reduced from 3.1% (2011) to – 0.6% (2014), the trade balance dropped from US$ 29.8 billion (2011) to – US$ 3.9 billion, the current account accumulated a deficit of almost US$ 280.0 billion in the period and capital outflows intensified (Table 1). In this scenario, in October 2014, in a very close-run election, Rousseff was re-elected President of Brazil.
After taking office in January 2015, Rousseff administration’s first year was marked by two situations that contributed to Brazil’s economic crisis and stagnation. The first was Operation Car Wash (Operação Lava Jato in Portuguese)15, a politically significant factor that not only worsened economic agents’ decision-making expectations, but also partly explained the abrupt, deep recession that engulfed Brazil in 2015 and 2016. The second arose when the government, abandoning the countercyclical macroeconomic policies and decided to introduce orthodox fiscal and monetary policies.
Exploring the second situation, on the one hand, fiscal policy was dominated by the following measures: public expenditures were cut; some taxes (on financial loans, company financial revenues, manufactured goods and automotive exports) were increased; subsidies for companies were reduced; social benefits (unemployment and sickness insurance, for instance) were cut; and public and administered prices were raised dramatically. The impact of this fiscal policy on the economy was recessive because it replaced public investment and social benefits by payments to rentiers. On the other hand, monetary policy was also explicitly recessive, as the base interest rate set by the BCB was raised to reduce and control inflation. The main consequences of this orthodox economic policy were that Brazil’s currency, the real, weakened dramatically from an average exchange rate of R$ 2.36 per US dollar in 2014 to R$ 3.33 in 2015 (BCB, 2020), annual inflation rose to 10.7%, due mainly to the huge exchange rate depreciation and public and administered price shocks, and GDP fell 3.5%, with the average unemployment rate increasing from 4.8% (2014) to 6.8% (2015) (Table 1).
This economic policy strategy based on fiscal austerity and tight monetary measures not only failed to solve Brazil’s economic problems, but it heightened them. Thus, Rousseff decided to dismiss Joaquim Levy and introduce some economic policy flexibility. Under the new strategy, monetary policy remained tight, aiming to mitigate inflation, while fiscal policy became more flexible, to aim at stimulating aggregate demand. In 2016, however, the economic problems had not been reduced. On the contrary, they had worsened, not only because fiscal expansion was carried out in a manner that lacked credibility, using devices (among them, “creative accounting”16) that inspired mistrust, but as a result of the political and institutional crisis, which led, in April, to Rousseff’s suspension and finally, in August, to her removal from office.
Foot Notes
14 The Brazilian government launched the PAC in January 2007 with three main objectives: to stimulate private investment; increase government investment in infrastructure; and remove the main obstacles to economic growth (bureaucracy, inadequate norms and regulation). For full details, see Brasil (2020).
15 A criminal investigation by the Federal Police to investigate money laundering and corruption in public enterprises, such as Petrobras (Brazil’s largest corporation).
16 In Brazil, “creative accounting” refers to the use of artificial manners of achieving fiscal equilibrium.
On 31 August 2016, Vice President Temer became president in her place for the remainder of the term (2015-2018). During his short term, Temer implemented a liberal agenda based on fiscal austerity and structural reforms. In December 2016 and in 2017, the government submitted, and the Brazilian Congress approved, two constitutional amendments: one created the New Fiscal Regime (NFR), designed to achieve tight fiscal consolidation, and the other one implemented a labour reform, deregulating the labour market. At same time, tight monetary policy continued to be applied in order to bring the inflation rate within the range of the ITR. This economic strategy restored “confidence” among economic agents because the inflation rate had fallen to 6.29% by the end of 2016, even though GDP fell 3.3% unemployment rate rose to 11.5% (Table 1). In 2017 and 2018, with improving fiscal conditions, lower interest rates and an international scenario favorable to the Brazilian economy, economic activity recovered, and GDP increased 1.3% in both 2017 and 2018, and inflation rate was, respectively, 2.95% and 3.75%, in 2017 and 2018. Bolsonaro, from the right-wing party, was elected President in October 2018, and on his inauguration, in January 2019, he promised to implement a radical liberal agenda, based on structural reforms, privatization and government expenditures reduction, as the main condition to recovery the economic growth. During the first year of his term, 2019, it was implemented a social security reform, an Economic Freedom Law was implemented, and some public expenditures were cut. Even though fiscal policy was operated according to the ‘expansionary fiscal contraction’ – that is, the idea that fiscal adjustment stimulates a sustainable economic growth in the long run –, BCB continued to reduce the base interest rate: at the end of 2019, SELIC dropped to 4.5% (Table 1).
As result of a tight fiscal policy, even with a more flexible monetary policy, in 2019 the GDP growth rate was only 1.1% and the unemployment rate was 11.9%, while the inflation rate was 4.31% (Table 1). mainly due to a shock in prices of meat in the last quarter of the year.
The Spanish economy under SGP and the impact of the IFC and the Euro crisis
This section analyzes the Spanish macroeconomic performance under SGP and the impact of the IFC and the Euro crisis. Since the introduction of the euro and the IFC, which include the conservative governments of José María Aznar (1996-2004), of the socialist José Luis Rodríguez Zapatero (2004-2011), and the conservative Mariano Rajoy (2011-2018), followed by the socialist Pedro Sánchez (2018-). Along those years, the Spanish economy punctually followed the limits imposed by the SGP, as can be seen in Table 2. Before IFC, the evolution of the Spanish macroeconomic aggregates has been quite good, such as:
a. An average economic growth of 3.8% of GDP.
b. Balance of public accounts with an average public surplus of 0.2% of GDP, obtaining a fiscal surplus of 2.0% in 2006 and 2007.
c. A sharp reduction in public debt (from 60.8% of GDP to 35.8%).
d. A significant level of investment, that increases 5 points of GDP in the period.
e. A vigorous job creation, with a significant reduction in the unemployment rate (from 15.7% of the active population to 8.2% in 2007).
f. A foreign sector that maintained a constant participation in the GDP.
In order to analyze the effects of IFC in Spain, it is also important to take into account the determinants of the Spanish economy “long phase of expansion”, between 1996 and 2007, as well as the imbalances created.
The dynamic positive effects of the EMU must be highlighted, reflected in low interest rates in the context of greater inflationary stability and positive expectations. As a result, a pronounced and sustained expansion of demand has been observed, with a singular growth in the construction sector (average 5.0% per year in the period). Moreover, the sectoral push given by the fiscal policy that stimulated the acquisition of housing cannot be ignored [5]. On the supply side, the maintenance of investment levels, wage moderation through collective bargaining and the strong growth of the working population due to immigration and a greater incorporation of women on the labour market [6] were important to stimulate the productivity and the aggregate supply. In summary, domestic consumption and real estate investment became the engines of Spanish economic growth between 1999 and 2007.
However, this growth model has generated significant imbalances, highlighting the real estate bubble and strong private debt. First, growth dependent on the construction sector, a highly volatile sector vulnerable to financial crises, on which growth in employment, income and also public income depended. On the other hand, a strong indebtedness of families, which generated another imbalance in the balance sheets of the public bank system, the main funders of the mortgage expansion. The emergence of the IFC in 2008 found, in these internal misalignments of the Spanish economy, an amplifier that has suddenly stopped the upward trajectory of the Spanish economy, generating a recessive phase between 2008 and 2013, with a small growth interval in 2010 (Table 2).
There is a controversial debate about the determinants of that economic trajectory. Hernández de Cos and Pérez (2013) attributes the Spanish fiscal imbalance to public income dependent on extraordinary, non-structural factors, such as an excessive growth of financial and real estate assets, the sectors that have dropped with the crisis, while Uxo et al (2017) also attribute this evolution to the early withdrawal of fiscal stimuli generated by the European Economic Recovery Plan (2010)17 and to the negative consequences of the subsequent fiscal consolidation plan and the opening of the EDP applied to Spain from 2009.
In this framework, the fiscal policy of the UME and, therefore, of Spain, has been reformed through a set of rules called “six pack” and “two pack” (that enforce monitoring of Euro Area countries subject to EDP) and strengthened by the Stability, Coordination and Governance Treaty. This set of new rules institutionalized the fiscal austerity followed by the countries of the Euro Area after the IFC, making fiscal policy procyclical. In addition, associated with the demands of structural budgetary balance, a series of structural reforms (pension, collective bargaining, tax, etc) were promoted to reduce public spending. Following this new regulation, in September 2011, Spain approved a constitutional reform, according to which all Public Administrations must adapt their budget to the principle of stability. In addition, to strengthen this fiscal rule, a spending rule was approved (Law, 2/2012)18 which establishes that annual public spending (all the Spanish state) may not exceed the mediumterm reference rate of GDP growth, established in accordance with the methodology of the EC.
Despite the adoption of fiscal measures and cuts in public spending, Spain’s deficit and public debt have soared since 2008, and the economy has experienced a double-deply crisis with negative GDP growth rates in 2008 and from 2011 to 2013 with a strong acceleration of the unemployment rate (Table 2).The IFC fully reached the Spanish economy, mainly due to its intensive economic structure in the construction sector and was subsequently fueled by the austerity policy that has caused an abrupt drop in domestic demand (both from public spending and of private consumption). The deepening of the debt crisis in the Euro Area, especially because fiscal austerity has led to the need to bailout Greece, Ireland, Portugal and Spain, threatening the sustainability of the euro, the ECB launched in March 2015 a QE monetary policy, with the purchase of public and private assets, acquiring more than 2.6 trillion euros until December 2019. That policy was aimed, as emphasized by [8], to offer liquidity to the bank sector, to restore confidence to the financial system and also contain the impact of the crisis on the real economy. According to [9], one advantage of QE is that it makes easer for the government in term of their fiscal policies because there is a ready buyer for the government debt. Without these facilities, there would be difficulties and may force governments to contain the degree of their fiscal initiatives19. Thus, the ECB monetary policy was crucial to reduce financial tensions at the Euro Area level. In the Spanish case, we should also add internal and external factors that have contributed to the change in the trajectory of the Spanish economy since 2015, even though Spain was still immersed in the EDP. In the framework of the requirements associated with the EDP, during the IFC Spain has carried out important structural reforms, particularly on the labor markets, the bank system and the tax systems. These structural reforms are designed within the framework of the NCM theory, seeking to tempt force adjustments to the crisis from the supply side. In this sense [10-12] argue that structural reforms (which provoke internal devaluations, as in the case of Spain and other EMU countries) during periods of economic crisis can have a negative effect by increasing real interest rates, further depressing domestic demand and, therefore, production and employment, and especially in countries without the capacity to carry out exchange policy [13]. Moreover, Romer (2012: 9), argues “that immediate severe fiscal austerity is a very bad idea in countries with high unemployment. Even in countries flirting with a crisis, immediately cutting spending and raising taxes in the current situation is very likely to do more harm than good”.
The fiscal rules and responses to the IFC and GR: Brazil vis-à-vis Spain
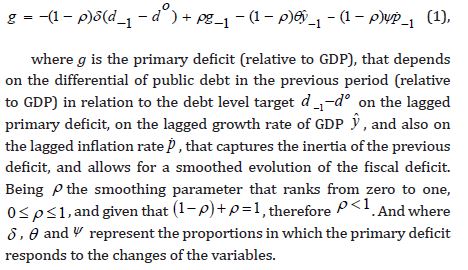
In this section we will follow the approach conducted by [14] to analyze the fiscal responses in Brazil and Spain during the IFC and GR. It is important to mention that in the 2019 article, starting from the proposal found in [15], it was shown the contribution of fiscal rules to stabilize the Brazilian economy. Thus [14] proposed a fiscal rule describing how the government deficit objective responds negatively to deviations of the public debt level from its optimum level to the growth rate variations, and also to the inflation growth rate. The reason to include, in the 2019 article, the inflation growth rate as argument was to capture the Brazilian government proposal of constraining the growth of government expenditures below the growth of inflation in the NFR of 2016.
Adapting that methodology to the Brazilian and Spanish cases and assuming the current government deficit adjusts itself with the previous period value, the proposed fiscal rule is the following:
Foot Notes
17 After the outbreak of the IFC, the European Economic Authorities launched the European Plan for Economic Recovery with the aim of restoring domestic demand through fiscal stimuli (around 2.3% of GDP in 2009). However, as of 2011, with the reform of the SGP, fiscal policy changed sign, returning the countries to a much more intense depressive trajectory, at least in the case of Spain, due to the austerity policy, the high cuts in public spending and an internal devaluation that led internal demand to a historical retraction.
18 Organic Law 2/2012, of April 27, of Budgetary Stability and Financial Sustainability.
19 The authors also call the attention to the necessity of a close coordination of monetary and fiscal policies, under the risk of the subordination for monetary policy to fiscal policy and, the central bank independence.
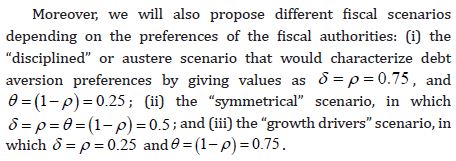
Using these figures, in Tables 3 & 4 we show the deficit generated by the fiscal rule given by equation (1) according to the proposed scenarios, in the Brazilian and the Spanish economy, respectively. We have used the average of the debt of the period as proxy of the debt target. And, regarding the inflation constraint, we have allowed for a fully indexation of the government deficit, choosingψ = 1, which implies that the deficit growth is the maximum allowed by the Brazilian rule of 2016. Figures 1 & 2 show the paths of the actual deficit and the deficit calculated from the proposed rules in both economies.


Table 3: Government Deficit (+)/Surplus (─) in Brazil

Table 4: Government Deficit (+)/Surplus (─) in Spain

Aimed to evaluate the usefulness of the Brazilian fiscal rule, we have also computed the deficit generated by equation (1) assuming that there is not an inflation constraint. In other words, we have repeated the previous calculations for ψ = 0. Results are showed in Tables 5 & 6, and Figures 3 & 4, for Brazil and Spain, respectively. Looking at the tables and the Figures, we find that the use of fiscal rules would be advisable in Brazil, since they help to generate more financing capacity. And the kind of fiscal rule that best behaves is the “growth promoting” rule. Furthermore, when the fiscal rule includes an inflation ceiling as the 2016 Brazilian fiscal rule does (ψ = 1 in terms of our fiscal rule), the rule augmented with the inflation constraint contributes to increase the government surplus, improving the net lending position of public accounts. Specifically, using a fiscal rule fully indexed to inflation and promoter of growth, in years of GDP growth close to zero or negative (as occurred from 2014 to 2016, as showed in Table 1), the rule is able to generate capacity of financing.


Table 5: Government Deficit (+)/Surplus (─) in Brazil

Table 6: Government Deficit (+)/Surplus (─) in Spain

But in the case of Spain, fiscal rules proved to be useful only after the IFC. From the adoption of the SGP, the member states of the EMU had committed themselves to reach a medium-term budgetary position close to balance avoiding excessive deficits, and the reference values for deficit-to-GDP and debt-to-GDP ratios, stressed in the Maastricht Treaty had worked in practice as an explicit fiscal rule. Those European commitments had seemed to work for Spain until 2007. However, after that year, Spain turned to be net borrowing. Comparing the fiscal situation between Brazil and Spain, it should be noted that before the IFC, both the Brazilian and the Spanish government deficit (or surplus) showed a stable path around minus 3 points in average in Brazil, and around zero in average in Spain. After the financial crisis, the figures remain quite stable in Brazil, although the path of surpluses turn into deficit from 2014 onwards, but with figures never higher than two points (Figure 3 & 4).
On the contrary, in Spain, after the crisis, the Spanish budget experiments a noticeable deterioration reaching deficit figures around ten points in average. At the European level, after the reform of the SGP, as it has been showed before, a new Pact for the Euro was signed in March 2011, pointing out as an essential need that member states should implement in national laws the budget rules established in the SGP. In Spain, this commitment was introduced by the reform of the Spanish Constitution, and the legal development of this reform continued in the Organic Law of Budgetary Stability and Financial Sustainability of 2012 (Law 2/2012). From 2012 a spending rule is included in the Spanish law, to keep it from rising above the rate of growth in production, and in addition, limits on debt of government levels inferior to the central government are set.
If we look at the Figure 2 & 4, from 2012, the fiscal rule followed by Spain seem to mitigate the deterioration of the public finances. But, in any case, any of our proposed fiscal rules would have better contributed to the recovery. Among the proposed rules, the “growth promoting” rule augmented with the inflation constraint shows the best results. From a broader perspective, trying to describe the fiscal performance in both countries, can be outlined that before the IFC, Brazilian and Spanish public finances keep stable. It is from the IFC crisis when Spanish finances deteriorate significantly. But this is not the case in Brazil, where they remain considerably stable throughout the analyzed period. However, in Spain the budget suffers a significant deterioration. And is not until 2012, after the introduction in the Spanish legislation of the budget rules established in the SGP when Spanish public finances begin to recover. This would mean that the Spanish economic policies aimed to deal with the IFC there were not effective enough, in the environment of the Euro crisis, and fiscal control was made necessary through an explicit fiscal rule.
Conclusion
The economic crises that have hit the economies internationally since the 1990s, have had different repercussions in different countries. The solutions that have been tried to be offered, have been based on the predominant macroeconomic consensus; that is, on the conventional economic wisdom of the NCM. However, the results have still been mixed. In this article we have tried to compare the economic performance of public finances in two countries, such as Brazil and Spain, which show some common features. The shared characteristics are defined in terms of their economic policies, based on similar macroeconomic models (the NMC model in Brazil and the SGP in Spain), and quite similar structure and the trade relationships between both countries. After reviewing some considerations of the NCM and SGP theoretical bases, we have compared the Brazilian and the Spanish macroeconomic policies and their results during the 2000s years. Before the the IFC, Brazilian and Spanish public finances keep stable. But after the IFC, and following the Euro crisis, the Spanish finances deteriorate significantly, while in Brazil they remain stable even after the GR. In Spain, following the reform of the SGP, signed at the European level, the spending rule included in the Spanish legislation seem to have mitigated the deterioration of the public finances.
Finally, we have conducted a simulation exercise to investigate to which extent the use of explicit fiscal rules would have improved the macroeconomic performance in Brazil and Spain. The results show that, in both countries: (i) the use of fiscal rules would be advisable, since they generate more financing capacity; (ii) among the proposed rules which best behaves is the “growth driver” rule; (iii) the worst performing rule is the “disciplined” rule, similar to the rule imposed by the SGP to the European countries; and, in any case, (iv) the definition of fiscal rule that behaves better is the one in which the deficit is fully indexed to inflation, as the Brazilian rule implemented under the NFR of 2016. Summing up, we can conclude, with due caution, that the more flexible performance of fiscal policies in Brazil seems to have been more successful than that of the stricter European fiscal requirements that guide the Spanish fiscal results.
Acknowledgement
None.
Conflict of Interest
No conflict of interest.
References
-

This work is licensed under a Creative Commons Attribution-NonCommercial 4.0 International License.


