 Case Report
Introduction to Artificial Intelligence: Tutorial for Nonprogrammers with Professor Zaitsev – to kick-off in an hour applying AI & ML in Economics & Business
Dmitry Zaitsev, Department of Intelligent Systems and Networks, Tyczyn, Poland.
Received Date:February 09, 2024; Published Date:June 07, 2024
Abstract
It is not a research article; it is a tutorial and the simplest one I ever composed. I was observing nonprogrammers attending my tutorial who were starting using AI and ML in their professional domain in an hour with simple orange toolset. Let us do it together. Then I offer you to improve following my lecture courses, especially doing exercises thoroughly. Programmers who were not mixing with AI before are welcome as well.
Introduction
This tutorial involves beginners who, possibly, are not programmers, though they have mastered the basics of working with computers and using MS Office and Internet resources. Also, it could be useful for IT and CS professionals who lack basic knowledge in the AI domain and would like to be updated. Only selected topics are covered in this paper to not overload a newcomer with novel concepts. You can download the tutorial freely from the online resource [1]. This tutorial is supplied with a vaster course Introduction to AI also available online [2]. The robustness of the approach is confirmed by the SKEMA Business Schools successful teaching experience and by tutorials of international conferences. Lectures submerge you in a miraculous world of Artificial intelligence, from definitions, the Turing test, classification of AI directions, and an overview of the AI domain. We will be playing AI powered games to understand what it is. Then we proceed with data science, a case study in analyzing business information for big corporations. Advanced topics in logic, using the very popular automatic proof system Z3 are optional. Finally, we will concentrate on Supervised Machine Learning and Unsupervised Machine learning within the interactive system Orange Data Mining [3], which is very easy to use and understand. Just draw on screen your layout, connecting components, and the ML system is ready to use. For a case study, we will find big data sets on the Internet, though you can use your own data as well. After our tutorial, you can proceed with studying Python [4], PyTorch, Jupyter, as well as mastering embedded applications with NVIDIA Jetson and selfdriving vehicles with Jet Bot.
Where to Find Data
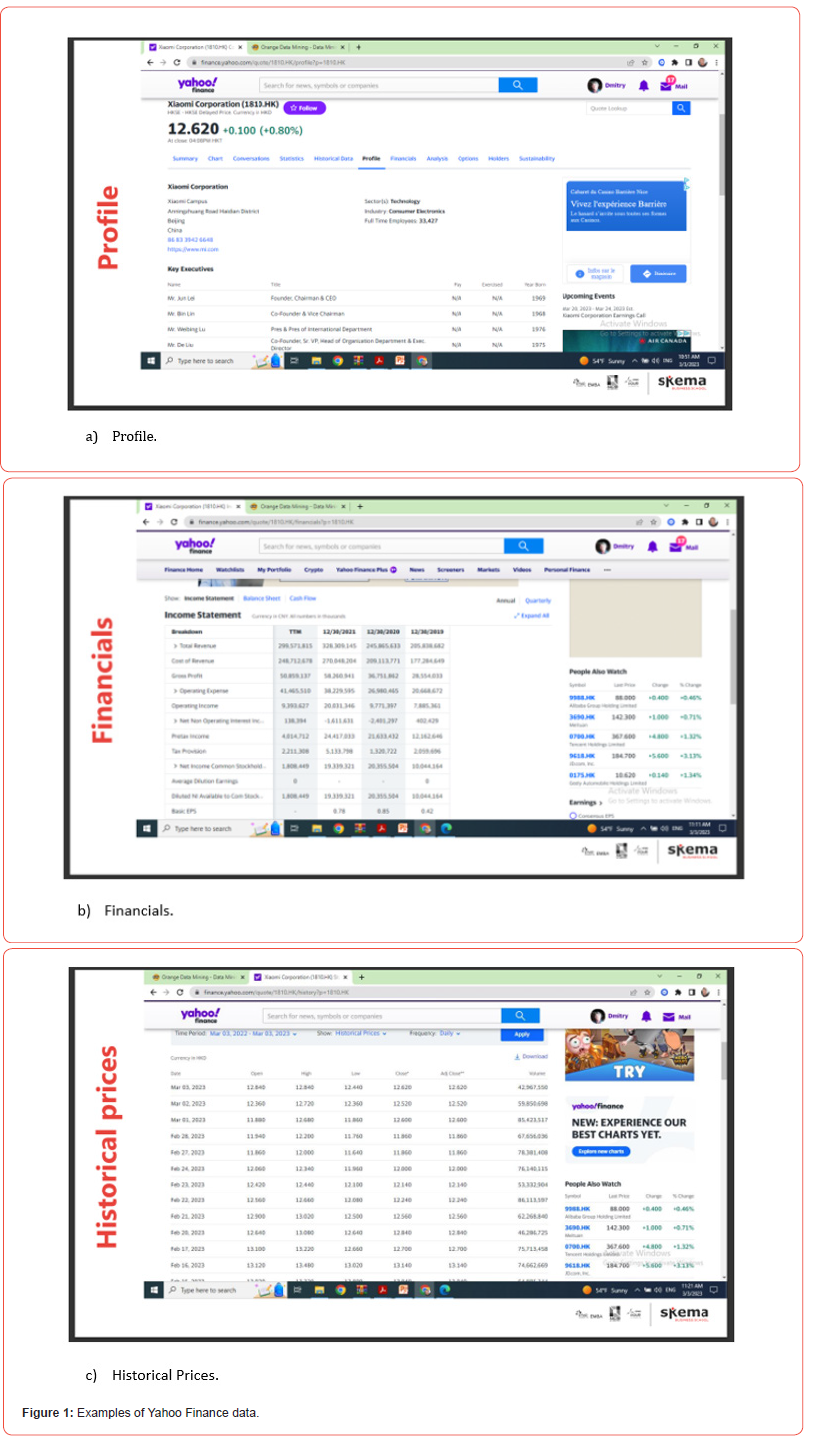
Recently you found plenty of datasets on the Internet free of for sale. Data Science is a broad, multidisciplinary field that aims to make sense of raw data. The basic tasks of data science are extracting essential information from raw data; identify trends, patterns, connections and correlations in large data sets; use more sophisticated tools and techniques such as computer programming, predictive analysis, statistics and artificial intelligence, especially machine learning. Yahoo Finance [5] offers a wide range of fre financial data on world leading companies which includes: a brief description – Profile, Holders; current situation description – Summary, Financials; statistical info on recent periods of time – Statistics, Chart; data on specified period of time – Historical Data; forecasts – Analysis. Examples are shown in (Figure 1).
When we download data from online databases, for instance from Yahoo Finance, they are usually represented in CSV format – Comma Separated Values, one row specifying one moment in time is a time series are meant. An example of CSV file downloaded from Yahoo Finance is shown in (Figure 2).
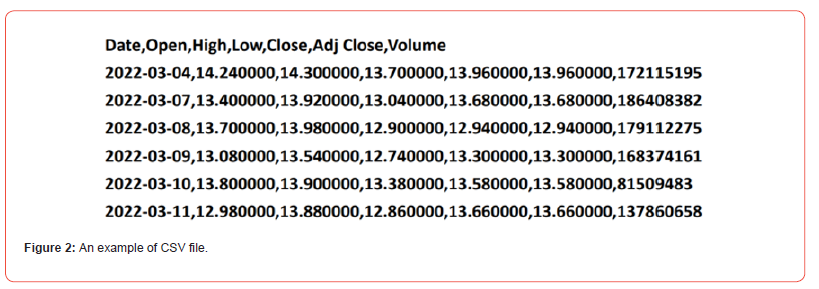
We can view and edit CSV files either in a text editor or using MS Excels that supports the CSV format and can transform it into an electronic table.
Which Tools to Install and Use – Starting with Orange
Orange [3] represents an open-source machine learning and
data visualization toolset that is easy to use, that does not require
programming skills. It is rather simple to install Orange if you have
Python installed. You download Orange from site [3] and run its
installer. To start Orange, you can use the following command:
>python3 -m Orange.canvas
An example of orange use is shown in Figure 3 where financial data are represented in tabular and graphical forms. We just add blocks from the graphical menu of blocks and connect them using dedicated graphical editor. In the example we can see three blocks. CSV File block is connected to Data Table and Scatter Plot blocks to represent the file contents.
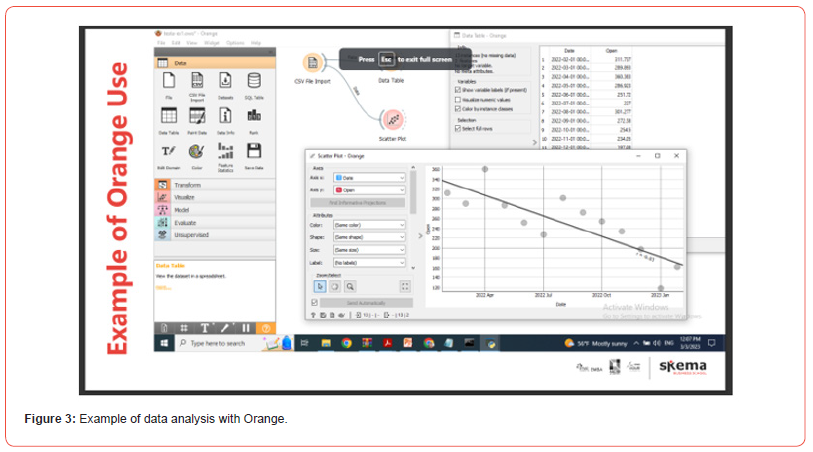
Basic Orange concepts are rather simple. You just draw your workflow of data processing and visualization. Data analysis workflow is represented via connection of blocks, so called widgets – computational units of Orange to read data, process data, visualize data. Our goal is to implement basic functions of data clustering and building predictive models. Let us create a workflow for Xiaomi stock prices to analyze and visualize historical data (Figure 3). We add a File widget to load data from file or URL. Then connect it with Data Table widget to print the corresponding table. By default, the complete table is printed though we can specify the widget attributes in a pop-up window to separate columns define peculiarities of data representation. To connect widgets, we just drag a line connecting widgets connecting input-output channels. Then we add in a similar way a Scatter Plot widget to represent (visualize) data values by dots. Real multitude of opportunities is created with editing the attributes and options of widgets; a double click of mouse opens the widget specification. A File widget contains such attributes as: Path or URL and Import options – encoding, delimiter, ignore columns. A Data Table widget visualizes numeric values. A Scatter Plot widget specifies axes with such attributes as: color, shape, size, label; it also shows a legend, gridlines, and a regression line. Principles of Orange work are rather simple. There is a set of widgets and their attributes, and options. We draw workflow as a network of connected widgets. Widgets communicate with each other and changes in some widgets are immediately propagated through the workflow. It resembles the process of formula recalculation within an electronic table like MS Excel.
Statistical Analysis with Orange
Let us do something useful now using new widgets for statistical analysis of data and compare advances of two corporations on whether there is a mutual influence reflected by the corresponding correlation. The workflow is shown in (Figure 4).
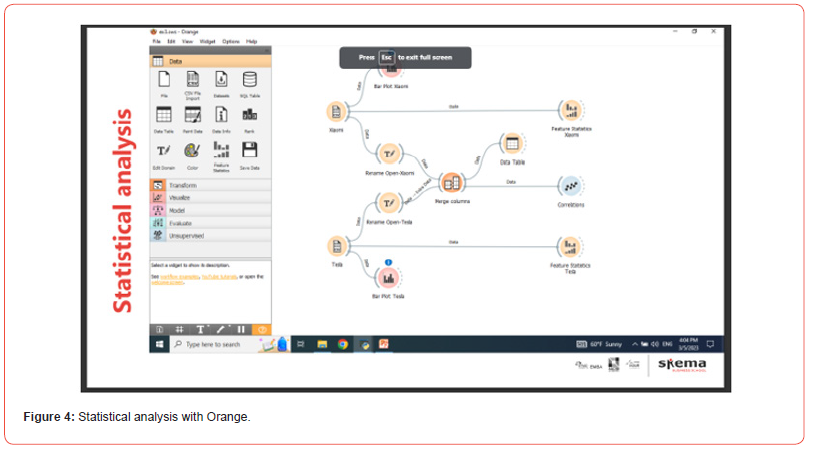
Here we use a few additional widgets: Feature statistics widget to compute basic statistical info on a data series: mean, dispersion etc; Correlation to compute the correlation coefficient (mutual influence); Data transformation to edit domain widget – rename columns; Merge data widget to merge columns. To compute the correlation coefficient between two data series, we need a table containing only two corresponding columns which we extract from the source tables. The results of statistical analysis are shown in (Figure 5).
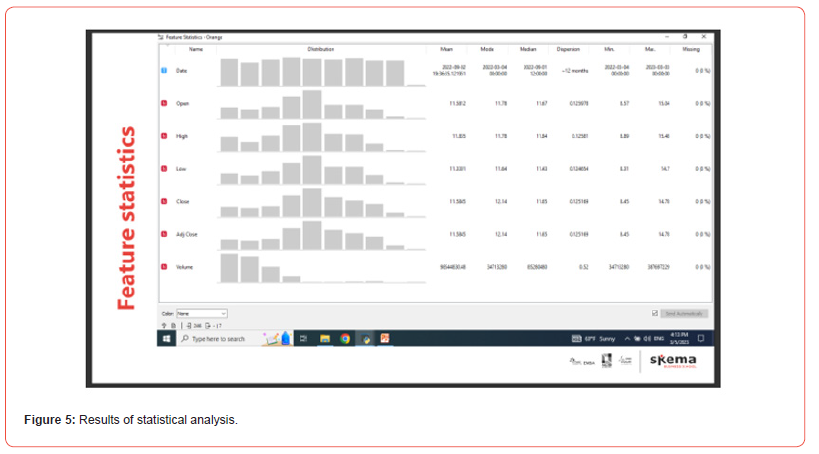
Now we offer you to repeat the considered schemes on your computer and then to switch to the second task – create workflow for statistical analysis of your company compared to other company. You are invited to compute statistical characteristics of your company; compute correlation of one column (for example, “open”) with the corresponding column of another company. To compute correlation, cut and rename columns for each company, then merge columns to create a joint table. Please try to formulate your conclusions and recommendations based on the results of the statistical analysis.
Supervised Machine Learning with Orange
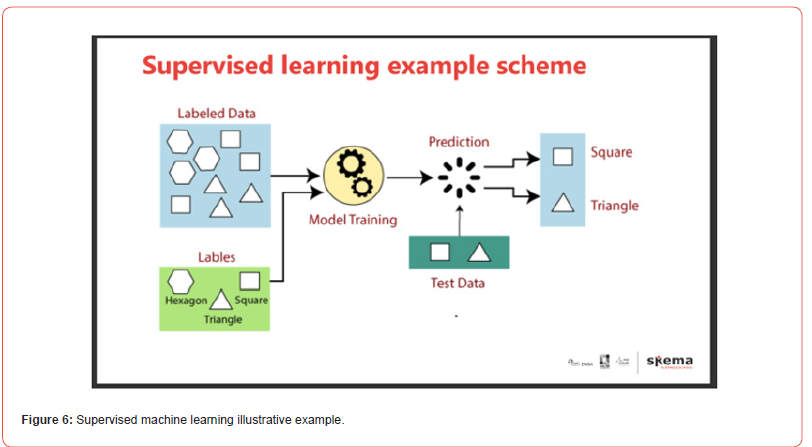
Machine learning procedure can be specified in the following simplified form: collect dataset or get data in real time; train neuron network – adjust NN parameters for your task; test neuron network – check how it recognizes new data; use neuron network – practical use for prediction, recognition, classification, recommendation, control. Now we focus on supervised ML when we have labelled training sets and data, our goal is to recognize and classify data (fruits or vegetables, cats or dogs, etc.). Supervised learning describes a class of problems that involves using a model to learn a mapping between input examples and the target variable. Models are fitted on training data comprised of inputs and outputs and used to make predictions on test sets where only the inputs are provided and the outputs from the model are compared to the target variables and used to estimate the skill of the model. We distinguish classification – supervised learning problem that involves predicting a class label; regression – supervised learning problem that involves predicting a numerical label. The supervised learning approach is illustrated with an example of geometric figures recognition shown in (Figure 6).
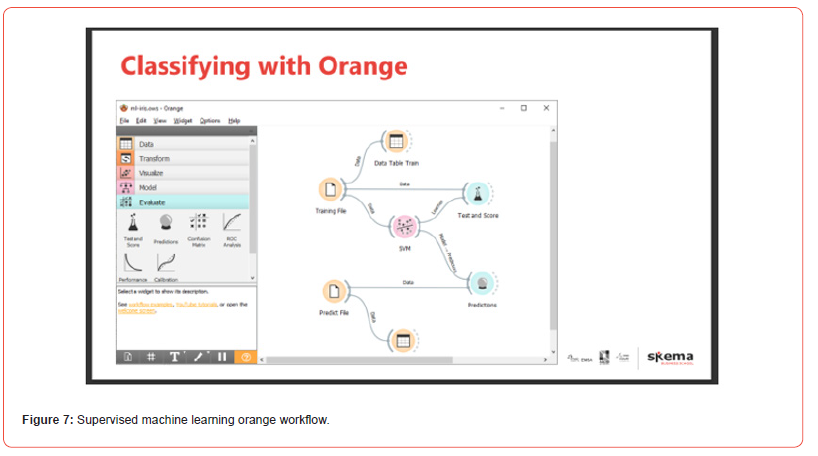
An example orange workflow for classifying flowers is shown in Figure 7. We added an SVM widget with an NN model and Test and Score widget to observe the training process. In parallel we use the trained NN for prediction in the bottom part of the workflow.
We can compose a few NN models in parallel, as is shown in Figure 8, to choose the best model for our application. Then we can save the best model and use it in future applications. Please also use the widget attributes to play with the model parameters and choose the best set of parameters for your task.
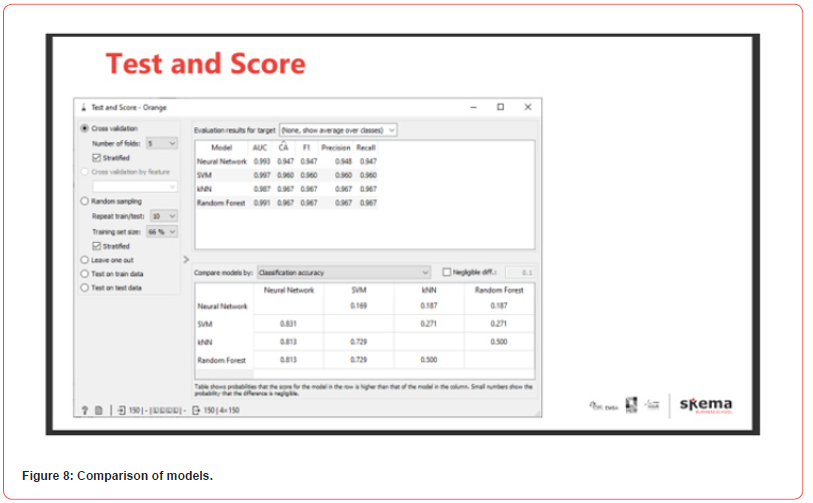
Such additional widget as Confusion Matrix allows you to find the number of unsuccessful cases of the prediction for each model and for each classification item. Orange offers a dataset for flowers classification, in particular, for Irises based on such features as petal and sepal width and length. You can use your datasets for domains of interest.
Conclusions and Further Directions
Thus, in an hour or a couple, you kicked off with data science and machine learning using simple and powerful graphical orange tools. We invite you to proceed with unsupervised learning from the cited series of lectures [2]. For more wide view of AI domain, we invite you to work with logical representation of knowledge using the very powerful system Z3. Please consider other lectures to study basic definitions and concepts because within this article we were relying on intuitive experience only. In case you would like to start programming in Python for more flexibility in mastering AL and ML system, we offer you a Python Bootcamp run in 2023 in SKEMA Business School at Nice, Parise, and Lille campuses [4] to start programming in Python in 15 hours.
Acknowledgement
None.
Conflict of Interest
There are no conflicts of interest.
References
- Dmitry Zaitsev, Tutorial Introduction to Artificial Intelligence: Machine Learning with Orange.
- Dmitry Zaitsev (2023) Introduction to Artificial Intelligence: Lectures course, SKEMA, Beijing.
- Orange Data Mining Fruitful and Fun: Open-source machine learning and data visualization.
- Dmitry Zaitsev (2023) Python Bootcamp, SKEMA, Nice-Paris-Lille.
- Yahoo Finance.
-
Dmitry Zaitsev*. Introduction to Artificial Intelligence: Tutorial for Nonprogrammers with Professor Zaitsev – to kick-off in an hour applying AI & ML in Economics & Business. Iris J of Eco & Buss Manag. 2(3): 2024. IJEBM.MS.ID.000537.
-
Historical data, Forecasts, Comma separated values, Graphical forms, File widget, Legend, Gridlines, Regression line, Neuron network, Recommendation, Control, Prediction, Recognition
-

This work is licensed under a Creative Commons Attribution-NonCommercial 4.0 International License.


