 Research Article
Forecast of the Accumulated Energy Index of cyclones at a global level until 2028
Ricardo Oses Rodríguez1*, Rigoberto Fimia Duarte2, Nancy Ruiz Cabrera1 and Julia Socarras Padrón1
1Climate Group of the Provincial Meteorological Center of Villa Clara, Cuba
2Faculty of Health Technology and Nursing (FTSE), Villa Clara University of Medical Sciences (UCM-VC), Cuba
Ricardo Oses Rodriguez, Climatological Department, Climate Group of the Provincial Meteorological Center of Villa Clara, Cuba
Received Date:August 22, 2024; Published Date:September 30, 2024
Abstract
One of the most important variables to know for the development of the cyclone season globally is the Accumulated Energy Index (ACE Index). In this work, this Index is modeled and forecast in the long term at a Global level for the period 2020 to 2028. With this forecast we can be alert about the risk of impact using local mathematical and statistical models. To carry out this work, we had a database of the ACE Index from 1990 to 2020. First, this Index was modeled with the help of the ROR methodology, and then a long-term forecast was made until the year 2024. The forecast data was included and the model was run predicting until the year 2028. Highly significant models with small errors are obtained that allow us to know how the Index will behave for the years from 2020 to 2028, the most dangerous years are 2024, and 2026 indicating the greatest risk of being affected by hurricanes globally and therefore more active seasons. Highly significant models are obtained with small errors that allow us to obtain the highest risk for the formation of cyclones at a global level. The trend of the Index is decreasing, and the model depends on the Index returned in 4 years. It may be related to the occurrence of the ENSO Event, which has a similar frequency.
Keywords:Forecast; Cyclones; Accumulated; Global Energy Index; ROR Regression
Introduction
Currently there are several methods to predict the occurrence of some phenomenon or result, which are included in predictive analysis [1]. Predictive analytics is a subdiscipline of data analytics that uses statistical techniques, such as computational learning or data “mining,” to develop models that predict future events or behaviors. These predictive models allow you to take advantage of behavioral patterns found in current and historical data to identify risks. This type of analysis is based on the identification of relationships between variables in past events, to then exploit these relationships and predict possible results in future situations. Doing this is not easy since it must be taken into account that the precision of the results obtained depends greatly on how the data analysis has been carried out, as well as the quality of the assumptions.
Trivially, it may seem that predictive analytics is the same as forecasting (which makes predictions at a macroscopic level), but no, it is something completely different. In a crude example, while a forecast can predict how many hurricanes may form in a year, predictive analysis can indicate what intensity and what time of year they are most likely to form, and even where. Therefore, to carry out predictive analysis it is essential to have a large amount of data, both current and past, to be able to establish behavioral patterns and thus induce knowledge. In the example above, there are more prediction probabilities if variations in regional and global temperature, wind direction, changes and sources of pressure change, etc. are also considered. This process is carried out thanks to computational learning. Computers can “learn” autonomously and in this way develop new knowledge and capabilities. This requires large databases and predictive analysis tools.
Currently there are several techniques applicable to predictive analysis; i) regression, which includes linear, nonlinear, and multivariable adaptive regression; support vectors, ii) computational learning, which includes neural networks, Naïve Bayes and K-nearest neighbors. One of these tools is the Regressive Objective Regression method that we will briefly explain later. Various applications are included in the bibliography, and the idea is to extend this type of analysis to social and epidemiological phenomena such as the COVID-19 epidemic in Santa Clara, Cuba using atmospheric pressure as an exogenous variable. Important work on the maximum wind and the probability of being affected by hurricanes in Cuba has been carried out in 2021 [2].” Among the causes that cause the maximum wind speed in Cuba are tropical cyclones (hurricanes), extra-tropical systems of the winter season (extra-tropical lows and cold fronts), severe local storms typical of summer and strong breezes due to the influence of continental and oceanic high pressures”, [3].
Some conclusions regarding the impact of hurricanes on Cuba suggest that the annual number of hurricanes that form in the Atlantic Ocean has a high interannual and multiannual variability. This variability has been associated with the changes in which they occur in the atmospheric and oceanic circulation., an increase in the formation of hurricanes in the Atlantic Ocean has been noted, mainly since the middle of the last decade of the last century [4]. Hurricanes are an inseparable part of the climate in Cuba and will continue to be a threat to the economy and society until they can be prevented and predicted with certainty. Regarding hurricane activity, the results achieved in recent years [5-7] indicate that it is possible and essential to prepare to face their danger and mitigate their attacks.
The objective of this work has been to model and forecast the long-term Global Accumulated Energy Index. With this forecast we will be able to be alert about the risk of impact using mathematical models and know the activity of this Global Cyclonic Activity Index.
Materials and methods
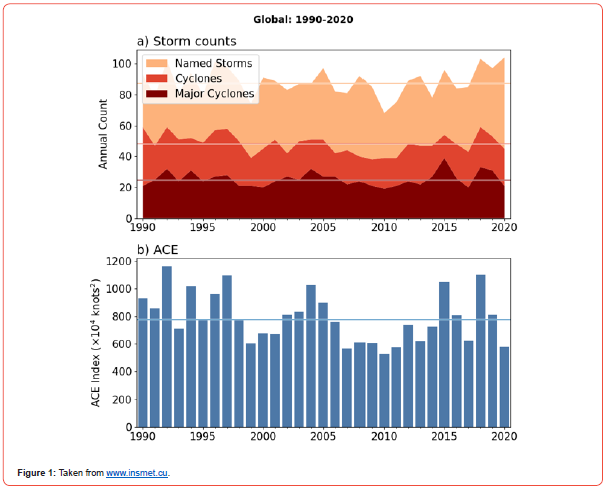
To carry out this work, a database of the Accumulated Energy Index (ACE Index) was used from 1990 to 2020, according to a graph created by the authors obtained from the website of the National Meteorological Institute of Cuba (www.insmet. cu), (Figure 1). This Index was modeled with the help of the ROR8-19 methodology, and then a long-term forecast was made. First, this Index was modeled with the help of the ROR methodology, and then a long-term forecast was made until the year 2024. Subsequently, the forecast data was included and the model was run predicting until the year 2028.

Results
The model obtained for ACE Index explains 98.5% of the variability with an error of 143.44. The Durbin Watson statistic is close to 2, so we are faced with a model that can describe the data since there is no autocorrelation in the residuals (Table 1).
The model in question is the following, Table 2. All variables are significant, DS is the sawtooth variable, DI is sawtooth but inverted, the tendency of the Index is to decrease, and the model depends on the returned Index. in 4 years (Lag4), which may be related to the occurrence of the ENSO Event, which has a similar frequency.
Table 1:Summary of the model c,d.

a. Predictors: Lag4, DI, NoC, DS
b. For regression through the origin (the model without intercept), R square measures the proportion of the variability in the dependent variable about
the origin explained by the regression. This CANNOT be compared to the R squared for models that include intercept.
c. Dependent variable: ACEIndexGlobal
d. Linear regression through the origin
Fisher’s F was 219.8, significant at 100%.
Table 2:Coefficientesa,b.

a. Variable dependiente: ACEIndexGlobal
b. Regresión lineal a través del origen
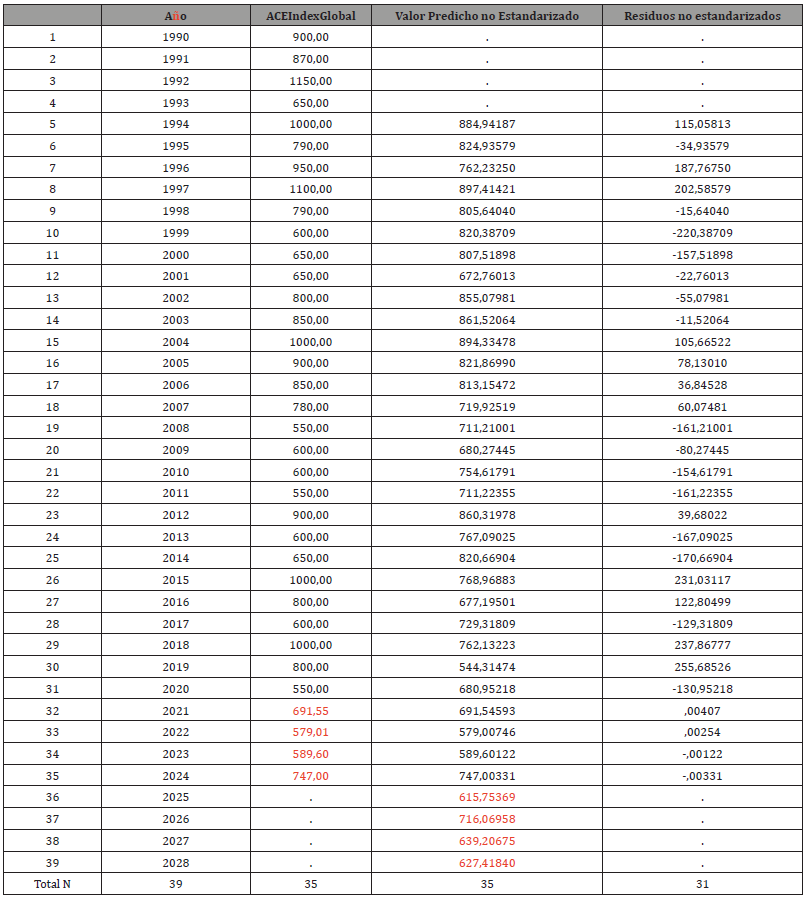
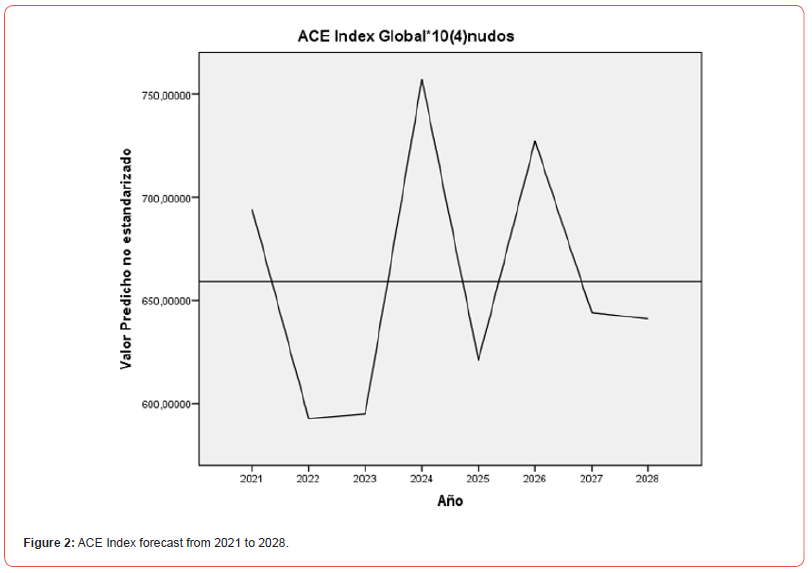
The long-term forecast can be seen in Table 3. The predicted values in the first and second runs are in red. Below, in Figure 2, the behavior of the Forecast until 2028. It can be seen that 2024 and 2026 are the years with the highest risk for the formation of cyclones at a Global level.
Table 3:Indicators and habitability zone

a.Limited to the first 100 cases.

Conclusions
Highly significant models are obtained with small errors that allow us to obtain the highest risk for the formation of cyclones at a global level. The tendency of the Index is to decrease, and the model depends on the Index returned in 4 years. It may be related to the occurrence of the ENSO Event, which has a similar frequency.
References
- C Espino Timón (2017) Análisis predictivo: técnicas y modelos utilizados y aplicaciones del mismo. Tesis, Universidad de Cataluña, Españ
- Instituto de Meteorologia 2021 Vientos máximos y probabilidad de afectación por huracanes en Cuba. Informe técnico del centro del clima La Habana.
- Roura P Sistachs, V Vega R, e Izquierdo D (2019 b) La Habana “Ciudad Maravilla” su historia desde la Meteorología a 500 años de su fundació Revista cubana de Meteorologia 25(3): 481-490.
- Planos E, Vega R, A Guevara (2013) Impacto del Cambio Climático y Medidas de Adaptación en Cuba. Instituto de Meteorología, Agencia de Medio Ambiente, Ministerio de Ciencia, Medio Ambiente y Tecnología, La Habana, Cuba, Impacto del Cambio Climático y Medidas de Adaptación en Cuba Primera Edición, pp. 430.
- Ricardo Osés Rodríguez, Rigoberto Fimia Duarte, Yanira Zaita Ferrer, Jose Iannacone, David del Valle Laveaga (2022) Mathematical Modeling and Its Applicability from Natural Disasters to Human Health. Sci Res Jr Med Sci 2(2): 32-40.
- Ricardo Osés Rodríguez, Meylin Otero Martin, Nancy Ruiz Cabrera, Rigoberto Fimia Duarte, Jose Iannacone (2018) Prognosis For Hurricane Irma through Regression Objective Regression and its Impact on the Vector Populations at the Meteorological Station of Caibarién, Villa Clara, Cuba. Revista Biotempo 15(1): 23-30.
- Osés Rodríguez Ricardo, Saura González Guillermo, Pedraza Martínez Alfredo (2012) Pronóstico de huracanes en el Mar Caribe utilizando la Regresión Objetiva Regresiva (ROR).
- Osés Rodríguez R, Fimia Duarte R, Otero Martín M, Osés Llanes C, Iannacone J, et al. (2018) Incidencia Del Ritmo Anual En Algunas Variables Climáticas En Poblaciones Larvales De Culícidos: Pronóstico Para La Temporada Ciclónica 2018 En Villa Clara, Cuba. The Biologist (Lima), supplement 2.
- Fimia Duarte R, Osés Rodríguez R, Iannacone J, Armiñana García R, Roig Boffill BV, et al. (2018) Modelación Matemática En Función De La Focalidad De Mosquitos (Diptera: Culicidae) Y La Presión Atmosférica En Villa Clara, Mediante La Regresión Objetiva Regresiva. The Biologist (Lima), supplement 2.
- Osés RR, Fimia DR, Saura GG, Otero MM, Jiménez LF (2014) Modelación de la densidad larvaria total de mosquitos (Diptera: Culicidae) utilizando tres modelos en la provincia de Villa Clara, Cuba. Redvet 15(8).
- Ricardo Osés Rodríguez, Rigoberto Fimia Duarte, Lisvette Cruz Camacho (2015) Simple Model to Estimate Longitude and Area of Universe. Open Access Library Journal 2(3): 1-4.
- Ricardo Osés Rodríguez (2022) Approximation of the Length of the Universe Calculated with the Cristosols Numbers. Journal of Mathematical & Computer Applications 1(2): 1.
- Osés Rodríguez R, Otero Martín M, Fimia Duarte R, Osés Llanes C, Burgos Alemán I, et al. (2018) Modelación Y Pronóstico Mensual Con 11 Años De Antelación De Las Precipitaciones Y Temperaturas Extremas Para Cuba. The Biologist (Lima).
- Osés Rodríguez R, Carmenate Ramírez A, Pedraza Martínez AF, Fimia Duarte R (2018) Prediction of latitude and longitude of earthquakes at global level using the regressive objective regression method. Adv Theo Comp Phy 1(3): 1-5.
- Osés RR, Aldaz CJW, Fimia DR, Segura OJJ, Aldaz CNG, et al. (2017) The ROR's methodology an it's possibility to find information in a white noise. Int J Curr Res 9(3): 47378-82.
- Osés Rodríguez R, Fimia Duarte R, Iannacone Oliver J, Saura González G, Gómez Camacho L, et al. (2016) Modelación de la temperatura efectiva equivalente para la estación del Yabú y para la densidad larval total de mosquitos en Caibarién, provincia Villa Clara, Cuba. Rev Peruana de Entomología 51(1): 1-7.
- Rigoberto Fimia Duarte, Jorge Luis Contreras Vidal, David Del Valle Laveaga, Ricardo Osés Rodríguez, Rafael Armiñana García, et al. (2021) Chapter 6 Study on the Methodology of Regressive Objective Regression According to the New SARS-CoV-2 COVID-19 Pandemic in the Municipality of Santa Clara and Cuba.
- Ricardo Osés Rodríguez, Rigoberto Fimia Duarte, David del Valle Laveaga, Luis E Jerez Puebla, Claudia Osés Llanes, et al. (2022) Methodology of the Objective Regressive Regression in Function of the Prognosis for Deaths, Critical, Severe, Confirmed And New Cases of Covid-19 In Santa Clara Municipality And Cuba. MEERP RRJ 03(01): 604-612.
- Ricardo Osés Rodríguez, RigobertoFimia Duarte, Claudia Osés Llanes, María Patricia ZambranoGavilanes, ThaináhBruna Santos Zambrano, et al. (2021) Forecast of New and Deceased Cases of COVID-19 in Cuba with an Advance of 105 Days. Acta Scientific Veterinary Sciences 3(7): 31-36.
-
Ricardo Oses Rodríguez*, Rigoberto Fimia Duarte, Nancy Ruiz Cabrera and Julia Socarras Padrón. Forecast of the Accumulated Energy Index of cyclones at a global level until 2028. Iris Jour of Astro & Sat Communicat. 1(4): 2024. IJASC.MS.ID.000516.
-
Forecast; Cyclones; Accumulated; Global Energy Index; ROR Regression
-

This work is licensed under a Creative Commons Attribution-NonCommercial 4.0 International License.


