 Research Article
Enhanced Removal of Pb (II) and Cr ((VI) Ions from Aqueous Solutions by Using Lignosulfonate-Graphene Oxide Porous Hydrogel Nancomposite (LGPH)
Farid Abu Shammala1* and Kelvin O’Halloran2
1Department of Chemistry, University of Palestine, Palestine
2Scientific Services and Data Systems, Australia
Farid Abu Shammala, Faculty of Pharmacy, University of Palestine, Gaza, Palestine.
Received Date: August 07, 2020; Published Date: August 31, 2020
Abstract
A green approach to the synthesis and functionalization of porous hydrogel nanocomposite (LGPH) by the reaction of graphite oxide (GO) with lignosulfonate (LS) as a coupling agent, were prepared and employed for adsorption and removal of (Pb(II)) and Cr(VI) ions from aqueous solution. The structural and chemical analysis of synthesized nanocomposites was conducted using different characterization techniques including: Transmission electron microscopy (TEM), Scanning electron microscopy (SEM), Atomic force microscope (AFM), Fourier-transform infrared spectroscopy (FTIR), Raman spectroscopy, X-ray diffraction spectroscopy (XRD), and X-ray photoelectron spectroscopy (XPS). Time profile, adsorbent dosage, adsorption isotherms, and isotherm parameters for Pb(II) and Cr(VI) ions adsorption on LGPH nanocomposite were studied. Effect of pH and ionic strength on adsorption were evaluated by varying the aqueous solution pH. Importantly, benefiting from the large surface areas of graphene oxide, and the abundant functional groups of LS, the prepared LGPH nanocomposite displayed 3D interconnected pores and exhibited an excellent adsorption capacity for Pb(II) (283.2mg/g) and Cr(VI) (142.25mg/g) ions from aqueous solution. Noticeably, the LGPH nancomposite was easily separated from water after the adsorption process, and the adsorption capacities of Pb(II) onto LGPH maintained 279.1 mg/g, Cr(VI) (140.26 mg/g) after 5 adsorption-desorption cycles.
Keywords: Graphene oxide; Lignosulfonate; Heavy metals; Nanocomposites; Adsorption
Introduction
The indiscriminate disposal of non-biodegradable heavy metals waste have received a paramount attention to environmental chemists due to their toxic nature. Heavy metals are usually present in trace amounts in natural waters but many of them are toxic even at very low concentrations [1]. Human activities have been found to the major contribute to environmental heavy metals pollution due to the everyday manufacturing of goods to meet the demands of the large population. The most common heavy metals are lead (Pb(II)) ions, generated from both natural and anthropogenic sources in large amounts, such as lead batteries, dyes, refineries, pulp indus tries, and other industrial effluents. Always found in the aquatic environment, is highly dangerous to the human health as well as to the environment [2,3]. Indeed, Pb(II) is very toxic to human beings and biota even at trace concentrations, exposure to Pb(II) might damage the central nervous system and brain and lead to death [4]. The maximum level of contaminantion of Pb(II) in drinking water is set at 15 μg L−1 by US Environmental Potential Agency (US EPA) [5]. In order to protect all the compartments of the environment, such as human health, animals, plants and soil, proper and careful attention should be given to remediation technologies of lead (Pb(II)) ions. Another toxic heavy metal pollutant is Chromium Cr(VI), chromium found in two oxidation states, III and VI. As compared to the III oxidation state, VI oxidation state of chromium is considered more toxic. Cr(VI) present mainly in the effluents of electroplating, leather tanning, textile industries, metal finishing, and chromate preparations [6]. World Health Organization (WHO) guideline for Cr(VI) in drinking water is 50 μg L−1 [6]. Exposure to elevated levels of Cr(VI) could lead to gastrointestinal disorders, liver, kidney and lung cancer, cardiovascular shocks, and other health related problems [6].
Most physical and chemical Pb(II) and Cr(VI) ions adsorption remediation technologies are not economically feasible, require handling of large amounts of sludge, which destroys the surrounding ecosystems and are very expensive. Therefore, it is necessary to investigate low-cost, effective alternatives. Adsorption is regarded as the most effective and economically viable option for the removal of heavy metal ions from aqueous solution. Carbon-based materials with porous structures find extensive use in many fields such as adsorption, separations, super capacitors, drug delivery, lithium ion batteries and sensing due to their distinctive properties [7-13]. Activated carbon is a highly effective alternative used for the adsorption of heavy metals from wastewater, but it is soluble under extremely acidic conditions [14]. It is only feasible for very dilute solutions, is labor intensive because it requires frequent regeneration and it is not selective in terms of metal attenuation [15]. One dimensional (1D) structures of carbon-based materials such as carbon nanotubes (CNTs), carbon nanofibers (CNFs) and carbon nanowires have been studied as adsorbents for the removal of aquatic pollutants [16-18]. Compared to 1D materials, that exhibit low adsorption potential, research has been directed to 2D materials, which possess higher surface area and show better adsorption potential than 1D materials. Graphene is a 2D material, which is a derivative of the carbon family and can exhibit high porosity. Graphene-based adsorbents have been widely explored in water treatment applications [19-22]. Porous graphene exhibits higher efficiency than pristine graphene because of the presence of porous structures on the graphene sheets which leads to higher surface area. Recently, self-assembled graphene materials including hydrogels and aerogels have been investigated as adsorbents. Hydrogels with three-dimensional network structures have attracted intense interest in wastewater treatment, due to its unique physical and chemical properties [23]. Graphene oxide (GO) shows good affinity with many soluble cationic or aromatic pollutants via electrostatic or π-conjugate interactions [24-25]. Nevertheless, the absorption capacity is greatly reduced due to the reduction in the number of reactive groups during the self-assembly process [26]. Thus, an effective method to enhance the absorption capacity is to increase the content of reactive groups of these materials. A reactive coupling agent, such as cellulose, lignosulfonate, and chitosan, are often incorporated into the graphene adsorbents to enhance their performance [27]. Lignosulfonate is the most popular compound due to its biodegradability, renewability, and good metal ion adsorption capacities [28]. For example, Yang et al. (2014) prepared a lignosulfonate-graphene oxide-polyaniline (LS-GO-PANI) by in situ polymerization using lignosulfonate and graphene oxide [29]. Li et al. (2016) reported a lignosulfonate-modified graphene hydrogel (LS-GH) fabricated from lignosulfonate and graphene oxide sheets via hydrothermal method [30]. Thus, utilization of nanomaterials such as graphene and graphine-based nanoparticles in water treatment has shown promise due to their superior adsorptive ability.
In the current study, the self-assembly strategy at low temperature was applied for fabrication and synthesis of lignosulfonate- graphene porous hydrogel nanocomposite (LGPH) was designed via incorporation of lignosulfonate (LS) as surface functionalization agent into graphene oxide (GO). The (LGPH) synthesized materials were analyzed by various characterization techniques to understand their physicochemical properties. The (LGPH) synthesized nanocomposites were investigated for the adsorption of Pb(II) ions and Cr(VI) ions from water. Optimization of experimental conditions (viz., contact time, solution pH, initial adsorbate concentration, adsorbent dosage and temperature) was performed using batch mode analysis. Different models (kinetic and isotherm) were fitted to identify the underlying adsorption mechanism.
Materials and Methods
Reagents and chemicals
All the chemical used in this study were prepared from Sigma Aldrich (St. Louis, Mo, USA) and Merck (KGaA, Darmstadt, Germany) and used without modification and without further purification. Natural graphite powder (325 mesh, purity of 99.95%), lignosulfonate (LS, C20H24Na2O10S2, MW 534.51), vitamin C (VC, purity of 99.5%), Pb(NO3)2, K2Cr2O7, and other reagents were of analytical grade. The experimental Pb(II) and Cr(VI) solutions was prepared by dissolving Pb(NO3)2 and K2Cr2O7 in deionized water, respectively.
Synthesis of graphene oxide
Graphene oxide (GO) was synthesized from natural graphite powder according to the procedures described by Hummers’s method (Hummers and Offeman 2002). Inorder to avoid aggregation of the GO during drying process, the GO sample was obtained first by freeze-drying. Then dried GO sample was dispersed in water by using ultrasonication for 1 h to get an aqueous dispersion at a concentration of 2.0 mg/mL. were prepared.
Synthesis of the nanohybrid LGPH
The adsorbent LGPH was prepared as follows. First, LS (20 mg), VC (200 mg), and GO aqueous dispersion (20 mL) were added to a 50 mL glass flask. The reaction mixture was stirred at room temperature until it became a stable suspension. The aqueous dispersions of the LS, VC, and GO were then heated at 60 °C for 2 h, a black cylinder-like LS-functionalized graphene hydrogel appeared at the bottom of the glass vessel. The mixture was then transferred to a 15 mL sealed glass bottle and autoclaved at 60 °C for 2 h, and the mixture was then ultrasonicated for 60 min, the mixture was stirred at 30 °C for 1 h. The final product was washed several times with deionized water and methanol. The autoclave was allowed to cool to room temperature, and the modified LGPH was then removed. A control samples of GO was prepared using the same procedure without the LS addition, be handled in the exact same manner throughout the tests.
Instrumentation measurements
FT-IR spectra were conducted on a Vertex 70 instrument (Bruker, Rheinstetten, Germany) at a resolution of 0.5 cm-1, and in the range of 500 cm-1 to 4000 cm-1. The atomic force microscope (AFM, Nanoscope III Veeco Co. Ltd., Santa Barbara, USA) was obtained to characterize the GO samples. Samples for AFM analysis were prepared on freshly cleaved mica. The X-ray diffraction (XRD) patterns of dried samples were measured with a Bruker D8 Advance diffractometer. The conditions of test were: the tube current and voltage at 20 mA and 30 kV, respectively, Cu target (λ = 0.15418 nm), and data were collected from the 2θ angular regions between 5° and 60°. The thermal stability of the dried samples was employed investigated using a TGA Q500 (TA Instruments, New Castle DE, USA). The samples were heated in an aluminum crucible to 650 °C at a heating rate of 20 °C/min. Surface morphology of dried samples was analyzed by scanning electron microscopy (SEM; Bruker) at 10 kV. The samples for SEM analysis were coated with a thin layer of gold (2 nm) by sputtering to promote conductivity before SEM observation. To observe the nitrogen adsorption isotherms at -196 °C, ASAP 2460 instrument was employed. The specific surface area was evaluated from the adsorption branch of the isotherm using Brunauer-Emmett-Teller theory (BET). The X-ray photoelectron spectroscopy (XPS) was performed on a Axis Ultra DLD spectrometer (Kratos, Manchester, UK) with monochrome Al Kα radiation (hν = 1486.6 eV).
Adsorption experiments
Approximately 100 mL of Cr(VI) or Pb(II) solution and the nanocomposite (8 mg) were loaded in a 200 mL conical flask and placed it in an air table with 200 rpm stirring speed at 25 °C for 12 h to reach equilibrium. The desired pH value was adjusted using 0.1 M HCl or 0.1 M NaOH solution. After the desired adsorption period (0 to 600 min), the nanocomposite was removed gently with forceps from the solution, and the concentration of Pb(II) and Cr(VI) after adsorption was measured using atomic absorption spectrophotometer (Z-2000, Hitachi Ltd., Tokyo, Japan).
Results and Discussion
TEM images
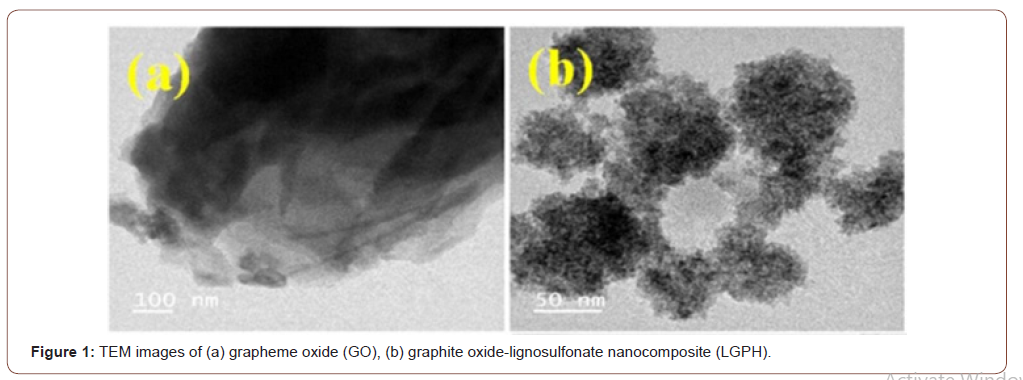
The morphologies and structures of GO and LGPH were observed by SEM and TEM, respectively. TEM images of nano-graphene oxide (GO) (Figure 1-a), and graphite oxide with lignosulfonate nanocomposite (LGPH) are illustrated (Figure 1-b). The specific surface area values of GO and LGPH were examined by BET analysis (Brunauer– Emmett–Teller) and the results are shown that the values of the specific surface area and the pore size of the GO were 64.32 m2 g−1 and 0.2392 cm3 g−1, respectively, and the values of specific surface area and the pores size of the LGPH were 110.44 m2 g−1 and 0.2839 cm3 g−1, respectively. The BET surface area of LGPH is larger than GO due to the surface of LGPH being rougher than MGO, after GO was modified using LS, which is also seen in the TEM images for GO and LGPH (Figure 1). As the figures indicate, graphene oxide has a plate structure and the LS are penetrated and spread over the grapheme oxide plates (Figure 1).
SEM images
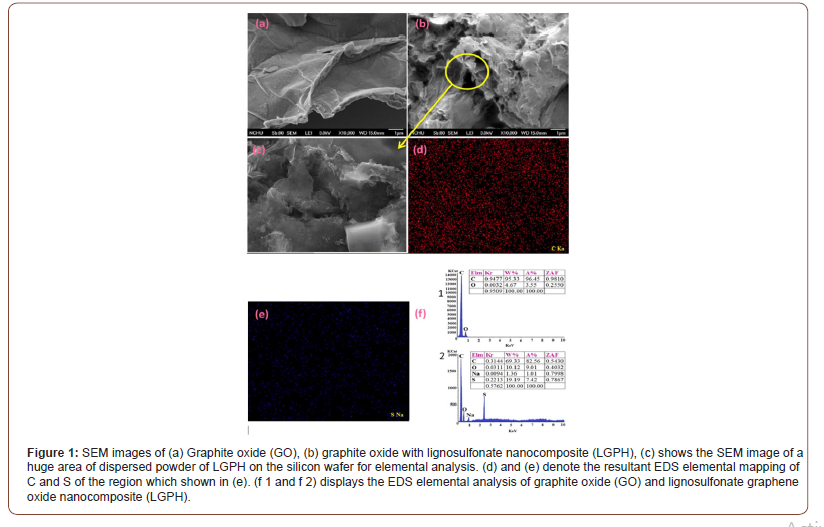
GO and LGPH morphology and microstructure of monolith were analyzed by scanning electron microscopy (SEM-S420, HITACHI) equipped with a field-emission electron gun. The SEM image of GO (Figure 2a) shows that the GO agglomerated into a two-dimensional multilayered structure with a smooth surface and lateral sizes of several nanometers, which demonstrates the large specific surface area of GO. The diverse layers can overlap and interweave with each other to form the bright and shaded areas on the GO surface. A much rougher surface and more wrinkled structure are found in the LGPH image (Figure 1b), and yet, the image was very similar to the GO SEM image. The cross-sectional analysis showed that the thickness of the GO sheets were in the ranges of 0.98 nm, which illustrated that the GO sheet was about one-atom-thick graphene oxide. SEM images results of freeze-dried samples of LGPH indicated a well-defined and interconnected 3D porous network as revealed by. The π-π stacking of GO sheets plays an important role in the formation 3D network porous structure. SEM analysis exhibited formation of interconnected 3D morphology and it can be noted that incorporation of LS with GO brought significant change in pore wall thickness and shrinkage in average size compared to those of GO. High magnification SEM image of hybrid samples showed the presence of needle-like LS in random direction which behave as compact skeleton within the dense and wrinkling type graphene sheets. Thus, it can be inferred that these surface decorated/adsorbed LS may promote roughness between adjacent graphene sheets that results in compact 3D assembly due to strong chemical interaction. Furthermore, the results of the LGPH nanocomposite indicaes the π-π conjugation and hydrogen bonding between graphene sheets and LS contributed to the successful construction of 3D porous structure. Thus, favoring the accumulation and adsorption of Pb(II) and Cr(VI) ions from aqueous samples . Moreover, the multilevel pore structure of LGPH provided large specific surface area (473.5 m2/g) that was higher than that of GO (261.7 m2/g). These findings were also confirmed by the nitrogen adsorption-desorption isotherms (Figure 2).
Consequently, the results indicated that the specific surface area of LGPH was larger than that of GO, improving the adsorption capacity to metal ion. Thus, the large surface area of LGPH contributes to the high adsorption capacity during the hydrothermal reaction. LS incorporated into graphene sheets through both covalent and non-covalent interactions, such as π-π conjugation and hydrogen bonding. The negatively charged LS molecules spread in the interlayer of graphene oxide sheets, thus prevents the restacking of graphene sheets through electrostatic repulsion.
AFM image and thickness
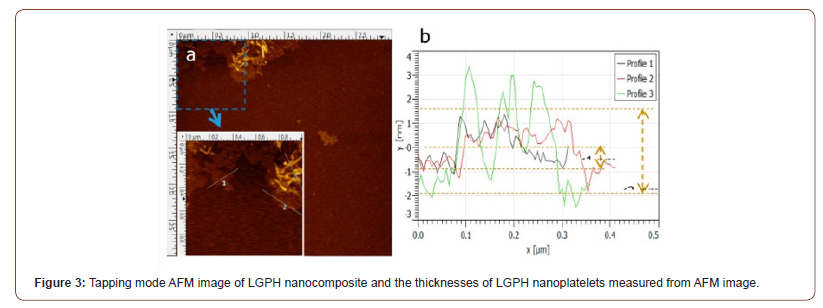
Atomic force microscope was performed to examine the in three-dimensional topography of our samples, and to provides various types of surface measurements. Figure 3 shows the morphology and thickness of LGPH nanocomposite by AFM. Figure 3 shows that LGPH nanocomposite samples typically had flake-like and sheet-like structures with less than 1 μm lateral size and the range of thickness of LGPH samples was between 1 to 3 nm. The layer-to-layer distance (d-spacing) of graphene oxide (GO) is 0.850 nm, which indicated that this LGPH nanocomposite sample typically has 1 to 3 layers. The lateral size of LGPH was typically less than 1 μm, which was less than that of graphene oxide (GO) made from natural graphene. The sonication can exfoliate the LGPH to fewer layers, and the nanoscaled LGPH nanocomposite may apply for conductive materials (Figure 3).
FTIR images
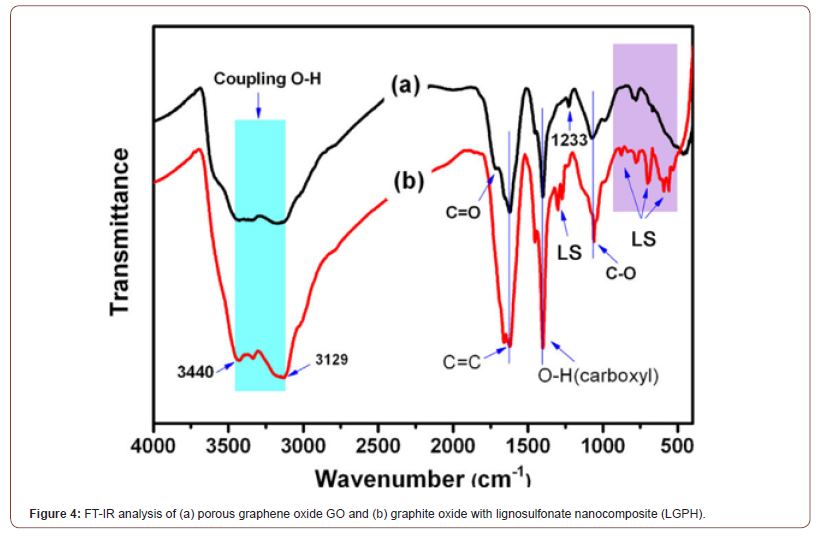
To investigation of the chemical structural changes from GO to LGPH and to gain insight into the formation chemistry of hybrid monolith and to investigate functional groups after the oxidation process of graphene and after the preparation of the LGPH nanocomposite. FTIR spectra of the different samples have been recorded as presented in Figure 4 a and b. The successful oxidation of graphene oxide was confirmed in Figure 4a, by the presence of various kinds of oxygen functionality such as peak at 3129-3440 cm−1 which are mainly originated from the stretching vibration of hydroxyl group (-OH). The peaks attributed to the deformation vibration of the tertiary (C-OH) groups appeared at 1400 cm−1. The peaks at 1598 cm−1 for carboxylic group (-C=O), the bands located at 1620-1630 cm−1 resulted from the (C=C) stretching mode of the graphitic domains. The peaks located at approximately 1225 and 1080 cm−1 correspond to the stretching vibrations of (C-O-C) and (C-O), respectively. The peaks at 1218 cm−1 for epoxy (C-O) stretching and alkoxy (C-OH) stretching at 1043 cm−1. The peaks located at approximately 1225 and 1080 cm−1 correspond to the stretching vibrations of (C-O-C) and (C-O), respectively. In addition, the peaks attributed to the deformation vibration of the tertiary C-OH groups appeared at 1400 cm−1. These hydrophilic groups on the surface are very important to improve the interaction between LS and GO sheets. As shown in Figure 4b the FT-IR spectra of LGPH, the peak at 3440-3129 cm-1 was due to the O–H stretching. The bands around 1350-1342 cm-1 are attributed to sulfonic acid groups. The bands between 839 and 608 cm-1 was due to the C-S stretching vibration. The characteristic peaks at 3213 cm-1 and 1598 cm-1 belonging to GO can also be observed in the spectra of GO and LGPH. Interestingly, spectra in Figure 3b showed shifting of the functional groups such as carboxyl band (C=O) from 1721 cm−1 to carboxylic starching 1727 cm−1 which confirmed the successful reaction between GO and LS after treatment. This indicated that there exist a certain number of functional groups on reduced GO sheets. Additionally, compared with the GO, the S=O symmetric stretching at 1023 cm-1 belonging to LS was also observed, which indicated the proposed formation of LGPH. The existences of sulfonic acid groups was evident from the FTIR spectra and these groups were responsible for improving its adsorption capacity to water and metal ions. The change at 3129- 3440 cm−1 could be ascribed to the strong interaction through hydrogen bonds and π-π conjugation between LS and GO sheets. This phenomenon is suggesting that the presence of LS plays important role for the self-assembly of monolithic material and promotes chemical interaction force, presumably, hydrogen bonding as evident from shifting of these functional groups, since we failed to obtain 3D monolith in the absence of LS. However, nature of hydrogen bonding between bare graphene sheets and/or between GO sheets and LS follows different routes. Compared to control sample, hybrid spectrum exhibits downshifting at starching vibration of hydroxyl (OH), carboxyl (C-O, C-O-C), and N-H bending vibration mode. This shift can be seen as synergy effect of strong hydrogen bonding between graphene sheets and LS, thus greatly influencing the microstructure morphology and mechanical and thermal properties of hybrid material. It can be inferred that strong chemical interaction between GO and LS is predominantly influenced by C=O⋯HO and N-H⋯OH type hydrogen bonding during the hydrothermal treatment. Moreover, shrinkage in OH starching was due to deoxygenation of graphene (Figure 4).
Raman spectra
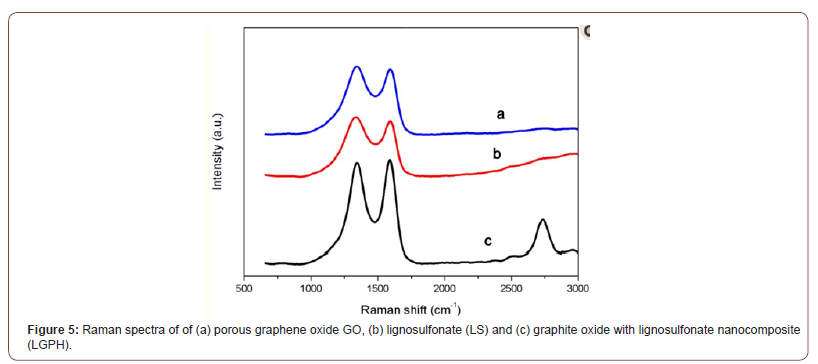
Raman spectroscopy is a very important characterization tool to analyze graphine materials because Raman scattering has a close relationship with the electron structure of the substances. Figure 5 shows the Raman spectra of of (a) porous graphene oxide GO, (b) lignosulfonate (LS) and (c) graphite oxide with lignosulfonate nanocomposite (LGPH). It is well known that the G peak at 1580 cm−1 is the characteristic peak of sp2 hybrid structure, which represents the symmetry and crystallizability of graphene materials; and the D peak at 1350 cm−1 is the defect peak, which represents the surface defect and disorder of graphite layers. In Figure 5c, the D peak of LGPH becomes stronger and broader due to a higher level of disorder among the graphene layers, and defects also seem to have increased during the oxidation process. The 2D band at 2700 cm−1 of LGPH is a second order two phonon process, which means few-layer graphene. When graphene has less than 5 layers, a 2D band can be distinguished in Raman spectrum. It indicated that the LGPH has few layers produced by catalytic graphitization process. The increase of ID/IG from 1.0 of LS to 1.2 of LGPH confirms the grafting of oxygen containing functional groups to the graphitic planes. After reaction treatment, ID/IG of LGPH from 1.2 of LS becomes 1.1, which indicates the reaction of most of the oxygen containing functional group during reaction between GO and LS. The reaction ID/ IG of LGPH is higher than that of LS due to the sp2 domains which are newly formed during reaction and smaller than those of LS (Figure 5).
XRD patterns
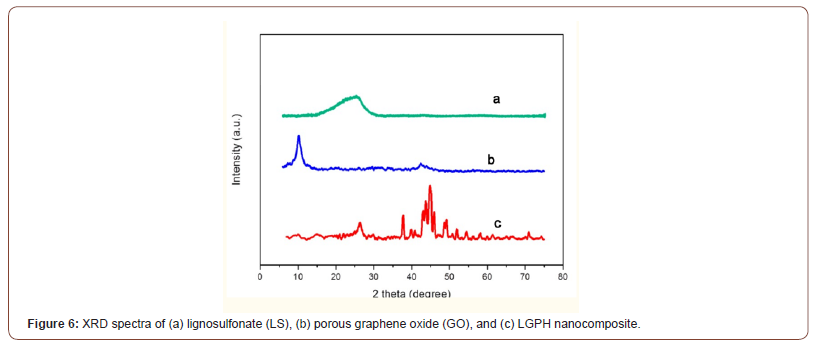
Figure 6 XRD spectra of (a) lignosulfonate (LS), (b) porous graphene oxide (GO), and (c) LGPH nanocomposite. The GO pattern (Figure 6b) showed a peak at ~10.7° corresponding to the (001) inter-planar spacing of 8.30 Å which caused by the oxygen-rich groups on both sides of the sheets and the water molecules trapped between the GO sheets. The calculated interlayer spacing of the freeze-dried GPH and LGPH was observed to be 3.69 Å, and 3.65 Å, respectively. This value was much lower than that of GO (8.30 Å), which suggested the presence of π-π stacking between graphene sheets in the composites and also the presence of a certain number of functional groups on reduced GO sheets. For GPH, the reduced GO sheets can encapsulate water in the process of self-assembly due to the presence of residual hydrophilic oxygenated groups. For LGPH, in addition to functional groups on reduced GO sheets, the hydrophilic groups of LS could also capture a multitude of water molecules. Because of this factor and the stacking of graphene sheets, the composites can be successfully synthesized by one-step method. Lignosulfonate (LS) XRD spectra shows a broad peak between 20° and 30° was attributed to its low graphitization and amorphous nature. Furthermore, there has been obvious distinction between the XRD patterns of GO, LS and LGPH, which indicated that LS was chemically reacted on GO surface (Figure 6).
XPS patterns
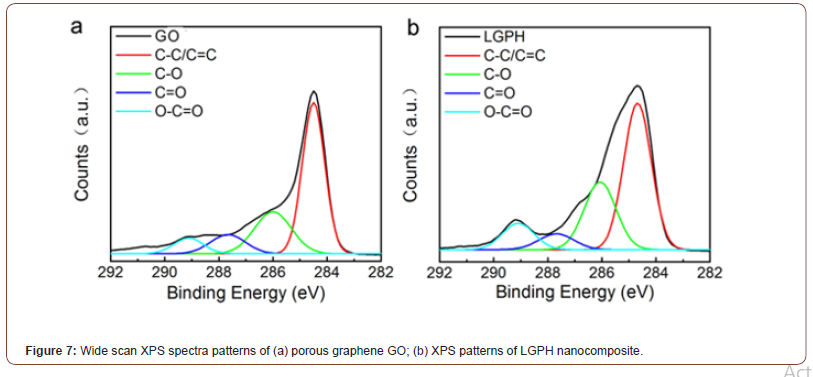
Figure 7 shows wide scan XPS spectra patterns of (a) porous graphene GO; (b) XPS investigate the elemental compositions of GO and LGPH nancomposites. As shown in Figures 7a and b, the C1s in the XPS spectra of GO and LGPH clearly illustrated the existence of four different types of carbons with various chemical valences: C-C/ C=C (284.6 eV), C-O (286.1 eV), C=O (287.7 eV), and C-O=O (289.1 eV). Compared to GO, the intensity of C-O peak in LGPH (286.1 eV) was increased, which revealed that LS incorporation was beneficial for improving the atomic contents of oxygen in LGPH and ultimately indicate the enhanced adsorption ability for Pb(II) and Cr(VI) ions by LGPH nanocomposite (Figure 7).
Time profile and adsorbent dosage for Pb(II) and Cr(VI) ions on LGPH nanocomposite
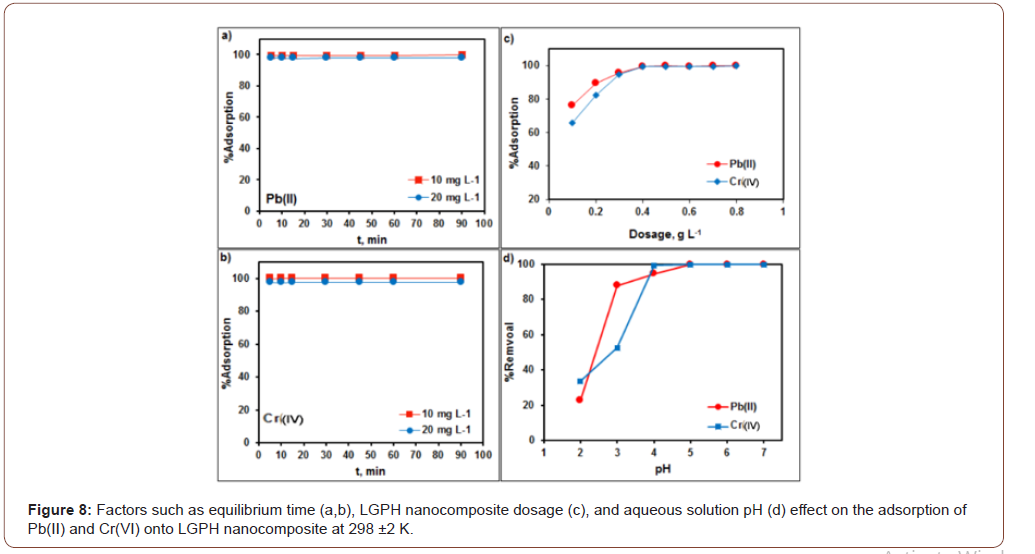
Figure 8a,b shows that the adsorption removal of Pb(II) and Cr(VI) with LGPH nanocomposite was rapid and immediately (within 5 min) reached 99% maximum adsorptive removal of Pb(II) and Cr(VI). As the contact time further increased to 90 min, the adsorption percentage becomes constant. Therefore, the contact time can be optimized to 30 min for both Pb(II) and Cr(VI) with LGPH nanocomposite, respectively. The effect of the adsorbent dosage (Figure 8c) on the adsorption of Pb(II) and Cr(VI) (10 mgL−1) was studied by varying the dosage from 0.1 to 0.8 gL−1at pH 5 for Pb(II) and pH 4 for Cr(VI). The obtained results revealed that the adsorption efficiency and adsorption capacity showed an inverse relationship with the LGPH nanocomposite dose. The maximum adsorption efficiency, 99.7% for Pb(II) and Cr(VI), was achieved with 0.4 g·L−1 LGPH dosage for Pb(II) and Cr(VI), respectively.
Effect of pH and ionic strength effect on adsorption
The effects of solution pH on the accumulation removal of Pb(II) and Cr(VI) onto LGPH nanocomposite were studied by varying the aqueous solution pH (Figure 8d). The adsorption of Pb(II) rapidly increased from pH 2.0 to 3.0, then slowly increased and reached maximum adsorption percentage at pH 4.0 to 5.0 for Pb(II). While the adsorption of Cr(VI) was not rapidly increased from pH 2.0 to 3.0, then slowly increased and reached maximum adsorption percentage at pH 4.0 for Cr(VI). At lower pH, the high H+ concentration was competitive with both metal ions that caused low adsorption. As the solution pH increased, the adsorption of metal ions on the LGPH nanocomposite increased due to the decreasing H+ ion concentration which acted as a competitor to the positive metal ions for adsorption sites on the surface of the nanocomposites. Moreover, adsorption experiments were not studied above pH 6.0 where the metal ions started to precipitate as their hydroxide complexes in aqueous solutions. Therefore, further adsorption studies of both metal ions, Pb(II) and Cr(VI), were studied at pH 5.0 and pH 4.0, respectively. The effect of ionic strength on the adsorption of both metal ions onto LGPH nanocomposite was studied using NaCl, KCl, and MgCl2 as background electrolytes ranging from 0.0 to 0.5 mg L−1. From our results, it was clearly observed that there were no significant changes that occurred in the adsorption of Pb(II) (10 mg L−1) and Cr(VI) (10 mg L−1) onto LGPH nanocomposite with the increase of the background ionic strength (Figure 8).
Evaluation of metal ions uptake characteristics of LGPH nanocomposite by the adsorption isotherms
After finding the optimum time, dosage, and pH of the metal ions, adsorption isotherm experiments were performed for the evaluation of the metal uptake mechanism and capacity. Various adsorption models such as Langmuir, Freundlich, and Tempkin were used for the experimental isotherms data as shown in Figure 9. The calculated isotherm parameters, correlation coefficient (R2) values, and standard deviations in the measurement were used for the evaluation of the suitability of the isotherms and are summarized in Table 1. The Langmuir adsorption isotherm data fit well with the experimental adsorption data compared to the other two models. The adsorption parameters are summarized in Table 1. Hence, the adsorption of Pb(II) and Cr(VI) onto LGPH nanocomposite was a monolayer chemisorption on the homogeneous surface. The adsorption capacity of LGPH nanocomposite was greater than that of GO alone due to the high electron transfer charge of LGPH nanocomposite by LS. The maximum adsorption capacity of LGPH nanocomposite at 298±2 K for Pb(II) and Cr(VI) was high, indicating LGPH nanocomposite to be a promising and better adsorbent for heavy metal adsorption. It was also clearly observed from Table 1 that the adsorption capacity of LGPH nanocomposite was higher than the GO indicates the synergistic enhancement of the adsorption metal ion onto LGPH nanocomposite. The high dsorption of LGPH nanocomposite may be due to the fact that the LGPH nanocomposite has a high surface area and high surface site density when compared with GO. The distribution of Pb(II) and Cr(VI) between the LGPH nanocomposite in equilibrium over a range of concentrations at three different temperatures (298–328 K) was studied. From the Langmuir isotherm model, the calculated maximum adsorption capacities (qmax) were increased as the temperature increased from 298 to 328 K for both metal ions. The increasing adsorption capacity with increasing temperature is associated with endothermic adsorption of metal ions onto LGPH nanocomposite at equilibrium. Hence, the adsorption process was favorable and rapid (Figure 9).
Table 1:Isotherm parameters of Pb(II) and Cr(VI) (Co= 2.0 to 25 mg·L−1) adsorption onto LGPH nanocomposite at 0.4 g·L−1 dosage and 298 ±2 K for 30 min (n= 3, mean).

Conclusion
A green novel approach to synthesis lignosulfonate-graphene (LGPH) porous hydrogel nanocomposite via solvothermal route and further investigated for the adsorptive removal of lead ions Pb(II) and chromate ions Cr(VI) from aqueous solution. The modification of graphene composite with lignosulfonate (LS) improved its adsorption sites, resulting in excellent Cr(VI) accumulation efficiency from aqueous solution Kinetic and isotherm studies revealed that pseudo-second-order and Langmuir models, respectively. The adsorption capacity of LGPH nanocomposite for Pb(II) ions was found to be 283.2 mg/g. In case of Cr(VI) ions, LGPH nanocomposite exhibited adsorption capacity of 142.25 mg/g. Thermodynamic analysis suggested that the adsorption was spontaneous and endothermic in nature. Lead adsorption was found to be low at acidic pH and reached a maximum at pH 5.0–7.0. Cr (VI) ions adsorption was a maximum at pH 4.0–7.0 and decreased with the increase in pH above 7.
Acknowledgement
None.
Conflicts of Interest
The authors declare no conflict of interest regarding the publication of this paper.
References
- Herawati N, Suzuki S, Hayashi K, Rivai IF, Koyoma H (2000) Cadmium, copper and zinc levels in rice and soil of Japan, Indonesia and China by soil type. Bulletin of Environmental Contamination and Toxicology 64: 33-39.
- He ZL, Yang XE, Stoffella P J (2005) Trace elements in agroecosystems and impacts on the environment. Journal of Trace Elements in Medicine and Biology 19 (2–3): 125-140.
- Musilova J, Arvay J, Vollmannova A, Toth T, Tomas J (2016) Environmental contamination by heavy metals in region with previous mining activity. Bulletin of Environmental Contamination and Toxicology. 97: 569-575.
- Sanders T, Liu Y, Buchner V & Tchounwou, P B (2009) Neurotoxic Effects and Biomarkers of Lead Exposure: A Review. Reviews on Environmental Health 24: 15-45.
- Agrawal A, Sahu, K, Pandey B (2005) Systematic studies on adsorption of lead on sea nodule residues. Journal of Colloid and Interface Science 281: 291-298.
- Nleya Y, Simate GS, Ndlovu S (2016) Sustainability assessment of the recovery and utilisation of acid from acid mine drainage. Journal of Cleaner Production 113: 17-27.
- Mohan D, Pittman C U (2006) Activated carbons and lowcost adsorbents for remediation of tri- and hexavalent chromium from water. Journal of Hazardous Materials 137: 762-811.
- Song D, Kaiwen Pan, Akash Tariq, Azizullah Azizullah, Feng Sun, et al. (2016) Adsorptive removal of toxic chromium from waste-Water using wheat straw and Eupatorium adenophorum. PLOS ONE 11: e0167037.
- Davis ME (2002) Ordered porous materials for emerging applications. Nature 417: 813-821.
- Tyagi A, Tripathi KM, Singh N, Choudhary S, Gupta RK (2016) Green synthesis of carbon quantum dots from lemon peel waste: applications in sensing and photocatalysis. RSC Advances 6: 72423-72432.
- Tripathi KM, Tran TS, Kim YJ, Kim T (2017) Green fluorescent onion-like carbon nanoparticles from flaxseed oil for visible light induced photocatalytic applications and label-free detection of Al(III) ions. ACS Sustainable Chemistry & Engineering 5: 3982-3992.
- Tripathi KM, Singh A, Bhati A, Sarkar S, Sonkar SK (2016) Sustainable feasibility of the environmental pollutant soot to few-layer photoluminescent graphene nanosheets for multifunctional applications. ACS Sustainable Chemistry & Engineering 4: 6399-6408.
- Niu Z, Liu L, Zhang L, Chen X (2014) Porous graphene materials for water remediation. Small 10: 3434-3441.
- Wasewar KL (2010) Adsorption of metals onto tea factory waste: a review. International Journal of Recent Research and Applied Studies 3(3): 303–322.
- Mohan D & Pittman C U (2006) Activated carbons and lowcost adsorbents for remediation of tri- and hexavalent chromium from water. Journal of Hazardous Materials 137: 762-811.
- Kumari S, Singh R P (2013) Glycolic acid-functionalized chitosan–Co3O4–Fe3O4 hybrid magnetic nanoparticles-based nanohybrid scaffolds for drug-delivery and tissue engineering. Journal of Materials Science 48: 1524-1532.
- Modi A, Bhaduri B, Verma, N (2015) Facile one-step synthesis of nitrogen-doped carbon nanofibers for the removal of potentially toxic metals from water. Industrial & Engineering Chemistry Research 54: 5172-5178.
- Asmaly H A et al. (2015) Evaluation of micro- and nano-carbon-based adsorbents for the removal of phenol from aqueous solutions. Toxicological & Environmental Chemistry 97: 1164-1179
- Mubarak NM, Sahu JN, Abdullah EC, Jayakumar NS (2014) Removal of heavy metals from wastewater using carbon nanotubes. Separation & Purification Reviews 43: 311-338.
- Gandhi M R, Vasudevan S, Shibayama A, Yamada M (2016) Graphene and graphene-based composites: a rising star in water purification - A comprehensive overview. Chemistry Select 1: 4358–4385.
- Perreault F, Fonseca de, Faria A, Elimelech M (2015) Environmental applications of graphene-based nanomaterials. Chemical Society Reviews 44: 5861-5896.
- Vilela D, Parmar J, Zeng Y, Zhao Y, Sánchez S (2016) Graphene-based microbots for toxic heavy metal removal and recovery from water. Nano Letters 16: 2860-2866.
- Wang S, Sun H, Ang HM, Tadé MO (2013) Adsorptive remediation of environmental pollutants using novel graphene-based nanomaterials. Chemical Engineering Journal 226: 336-347.
- Wang Y, Xiong Y, Wang J, Zhang X (2017) Ultrasonic-assisted fabrication of montmorillonite-lignin hybrid hydrogel: Highly efficient swelling behaviors and super-sorbent for dye removal from wastewater. Colloids and Surfaces A: Physicochemical and Engineering Aspects 520: 903-913.
- Yu Y, Murthy BN, Shapter JG, Constantopoulos KT, Voelcker N H, et al. (2013) Benzene carboxylic acid derivatized graphene oxide nanosheets on natural zeolites as effective adsorbents for cationic dye removal. Journal of Hazardous Materials 260: 330-338.
- Vu HC, Dwivedi AD, Le TT, Seo SH, Kim EJ, et al. (2017) Magnetite graphene oxide encapsulated in alginate beads for enhanced adsorption of Cr (VI) and As (V) from aqueous solutions: Role of crosslinking metal cations in pH control. Chemical Engineering Journal 307: 220-229.
- Xu T, Xue J, Zhang X, He G, Chen H (2017) Ultrafine cobalt nanoparticles supported on reduced graphene oxide: Efficient catalyst for fast reduction of hexavalent chromium at room temperature. Applied Surface Science 402: 294-300.
- Akram M, Bhatti H N, Iqbal M, Noreen S, Sadaf S (2017) Biocomposite efficiency for Cr (VI) adsorption: Kinetic, equilibrium and thermodynamics studies. Journal of Environmental Chemical Engineering 5(1): 400-411.
- Myglovets M, Poddubnaya O, Sevastyanova O, Lindström ME, Gawdzik B, et al. (2014) Preparation of carbon adsorbents from lignosulfonate by phosphoric acid activation for the adsorption of metal ions. Carbon 80: 771-783.
- Yang J, Wu J, Lu Q, and Lin T (2014) Facile preparation of lignosulfonate-graphene oxide-polyaniline ternary nanocomposite as an effective adsorbent for Pb(II) ions. ACS Sustainable Chemistry and Engineering 2(5): 1203-1211.
- Li F, Wang X, Yuan T, Sun R (2016) A lignosulfonate-modified graphene hydrogel with ultrahigh adsorption capacity for Pb (ii) removal. Journal of Materials Chemistry A4(30): 11888-11896.
-
Farid Abu Shammala, Kelvin O’Halloran. Enhanced Removal of Pb (II) and Cr ((VI) Ions from Aqueous Solutions by Using Lignosulfonate-Graphene Oxide Porous Hydrogel Nancomposite (LGPH). Insi in Chem & Biochem. 1(3): 2020. ICBC. MS.ID.000513.
-
Antitumor Activity, Novel Azole compound, Carcinoma, Swiss Albino Mice.
-

This work is licensed under a Creative Commons Attribution-NonCommercial 4.0 International License.


