 Research Article
β -Blockers Simultaneous Nanoadsorption From Aqueous Solution Via Dispersive Solid-Phase Microextraction With1-Butyl-3-Methylimidazolium Tetrachloroferrate Functionalized Graphene Oxide GO-(Bmim) Fecl4
Farid Abu Shammala1* and Barry Chiswell2
1Department of Analytical Chemistry, University of Palestine, Palestine
2National Research Centre for Environmental Toxicology, University of Queensland, Australia
Farid Abu Shammala, Faculty of Pharmacy, Department of Analytical Chemistry, University of Palestine, El-Zahra City, Gaza, Palestine.
Received Date: March 09, 2020; Published Date: March 18, 2020
Abstract
The objective of this work was the synthesis of graphene oxide functionalized with the ionic liquid 1-butyl-3-methylimidazolium tetrachloroferrate and to examine its adsorption efficiency for seven β-blockers: propranolol, timolol, atenolol, oxprenolol, alpreolol, acebutolol and carazolol. The results in this work revealed that the ionic liquid is covalently attached to graphene oxide sheets. Batch adsorption experiments indicate that all β-blockers studied were adsorped by GO-(Bmim) FeCl4 nanocomposite, compound hydrophobicity is an important predictor of adsorption, with propranolol, the most hydrophobic compound studied, adsorbed to the greatest extent. This highly sensitive and specific method gives a limit of detection (LOD) of 10-20 pg/L and limits of quantification between 20 and 60 ng/L, respectively. The linearity of the method was satisfactory, with mean determination coefficients of 0.993 and 0.999, respectively. In order to test the applicability of the proposed method in real-life samples, the effluent from a municipal wastewater were collected and spiked with seven β-blockers at concentrations equal to 2 and 10 times the LOQs and analyzed with HPLC. The method is straightforward, environmentally safe, exhibits high enrichment factors and satisfactory recoveries from wastewater. To the best of our knowledge, this is the first time that a MIL-GO is used for analytical purposes in a practical, efficient and environmentally friendly microextraction approach for seven β-blockers. The highest removal rate was observed for propranolol, timolol, alpreolol and carazolol, ranging from 98%+/-1.5% to 99%±1.2%, and the lowest was observed for atenolol, oxprenolol, and acebutolol, ranging from 84%±2.6% to 86%±1.7%, respectively..
Keywords: Ionic liquid; Graphene oxide; β-blockers; Microextraction
Introduction
Beta blockers β-blockers are a class of medications that are predominantly used to manage abnormal heart rhythms, and to protect the heart from a second heart attack (myocardial infarction) after a first heart attack (secondary prevention)[1]. They are also widely used to treat high blood pressure (hypertension) [2]. Betablockers work by temporarily stopping the body’s natural ‘fightor- flight’ responses, they reduce stress on certain parts of the body, such as the heart and the blood vessels in the brain. Betaadrenoceptor blocking drugs were discovered to be important therapeutic agents in the treatment of both angina pectoris and hypertension. Originally, these β-blockers share the common property of beta-adrenoceptor antagonism, though they may vary in terms of potency. They differ from one another in terms of their additional pharmacological properties, membrane stabilizing activity, cardioselectivity, and partial agonist activity [3]. The term cardioselectivity refers to the ability of some drugs, to block beta 1 receptors without blocking beta 2 receptors. This is important in patients with patients with peripheral vascular disease, obstructive airways disease, and patients with insulin-dependent diabetes during hypoglycemic crisis [4]. Partial agonist activity is the intrinsic activity that some drugs have to stimulate the beta adrenoceptor while they are competitively antagonizing catecholamines. In the other hand, they have less effect on resting heart rate, cardiac output, peripheral vascular blood flow, and resting respiratory function. As far as pharmacokinetic differences between drugs are concerned, lipid solubility is seen to be of increasing importance. The higher the water-soluble of the β-blockers the longer elimination halflives, the less variation in steady-state plasma concentrations, and the less penetration to the central nervous system [5-12].
Many of the carbon-based nanomaterials, such as: carbon nanotubes, fullerenes, nanofibers, nanohorns, graphene, and their chemically- modified analogues, has been investigated as an adsorption material. Due to their properties, these carbon-based nanomaterials have received huge applications in different areas of analytical chemistry and in many other techniques of medicine [13-16]. The unique structures of carbon-based nanomaterials allow them to interact with molecules via different non-covalent and covalent forces. These interactions includes hydrogen bonding, electrostatic forces, π−π stacking, van der Waals forces and hydrophobic interactions. Recently, graphene which is a novel and indeed fascinating carbon material, has sparked a tremendous research work from both the theoretical and experimental scientific societies [17]. Due to its extraordinary chemical properties and very high specific surface area, carbon-based nanomaterials have been extensively applied as adsorbents in solid-phase microextraction techniques and applications.
The ionic liquids has received a wide attention as an alternative to environmentally toxic organic solvents, it is increasingly applied in many techniques in analytical chemistry. These include nanoadsorpant techniques, different methods of chromatography, and electrochemistry science. Ionic liquids have many unique properties that can be changed by the proper choice of the building cations and anions species, these properties including its polarity, hydrophobicity and viscosity. Their chemical nature allows the synthesis of many different ionic liquid solvents with different properties for different applications and areas [18-22]. The impact of ILs in analytical chemistry resulted from their unique properties as negligible vapor pressure associated with high thermal stability, non-molecular solvents, tunable viscosity, good extractability in various inorganic and organic compounds, and miscibility with water and organic solvents. Modified materials, which consist of ionic liquid and magnetic composites, has been applied in many analytical chemistry extraction techniques [23]. One of the problem in the use of ionic liquids in chemistry applications is that at high temperatures the viscosity of the IL is reduced, therefore resulting in a flowing state in which the IL can be lost. Scientists overcomes this problem by the modification of the ILs to polymeric ILs (PILs). The PILs have unique properties such as higher thermal stability compared to monomeric ILs and indeed more resistance to flow. Moreover, PILs are tunable by proper functionalization and modification of the IL monomers, thus changing extractive capabilities along with their physicochemical properties [24-25].
Additionally, the combining the two above-mentioned fields, i.e., carbon-based nanomaterials and MILs, it is possible to design and develop new microextracting phases with outstanding properties for extraction of selected anabolic steroids and six β-blockers from water samples. The Functionalized carbon-based nanomaterials with MILs are expected to possess unique adsorbents advantages with tunable microextraction capabilities. This paper provides snapshot of our applications of magnetic ionic liquids (MILs) functionalized graphene oxide GO-MILs in microextraction, as an integral step of sample preparation for the removal of anabolic steroids and six β-blockers from water samples. The results obtained are accurate and highly reproducible, making it a good alternative approach for routine analysis of were applied to assess and detect the anabolic steroids and six β-blockers in water samples. The lowcost approach is straightforward, environmentally safe and exhibits high enrichment factors and absolute extraction percentages and satisfactory recoveries. To the best of our knowledge, this is the first time that a MIL-GO is used for analytical purposes in a practical, efficient and environmentally friendly MIL-GO microextraction approach for anabolic steroids and six β-blockers chemicals.
Experimental
Reagents and chemicals
Chemicals used such as graphite powder, KMnO4, NaNO3, H2SO4, HCl, DMF, standard substances in the chemical analysis and ionic liquids 1-butyl-3-methylimidazolium tetrachloroferrate were purchased from Sigma-Aldrich Chemical Co. six β-blockers were purchased from ANPEL Laboratory Technologies Incorporation (Shanghai, China). Chromatographic grade methanol, acetonitrile, and isopropanol were purchased from Sigma-Aldrich (St. Louis, MO). The aqueous solutions were prepared using deionized water (a Milli-Q water purification system from Millipore), methanol, dichloromethane, n-hexane and acetone used of HPLC grade. The glass fiber filters (GF/F, pore size 0.7 μm) were prebaked at 250 °C for 2h prior to use. The solid-phase microextraction sorbent GO-(Bmim) FeCl4 was prepared in our lab. Stock solutions of the anabolic steroids and six β-blockers s and standard were prepared in methanol at 1 mg/mL and stored in amber glass bottles at 4 °C.
Synthesis of ILs-modified GO composites
GO was prepared using the well known modified Hummers method, and MILs was prepared GO through amidation reaction between the carboxyl groups of GO and the amino groups of the MILs. 50 mg of GO was dispersed in 100 mL of deionized water by ultrasonication for 1 h. After 1hr 200 mg of EDC and 160 mg of NHS were added to ensure the homogeneity of the solution. Then, solution was magnetically stirred for 2 h to activate the carboxyl groups of GO, after that 200 mg of 1-butyl-3-aminopropyl imidazolium tetrachloroferrate was added and the mixture was then ultrasonicated for 60 min, the mixture was stirred at 30 °C for 1 h. The final product was washed several times with deionized water and methanol.
Instrumentation measurements
The morphology characterization of GO and the MIL-GO nanocomposites were obtained on a JEM-2010 transmission electron microscope (TEM, JEOL Ltd., Japan), a HITACHIS-4800 scanning electron microscope (SEM, Hitachi Co. Ltd., Tokyo, Japan). FT-IR spectra analysis were performed on a Thermo Nicolet iS50 Fourier-transform (FT) infrared spectrometer (Madison, WI, USA). Raman spectra analysis were performed on a Nicolet 6700/NXR FT-Raman spectrometer (Thermo Electron, USA) with a laser excitation of 532 nm. The X-ray diffaction (XRD) patterns were recorded with a Bruker D8-Advance diffractometer using Cu-Kα (λ= 0.15418 nm) in the 10–1000(2θ) range with a step size of 0.020. Field-emission scanning electron microscopy (FESEM) images were recorded on a Hitachi SU-8010 apparatus. The Brunauer–Emmett–Teller (BET) specific surface area was ascertained by a nitrogen adsorption data measured at 77K on a Quantach-rome NOVA4000 surface area analyzer. X-ray photoelectron spectroscopy (XPS) patterns were recorded on a Thermo Scientific Escalab 250Xi spectrometer with Al-Kα (1486.6V). HPLC analyses were performed using ultra-fast liquid chromatography (LC-30A, Shimadzu, Japan) with an auto sampler with deuterium lamp as the light source (228 nm), and. Separation column for the eight PAEs was Shimadzu shim-pack XR-ODS III (1.6 μm). The injection volume of phenols and standard were 5 μL, and the flow rate was 0.5 mL/min. Binary mobile phase were used in the separation, optimized using a of ultrapure water (solvent A) and acetonitrile (solvent B). The gradient elution program was: 0–3.5 min = 35% B, 3.5–4 min = 35–70% B, 4–6.0 min = 70% B, 6.0–7 min = 70–60% B, 7–9 min = 60% B, 9–9.0 min = 60–100% B, 9.0–15 min = 100% B.
SPE procedure and real sample preparation
20.0 mg of the GO-MILs nanocomposite was packed into a standard filter, to acted as a homemade SPE column. The column was preconditioned with 2 mL of methanol and 2mL of water. 10 mL of the sample solution was passed through the column at a flow rate of 0.5 mL/min. Then, the adsorbed six β-blockers were eluted with 1.0 mL of methanol and concentrated to dryness under a steam of nitrogen before detection. Fused silica and glass materials were used for the entire procedure to avoid any possible interferences. The quantification was based on external calibration with areas relative to the internal standard areas (at least eight calibration standard solutions, r 2 was always above 0.98). The concentrations determined were corrected for average blank value and relative recovery were recorded.
Results and Discussion
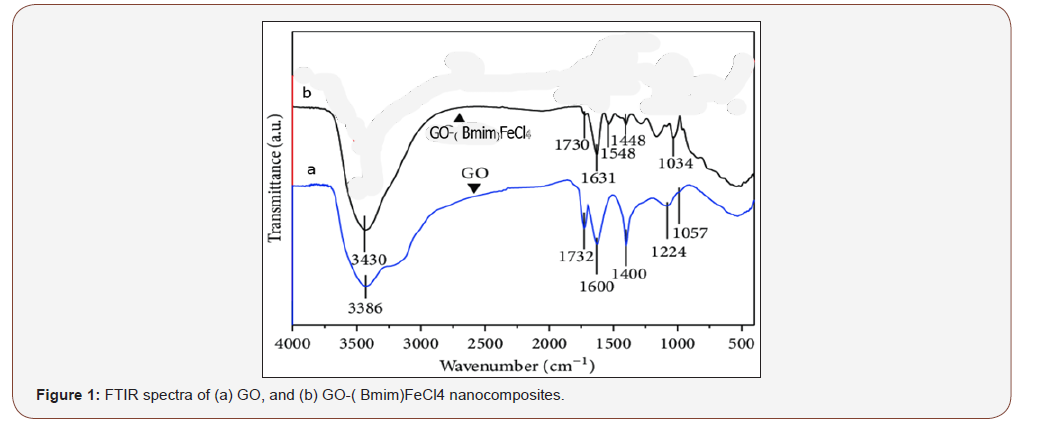
FT-IR analysis
Figure 1(a) shows the FTIR spectra of GO and Figure 1(b) shows the FTIR spectra of GO-(Bmim)FeCl4 nanocomposites. There are many surface functional groups are observed on the GO surface. The peak at approximately 3386 cm−1 is caused by stretching vibration of the –OH group on the surface of GO, after the GO reacted with (Bmim)FeCl4 this peak shifted to 3430 cm−1, thus indication of covalent bond formation. The peak at 1732 cm−1 which are caused by the C-O stretching vibration of the carboxyl group, and that at 1600 cm−1 is belongs to the C=C bonds in the aromatic groups. In Figure 1(b), the peak at 1034 cm−1 is attributed to ring in-plane asymmetric stretching of the imidazolium ring. The obvious peak at 1631 cm−1 and the peak at 1548 cm−1 associated with –CONH group. These results suggest that the MILs have been successfully grafted onto the GO surface to form GO-(Bmim) FeCl4 nanocomposites. Thus, FTIR results proved that the functional amine of ionic liquids were chemically bond with carboxyl group on the surface of graphene oxide. Moreover, the imidazolium ring of ionic liquids with alkyl chains offer large π-π and hydrogen-bond interactions and enhance electrostatic inter-sheet repulsion which result in an increase to the interaction capacity and connectivity between GO and (Bmim)FeCl4 (Figure 1).
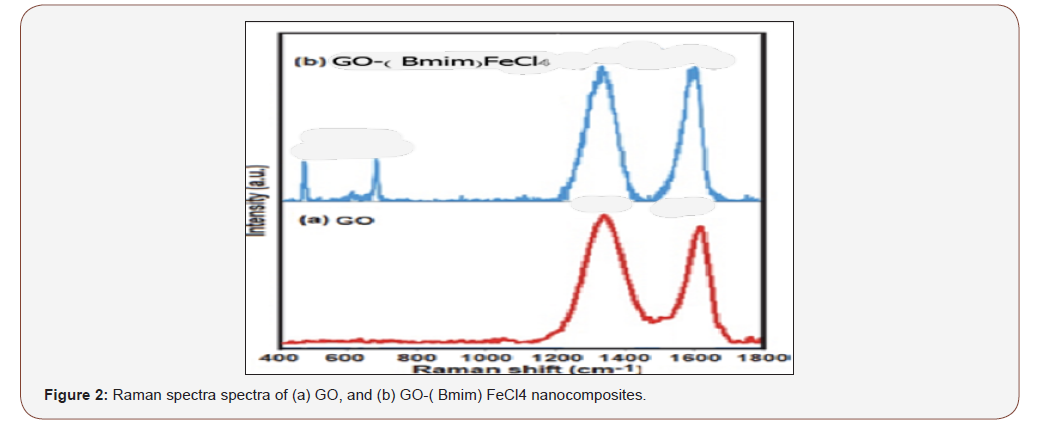
Raman spectrum of GO and GO-( Bmim)FeCl4 nanocomposite
Figure 2(a) shows the Raman spectra of GO and Figure 2(b) shows Raman spectra of GO-( Bmim)FeCl4 nanocomposites, with a laser excitation of 532 nm was used. In the two samples clearly visible and strong peaks were noticed at approximately 1595 cm−1 and 1353 cm−1 which assigned to the G and D bands, respectively. We noticed red-shift in the D-band of the Raman spectra of GO-(Bmim)FeCl4 nanocomposites , as shown in Figure 2(b). The red-shift phenomena is caused by the bonding between the C and N atoms, therefore changes the electronic structure of GO. Indeed, the intensity ratios of the two peaks (ID/IG) demonstrate the extent of defects on the GO surface caused by reaction with (Bapim)FeCl4 and can be used to reflect the extent of covalent binding. The ID/IG ratio of GO and the GO-( Bmim)FeCl4 nanocomposites are 1.01 and 1.07, respectively, corresponding to a slightly increased ratios of ID/IG. And thus an increase in disorder, and indicate the successful formation of amidation reaction between the GO and (Bmim)FeCl4 to form the final product GO-( Bmim)FeCl4 nanocomposites (Figure 2).
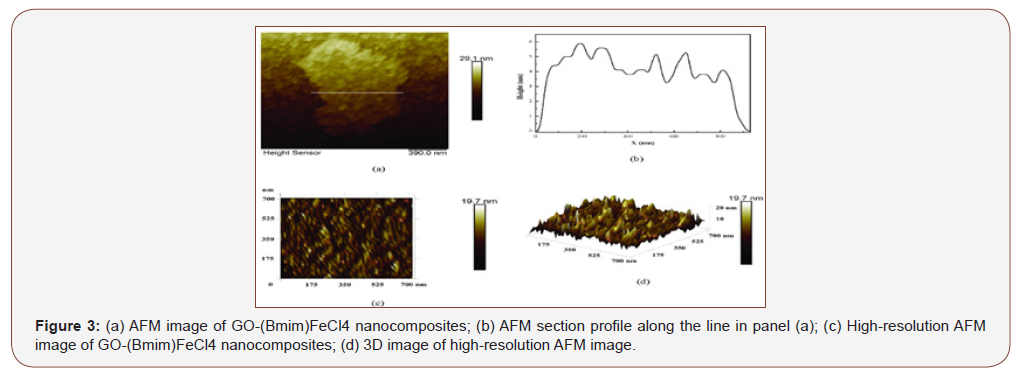
AFM image of GO, and GO-(Bmim)FeCl4 nanocomposites
Figure 3 (a) shows atomic force microscopy images (AFM) image of GO-(Bmim)FeCl4 nanocomposites; (b) AFM section profile along the line in panel; (c) High-resolution AFM image of GO-( Bmim)FeCl4 nanocomposites; and (d) 3D image of high-resolution AFM image. AFM image was performed inorder to examine the morphology of GO-( Bmim)FeCl4 nanocomposites after deposition of (Bmim)FeCl4 on the surface of GO. It can be seen from Figure 3 a single sheet of GO-( Bmim)FeCl4 of varying size. (Bmim)FeCl4 are deposited on the surface of GO substrate with clear overlaps. Before deposition of (Bmim)FeCl4 GO the thickness of GO vary in size from 1.0 to 1.3 nm. However, after functionalization with magnetic ionic liquid (MILs), the thickness of GO single layer sheets are obviously increased to nearly 2.1 – 2.5nm, indicating the presence of magnetic ionic liquid (Bmim)FeCl4 on the surface of GO sheet (Figure 3).
X-ray diffraction (XRD) analysis
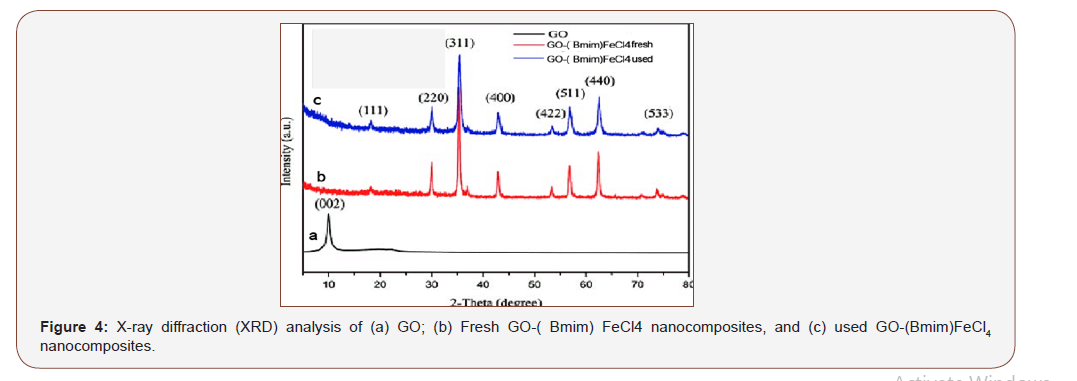
X-ray diffraction (XRD) analysis was performed to characterize the crystallographic structure of graphine, GO, the fresh and used GO-(Bmim)FeCl4 nanocomposites. As presented in Figure 4, the XRD pattern demonstrating the successful preparation of GO-(Bmim) FeCl4 nanocomposites (Figure 4-b and c). The used GO-(Bmim) FeCl4 nanocomposites displays the same diffraction pattern as the fresh sample with little decrease in intensity, which indicates that the crystal structure of the GO-(Bmim)FeCl4 nanocomposites is maintained after microeextraction. Moreover, the discernible diffraction peaks at about 9.30 belonging to GO can be detected in the pattern of GO-(Bmim)FeCl4 nanocomposites but with shift to the higher value, many other new peaks appear in Figure 4, suggesting a chemical covalent bond between GO and (Bmim)FeCl4 . Thus, the X-ray diffraction (XRD) analysis result indicates the chemical covalent bond formation during the incorporation of (Bmim)FeCl4 into the GO structure (Figure 4).
XPS scanning spectrum
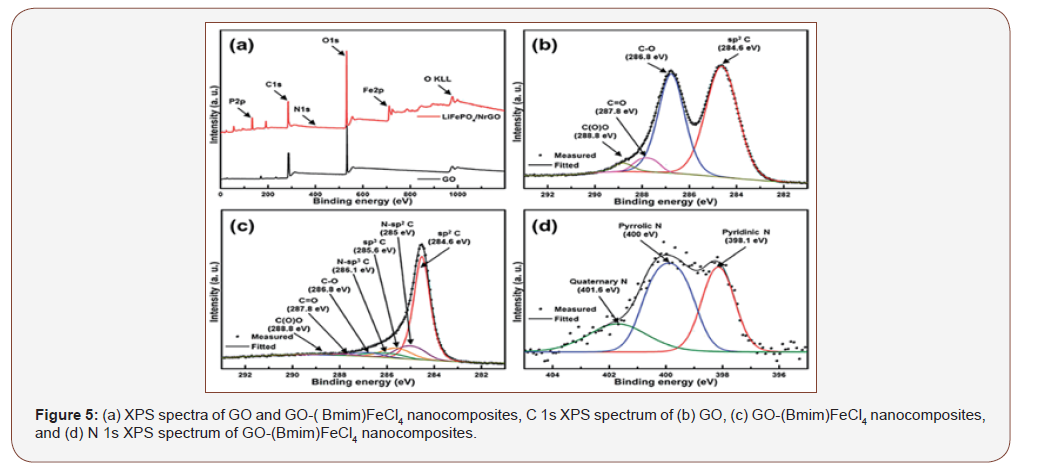
GO and the GO-(Bmim)FeCl4 nanocomposites were investigated by X-ray photoelectron spectroscopy (XPS). Figure 5 (a) shows that only the C1s and O1s peaks exist in GO (Figure 5a bottom). The C1s peaks are obtained by coupling the five peaks at 284.8, 285.5 286.8, 287.8, and 288.7 eV, assigned for C-C, C-OH, C-O, C=O, and O=C-OH, respectively. The N1s peak can be shown in GO-( Bmim)FeCl4 (Figure 4a above). Relative to GO, the peak fitting of C1s in GO-(Bmim) FeCl4 yields a new functional group (i.e., C-N, Figure 5c), which is indicted a successful amidation reaction between (Bmim)FeCl4 and GO. As shown in Figure 5-d, the N content increases from 0.68% to 5.10%, while the O content decreases, demonstrating a covalent amidation bonding between GO and the (Bmim)FeCl4. Similar results were obtained with the used GO-( Bmim)FeCl4 sample after microextraction of the phenolic endocrine disrupting chemicals (Figure 5).
SEM images and TEM images
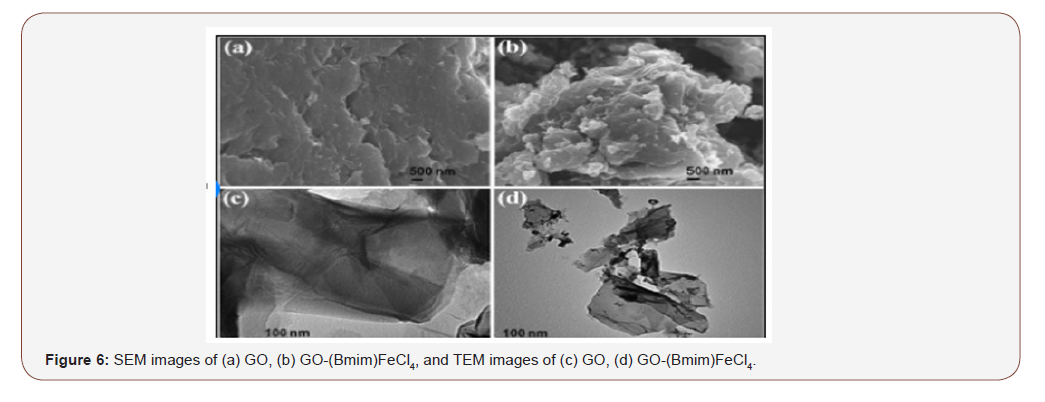
Figure 6 a and b shows SEM images of (a) GO, (b) GO-(Bmim) FeCl4 nanocomposites, respectively; and Figure 6 c and d depict TEM images of (c) GO and (d) GO-(Bmim)FeCl4 nanocomposites. As revealed in TEM and SEM images GO possesses a wrinkled single- layer structure with semitransparent flake-like shape. After being grafted by the MILs, the GO-(Bmim)FeCl4 nanocomposites still maintain the lamellar structure shown in Figure 6b and c, which ensures that they retain a high specific surface area and high adsorptive performance. An obvious change in the SEM images can be observed after reaction of GO with (Bmim)FeCl4, the large GO sheets are reduced to small pieces, thus giving the appearance of holes with different sizes. As seen clearly in Figure 6d, there are many micro and mesopores being formed on GO-(Bmim)FeCl4 surface. It was found that the pore size of GO-(Bmim)FeCl4 is the range of around 2.1 – 2.5nm. This appearance phenomenon can explain the novel nancomposites structure of GO-(Bmim)FeCl4, that have the advantage of the high adsorptive capacity of the six β-blockers (Figure 6).
The removal of six β-blockers by GO-(Bmim) FeCl4 nanocomposite
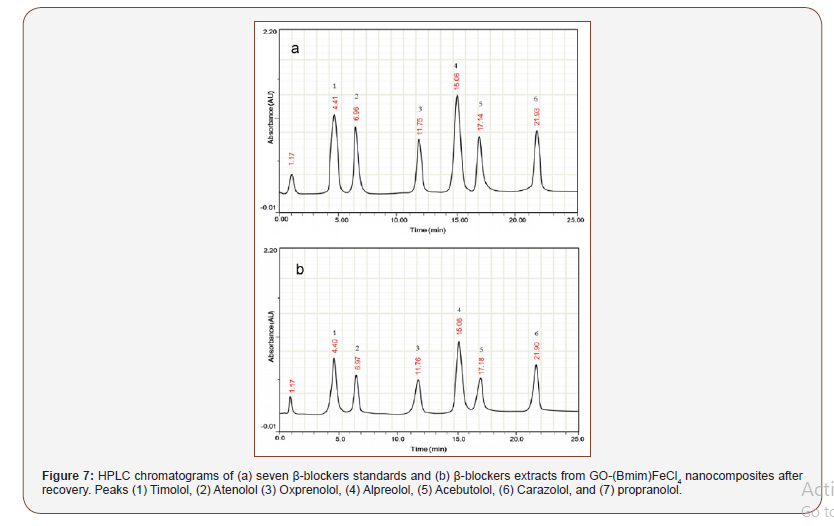
Figure 7-a shows HPLC chromatograms of seven β-blockers standard and Figure 7-b HPLC chromatograms of seven β-blockers extracted from GO-(Bmim)FeCl4 nanocomposites by solid phase nanoextracton. As shown in Table 1, we find that the GO-( Bmim) FeCl4 nanocomposites possess a superior nanoextraction capacity, mainly for propranolol, timolol, alpreolol and carazolol, with the removal efficiencies were above 98% even to 100%. The results indicated that GO-MIL adsorption capacities especially for atenolol, oxprenolol, and acebutolol significantly weaker, with the removal efficiencies were between 85% to 89%. Previous work have indicated that the nature of the anion and a decreased in carbon chain length of ILs are the primary influence to the adsorptive performance of the GO-MIL nanocomposites, the hydrophobic effect restrained the extraction process in the aqueous system [26, 27] (Figure 7 & Table 1-3).
Table 1:Characteristic of the patients with AED withdrawal (n=162).
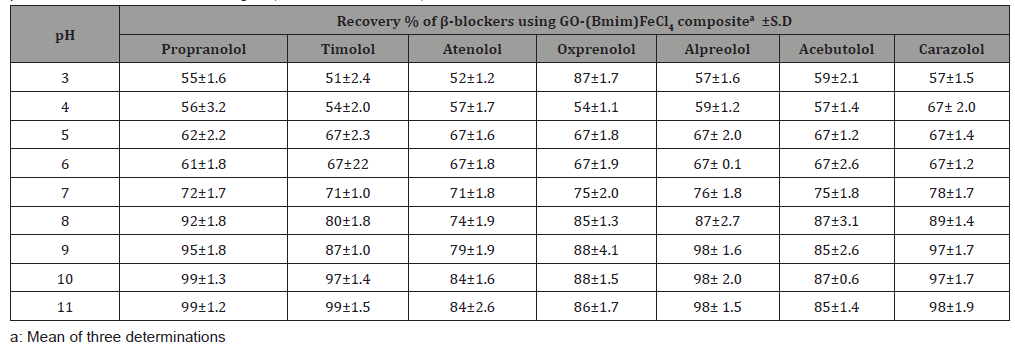
Table 2:The compared adsorption capacity of six β-blockers from aqueous sample with GO-MILs nanocomposites at different time interval. Seven β-blockers EDCs concentration was 20 ng/mL, and Incubation Time, 10 min.

Table 3:The compared adsorption capacity of six β-blockers from aqueous sample with GO-MILs nanocomposites at different salt concentration. Seven β-blockers concentration was 20 ng/mL, and Incubation Time, 10 min.

The influence parameters for pH values, elution time, and salt concentration were evaluated to find the optimal extraction performance of the GO-(Bmim)FeCl4 for the extraction of β-blockers. In our laboratory, the extraction capability of GO-(Bmim)FeCl4 for the β-blockers were tested in the range of 3.0–11. As shown in Table 1, the adsorption capacity (mg/g) clearly increased as the pH increased from 3.0 to 9.0. Therefore, a pH of 9.0 was chosen for the next adsorption tests. It is noteworthy, that HPLC peak areas decreased as the pH became greater than 9.0. Moreover, HPLC chromatogram revealed that β-blockers are relatively independent of changes to the sample solution pH in the range of 2.0–10, because they exist as neutral molecules. It is important to mention that the pH value primarily influences the charge of the ionic liquids and other functional groups such as hydroxyl, carboxyl groups and epoxide on the surface of GO. Table 2 shows the effect of elution time on the extraction performance by changing the washing time from 1 min to 5 min. our experimental results revealed that the best elution time was 4. Thus, elution time was set to 4 min to ensure balance between optimum time and efficiency. Experiments were conducted to examine the effect of an anionic surfactant, sodium dodecyl benzene sulfonate (SDBS), on adsorption. As shown in Table 3, results indicate that SDBS significantly increases the adsorption of all β-blockers specially propranolol. This result is potentially important because surfactants such as SDBS are likely to be present in wastewater effluents with beta blockers and could influence their mobility in the environment. As indicated in Table 3, the SDBS concentration is a significant factor that influences the extraction capabilities, with 1% (w/v) SDBS added to the sample solution, the extraction performance of most of the seven β-blockers reached a maximum. This result may be occurred due to the salt-out effect, which usually promotes extraction. However, when the SDBS concentration exceeds 2% (w/v), the mass transfer process in the solid/ liquid interface becomes inhibited from the increased viscosity, leading to a reduction of the diffusion rate of the β-blockers, which decreases the extraction efficiency. For this reason, 1% (w/v) SDBS was added to the β-blockers sample solution.
Validation of the method
The analytical parameters for the GO-(Bmim)FeCl4 nanocomposites nanoextraction of the β-blockers, such as linearity, correlation coefficients (r2), limits of detection (LODs), limits of quantitation (LOQs) and repeatability were tested under the optimal experimental conditions by using a series of spiked natural water samples. As indicated in Table 4, the linearity of the β-blockers ranged from 2 ng mL−1 to 200 ng mL−1, with the correlation coefficients exceeding 0.99. The LODs and LOQs were defined as the corresponding concentration equivalent to three and ten times the signal-to-noise ratios, in our results ranged from 0.02 ng mL−1 to 0.88 ng mL−1 and from 0.06 ng mL−1 to 2.94 ng mL−1, respectively. The sensitivity of the method, with the use of a UV detector, is quite satisfying, mainly because the detector is easily available to most analytical laboratories. The reproducibility of the method was determined by intra-day RSDs (n = 3) and inter-day RSDs (n = 3) at a spiked sample concentration of 50 ng mL−1. The two RSD values were always less than 8.0%. Indeed, all of our results indicated a high sensitivity and good reproducibility of this new method (Table 4).
Conclusion
This research highlights the preparation of novel types of GOMILs nanocomposite for use in SPME of seven β-blockers disruptors from aqueous solution. In our research, a magnetic ionic liquid modified graphene oxide nanocomposites were prepared through a direct amidation reaction between GO and MIL. The prepared nanocomposites were used as the nanoadsorbent in a fixed-bed column, which possessed the advantages of low column pressure and high nanoadsorption capacity. Moreover, the system was successfully applied to the microextraction of seven β-blockers from aqueous samples with good reproducibility, wide linear range and low LODs using a standard HPLC-UV detector. The proposed method provides a reliable method for the removal and determination of β-blockers in aqueous solution, which can be applied in water treatment and the regulation of supplies.
Acknowledgement
N1.411 mmone.
Conflict of Interest
The authors declare no conflict of interest regarding the publication of this paper.
References
- Freemantle N, Cleland J, Young P, Mason J, Harrison J (1999) Beta Blockade after myocardial infarction: systematic review and meta regression analysis. BMJ 318(7200): 1730-1737.
- James P A, Oparil S, Carter P L, Cushman W C, Dennison-Himmelfarb C, et al. (2014) Ortiz Evidence-based guideline for the management of high blood pressure in adults: report from the panel members appointed to the Eighth Joint National Committee (JNC 8). JAMA 311(5): 507-520.
- Jonas LS, Malte P, Camille B, Anna J, Gunnar N, et al. (2019) Fate of Trace Organic Compounds in the Hyporheic Zone: Influence of Retardation, the Benthic Biolayer, and Organic Carbon. Environmental Science & Technology 53(8): 4224-4234.
- Zhe L, Anna S, Michael R (2016) Fate of Pharmaceuticals and Their Transformation Products in Four Small European Rivers Receiving Treated Wastewater. Environmental Science & Technology 50(11): 5614-5621.
- Thomas L, Sylvia G, Wolfgang S, Thomas L, AngelaK, et al. (2016) New (Practical) Strategies in Target, Suspects, and Non-Target LC-MS(/MS) Screening: Bisoprolol and Transformation Products as an Example 2: 85-101.
- Zhe Li, Anna S, Michael R (2015) Flume Experiments to Investigate the Environmental Fate of Pharmaceuticals and Their Transformation Products in Streams. Environmental Science & Technology 49(10): 6009-6017.
- Justin TJ, Zackary LJ, Jonathan OS, David LS (2014) Biotransformation of Trace Organic Contaminants in Open-Water Unit Process Treatment Wetlands. Environmental Science & Technology 48(9): 5136-5144.
- Jeffrey HW, Antweiler RC, Ferrer I, Ryan JN, Michael ET (2019) In-Stream Attenuation of Neuro-Active Pharmaceuticals and Their Metabolites. Environmental Science &Tech 53(8): 4224-4234.
- Cong Y., Shan H, Wei Y, Jinming D, Jing C (2013) Insights into Propranolol Adsorption on TiO2: Spectroscopic and Molecular Modeling Study. The Journal of Physical Chemistry C 117(11): 5785-5791.
- Steven TJD, Kai Uwe G (2013) Ion-Exchange Affinity of Organic Cations to Natural Organic Matter: Influence of Amine Type and Nonionic Interactions at Two Different pHs. Environmental Science & Technology 47(2): 798-806.
- Jingjing D, Chuanyong J (2013) Insights into Interactions of Propranolol with Nano TiO2 2: 101-120.
- Eloy C, José AG, Rosa MR, Francesc C, Conchita A, et al. (2011) Mineralization of Metoprolol by Electro-Fenton and Photoelectro-Fenton Processes. The Journal of Physical Chemistry A 115(7): 1234-1242.
- Zhu Y, Shanthi M, Weiwei C, Xuesong L, Ji WS, et al. (2010) Graphene and graphene oxide: synthesis, properties, and applications. Adv Mater 22: 3906-3924.
- Stoller MD, Park S, Zhu Y, An J, Ruoff RS, et al. (2008) Graphene-based ultracapacitors. Nano Lett 8: 3498-3502.
- Dikin D A et al. (2007) Preparation and characterization of graphene oxide paper. Nature 448: 457-460.
- Liu Z, Robinson J T, Sun X, Dai H P (2008) Gylated nanographene oxide for delivery of water-insoluble cancer drugs. J Am Chem Soc 130: 10876-10877.
- Wang J, Chen Z, Chen B (2014) Adsorption of polycyclic aromatic hydrocarbons by graphene and graphene oxide nanosheets. Environ Sci Technol 48: 4817-4825.
- Plechkova NV, Seddon KR (2008) Applications of ionic liquids in the chemical industry. Chem Soc.
- Anderson JL, Ding R, Ellern A, Armstrong DW (2005) Structure and properties of high stability geminal dicationic ionic liquids. J Am Chem Soc 127: 593-604.
- Fan T, Zhao C, Xiao Z, Guo F, Cai K, et al (2016) Fabricating of high-performance functional graphene fibers for micro-capacitive energy storage. Sci Rep 6: 29534.
- Zhou X, Zhu A & Shi G (2015) Selective extraction and analysis of catecholamines in rat blood microdialysate by polymeric ionic liquid-diphenylboric acid-packed capillary column and fast separation in high-performance liquid chromatography-electrochemical detector. J Chromatogr A 1409: 125-131.
- Tamilarasan P, Ramaprabhu S (2015) Integration of polymerized ionic liquid with graphene for enhanced CO2adsorption. J Mater Chem A 3: 101-108.
- Ye YS, Chi-Yung T, Wei-Chung S, Jing-Shiuan W, Kuan-Jung C, et al. (2011) A new graphene-modified protic ionic liquid-based composite membrane for solid polymer electrolytes. J Mater Chem 21: 10448-10453.
- Li B, Rooney DW, Zhang N, Sun K (2013) An in situ ionic-liquid-assisted synthetic approach to iron fluoride/graphene hybrid nanostructures as superior cathode materials for lithium ion batteries. ACS Appl Mater Interfaces 5: 5057-5063.
- Valentini F, D Roscioli, M Carbone, V Conte, B Floris, et al. (2012) Oxidized graphene in ionic liquids for assembling chemically modified electrodes: a structural and electrochemical characterization study. Anal Chem 84: 5823-5831.
- Long L, Sheng G, Zhiyi J, Yankiang Z (2019) Amide functionalized ionic liquids as curing agents for epoxy resin: Preparation, characterization, and curing behaviors with TDE-85. Industrial and Engineering Chemistry Research 10: 1021-1028.
- Mara GF, Pedro JC, Ana MF, Isabel MM, Queimada AJ, et al. (2007) Surface tensions of imidazolium based ionic liquids: Anion, cation, temperature and water effect. Journal of colloidal and Interface Science 314(2): 621-630.
-
Farid Abu Shammala. β -Blockers Simultaneous Nanoadsorption From Aqueous Solution Via Dispersive Solid-Phase Microextraction With1-Butyl-3-Methylimidazolium Tetrachloroferrate Functionalized Graphene Oxide GO-(Bmim) Fecl4. Insi in Chem & Biochem. 1(1): 2020. ICBC. MS.ID.000508.
-
Analytical Chemistry, Pharmacy, Hydrophobic compound, Ionic liquid, Nanocomposite, Propranolol, Timolol, Alpreolol, Carazolol, Ionic liquid, Graphene oxide, β-blockers, Microextraction.
-

This work is licensed under a Creative Commons Attribution-NonCommercial 4.0 International License.


