 Research Article
A Sensıtıve and Sımple Spectrofluorımetric Method for Analysıs Antı-Hypertensıve Drugs in Pharmaceutıcal Preparatıons
A Hakan AKTAŞ* and Tuğçe PEKUZ
Süleyman Demirel University, Department of Chemistry, Turkey
A Hakan AKTAŞ, Süleyman Demirel University, Science and Art Faculty, Department of Chemistry, Isparta, Turkey
Received Date: January 24, 2020; Published Date: January 29, 2020
Abstract
This work describes a simple, sensitive and reliable spectrofluorimetric method for the simultaneous determination of two anti-hypertensive drugs; benazepril. HCl (BEN) and hydrochlorothiazide (HCT) in their combined tablets. The method involved measurement of the native fluorescence at 389 nm (λEx 358 nm) and 389 nm (λEx 360 nm) for BEN and HCT respectively. Analytical performance of the proposed spectrofluorimetric procedure was statistically validated with respect to linearity, ranges, precision, accuracy, selectivity, detection and quantification limits. Regression analysis showed good correlation between fluorescence intensity and concentration over the concentration ranges 1.0-5.0 and 1.25-6.25 μg mL-1 for BEN and HCT, respectively. No interference was observed from common pharmaceutical additives. .
Keywords: Benazepril HCl; Hydrochlorothiazide; Spectrofuorimetry
Introduction
Hypertension is defined as the presence of blood pressure within 140/90 mm Hg. High blood pressure can be seen at any age from infancy. Hypertension, primary (primary, idiopathic, basic) and secondary (secondary) is divided into two. Cases of hypertension (approximately 95%. Five percent of cases are secondary hypertension, most of which are renal. The drugs used to treat hypertension are called antihypertensive drugs. Benazepril. HCL and hydrochlorothiazide for use in this study is a combined antihypertensive method. The literature survey reveals that several methods were reported for the individual estimation of BEN and HCT. Several methods have been published for the determination of BEN and HCT in pharmaceutical formulations and biological samples including spectrometry and spectrofluorimetric [1,2] spectrofluorometric [3] and fluorescence probe for selective determination of HPLC [4].
The aim of this study is to apply simultaneously spectrofluorimetric method development antihypertensive agent determination for accurate, sensitive and reproducible analysis results. A good coincidence was observed in the application of method to the simultaneous quantitation of BEN and HCT in artificial mixtures (Figure 1).

Materials and Methods
Apparatus
A Shimadzu (ModelRF-5301PC) spectrofluorophotometer (Kyoto, Japan), equipped with1cm matched quartz cells was used for spectrofluorimetric measurements.
Standard solutions
All materials used were of analytical grade. Stock solutions of 10 mg/100mL BEN and HCT were prepared in methanol. The solutions were stable for the least two weeks if they had been stored in a cool (<25°C) and dark place.
Results and Discussions
Spectral characteristics and optimization of fluorescence measurement
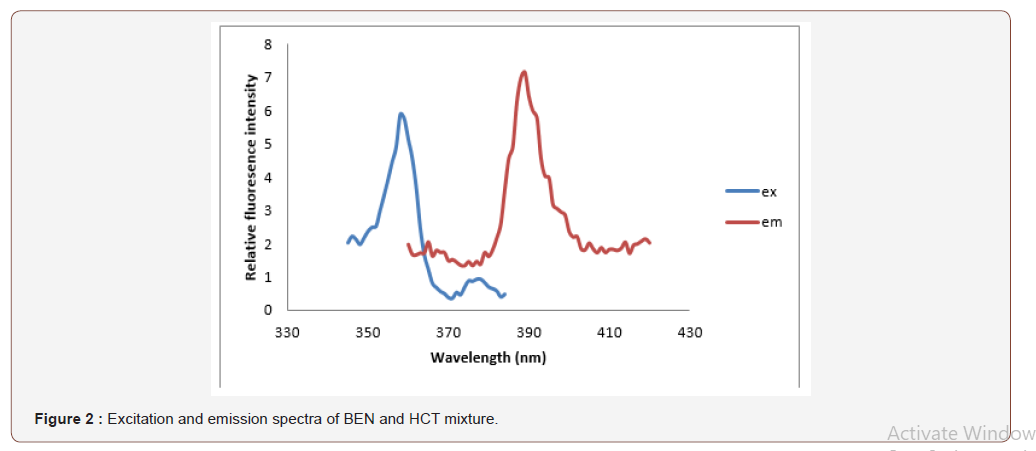
An investigation of the native fluorescence characteristics of BEN and HCT showed that both drugs are fluorescent in several solvent media. The choice of the proper solvent was based on sensitivity of measurement, stability of fluorescence readings, and background (blank) readings. Solvents investigated include water, acid solutions (acetic, sulphuric and phosphoric acids) and alcohols such as methanol and ethanol. Generally, aqueous solutions are better than methanol due to the high background fluorescence obtained by the use of methanol. Methanol solutions of BEN showed fluorescence at excitation and emission wavelengths 358 and 389 nm respectively, while methanol solutions of HCT exhibited much higher fluorescence at emission maximum 360 nm upon excitation at 389 nm and their mixture spectrum was shown Figure 2. The fact that each compound has its specific excitation and emission maxima without overlap from the other co-formulated compound allows the selective measurement and quantification of both compounds without prior separation. The stability of BEN and HCT solutions was followed by measuring the fluorescence intensity at 15-min intervals. Fluorescence intensity values were stable for at least 3h (Figure 2).

Analytical performance of the method
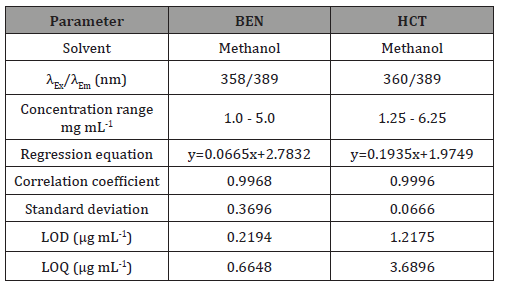
the proposed spectrofluorimetric procedure was evaluated by analyzing a series of different concentrations for each compound. The relative fluorescence intensities measured at the specified wavelengths were found to be proportional to the concentrations of the studied drugs. Table 1 presents the performance data and statistical parameters for the proposed method including linear regression equations, concentration ranges, correlation coefficients, standard deviations of the intercept (Sa), the slope (Sb) and the standard deviation of residuals (Sy/x). Regression analysis shows good linearity as indicated from the correlation coefficient values (>0.9967). In addition, linearity can be evaluated by calculation of the RSD% of the slope (Sb %) values which were found less than 1%.
Detection and quantification limits: The limit of detection (LOD) and the limit of quantification (LOQ), were calculated in accordance to the equations provided by The United States Pharmacopeia. LOD and LOQ are defined as 3sb-1 and10sb-1, respectively where s is the standard deviation of replicate blank responses at the working wavelengths and b is the slope of the calibration graph. Both LOD and LOQ values (Table 1) confirm the sensitivity of the proposed spectrofluorimetric method particularly for the determination of BEN and HCT (Table 1).
Table 1:

Precision: The within-day precision for the described method was examined at three concentration levels for each compound using three replicate determinations for each concentration within one day. Similarly, the between-day precision was tested by analyzing the same three concentrations for each compound using three replicate determinations repeated on three days. Concentrations found were calculated using the corresponding regression equations and they were satisfactory. The percentage relative standard deviation (RSD%) and percentage relative error (Er%) did not exceed 1.5% indicating the high repeatability of the developed method for the estimation of BEN and HCT in their bulk form.
Conclusion
In this study the presence of BEN and HCT were utilized for the development of a simple spectrofluorimetric method for the determination of the cited drug. The method offers some advantages including high sensitivity, low cost analysis and selectivity for the determination of BEN in presence of HCT. The procedure was adopted to content uniformity testing of some of the commercial available tablets containing BEN.
Acknowledgement
None.
Conflict of Interest
No conflict of interest.
References
- El-Yazbi FA, Abdine HH, Shaalan RA (1999) Spectrophotometric and spectrofluorimetric methods for the assay of lisinopril in single and multicomponent pharmaceutical dosage forms. Journal of Pharmaceutical and Biomedical Analysis 19: 819-827.
- Abd El-Hay, Soad S, Colyer, Christa L, Wafaa S, et al. (2013) NBD-Cl for the spectrophotometric and spectrofluorimetric determination of several antihistamine and antihypertensive drugs. Journal of AOAC International 96: 968-975.
- Shaalan, Rasha A, Belal, Tarek S (2010) Simultaneous spectrofluorimetric determination of amplodipine besylate and valsartan in their combined tablets. Drug Testing and Analysis 2: 489-493.
- Mohammed Fatma F, El-Din Khalid M Badr, Derayea Sayed M (2018) Switch on fluorescence probe for the selective determination of lisinopril in pharmaceutical formulations: application to content uniformity testing. RSC Advances 8: 16269-16277.
-
A Hakan AKTAŞ, Tuğçe PEKUZ. A Sensıtıve and Sımple Spectrofluorımetric Method for Analysıs Antı-Hypertensıve Drugs in Pharmaceutıcal Preparatıons. Insi in Org & Inorg. 1(1): 2020. IOIC.MS.ID.000504.
-
Spectrofluorımetric, Antı-Hypertensıve Drugs, Pharmaceutıcal preparations, Chemistry, fluorescence intensity, Pharmaceutical additives, Benazepril HCl, Hydrochlorothiazide, Spectrofuorimetry
-

This work is licensed under a Creative Commons Attribution-NonCommercial 4.0 International License.


